| Param | Original file | Final file |
|---|---|---|
| Filename | modeM0/AS1A12_054T01_9000005392_38656cztM0_level2.fits | modeM0/AS1A12_054T01_9000005392_38656cztM0_level2_quad_clean.evt |
| Size (bytes) | 125,349,120 | 34,678,080 |
| Size | 119.5 MB | 33.1 MB |
| Events in quadrant A | 1,091,402 | 236,279 |
| Events in quadrant B | 1,310,858 | 226,468 |
| Events in quadrant C | 973,355 | 227,974 |
| Events in quadrant D | 1,103,629 | 211,525 |
| Mode M9 | |||
|---|---|---|---|
| Quadrant | BADHDUFLAG | Total packets | Discarded packets |
| A | 0 | 13 | 0 |
| B | 0 | 13 | 0 |
| C | 0 | 13 | 0 |
| D | 0 | 13 | 0 |
| Mode SS | |||
|---|---|---|---|
| Quadrant | BADHDUFLAG | Total packets | Discarded packets |
| A | 0 | 44 | 0 |
| B | 0 | 44 | 0 |
| C | 0 | 44 | 0 |
| D | 0 | 44 | 0 |
| Mode M0 | |||
|---|---|---|---|
| Quadrant | BADHDUFLAG | Total packets | Discarded packets |
| A | 0 | 4452 | 2 |
| B | 0 | 5282 | 1 |
| C | 0 | 4145 | 1 |
| D | 0 | 4672 | 1 |
| Quadrant | Total seconds | Saturated seconds | Saturation percentage |
|---|---|---|---|
| A | 2033 | 9 | 0.442696% |
| B | 2033 | 116 | 5.705853% |
| C | 2033 | 3 | 0.147565% |
| D | 2033 | 37 | 1.819970% |
Noise dominated data is calculated using 1-second bins in cleaned event files. If a bin has >2000 counts, and if more than 50% of those come from <1% of pixels, then it is considered to be noise-dominated and hence unusable.
| Quadrant | # 1 sec bins | Bins with >0 counts | Bins with >2000 counts | High rate bins dominated by noise | Noise dominated (total time) | Noise dominated (detector-on time) | Marked lightcurve |
|---|---|---|---|---|---|---|---|
| A | 3346 | 2034 | 5 | 5 | 0.15% | 0.25% | 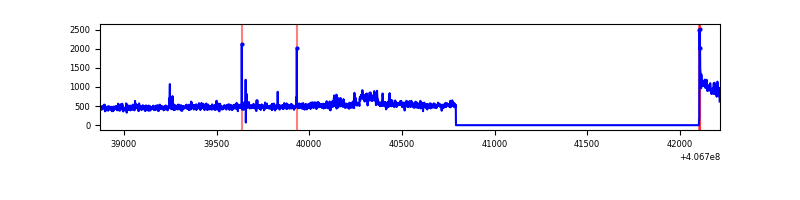 |
| B | 3346 | 2034 | 103 | 103 | 3.08% | 5.06% | 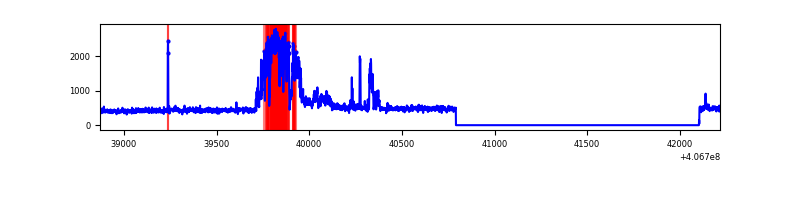 |
| C | 3346 | 2034 | 3 | 3 | 0.09% | 0.15% | 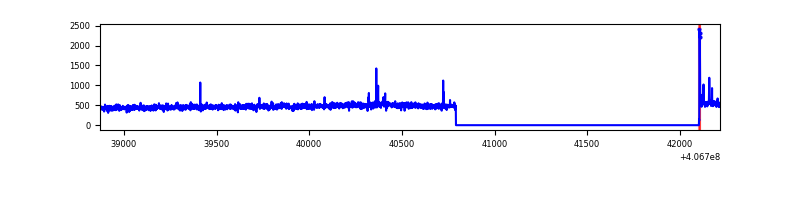 |
| D | 3346 | 2034 | 32 | 32 | 0.96% | 1.57% | 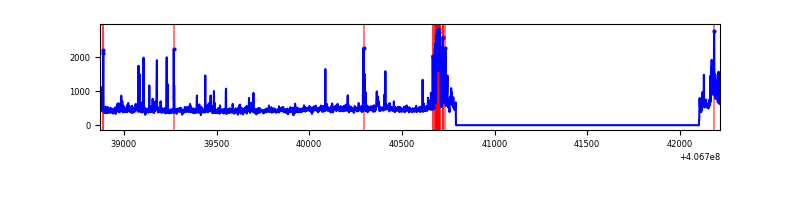 |
Top three noisy pixels from each quadrant. If the there are fewer than three noisy pixels in the level2.evt file, extra rows are filled as -1
| Pixel properties | Quadrant properties | ||||||
|---|---|---|---|---|---|---|---|
| Quadrant | DetID | PixID | Counts | Sigma | Mean | Median | Sigma |
| A | 10 | 83 | 135521 | 2752.08 | 232 | 227 | 49.2 |
| A | 9 | 143 | 38455 | 777.61 | 232 | 227 | 49.2 |
| A | 12 | 227 | 7791 | 153.86 | 232 | 227 | 49.2 |
| B | 5 | 184 | 402385 | 8848.93 | 225 | 219 | 45.4 |
| B | 12 | 111 | 5556 | 117.43 | 225 | 219 | 45.4 |
| B | 15 | 85 | 5543 | 117.14 | 225 | 219 | 45.4 |
| C | 15 | 214 | 79769 | 1474.83 | 222 | 223 | 53.9 |
| C | 14 | 254 | 10705 | 194.34 | 222 | 223 | 53.9 |
| C | 0 | 10 | 9933 | 180.03 | 222 | 223 | 53.9 |
| D | 12 | 227 | 99074 | 1747.21 | 221 | 214 | 56.6 |
| D | 12 | 6 | 39616 | 696.38 | 221 | 214 | 56.6 |
| D | 13 | 249 | 35390 | 621.69 | 221 | 214 | 56.6 |
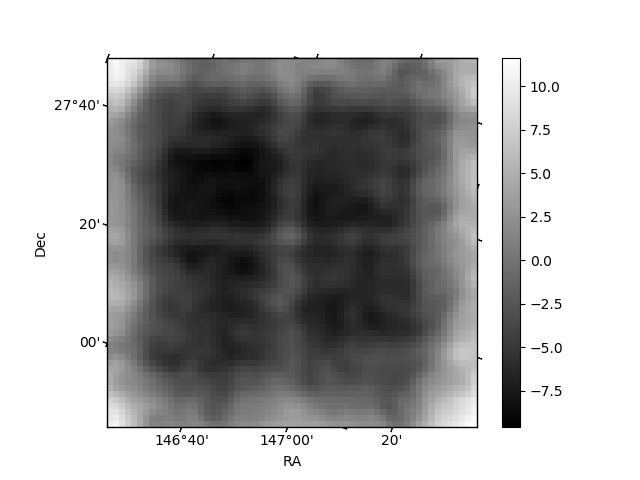
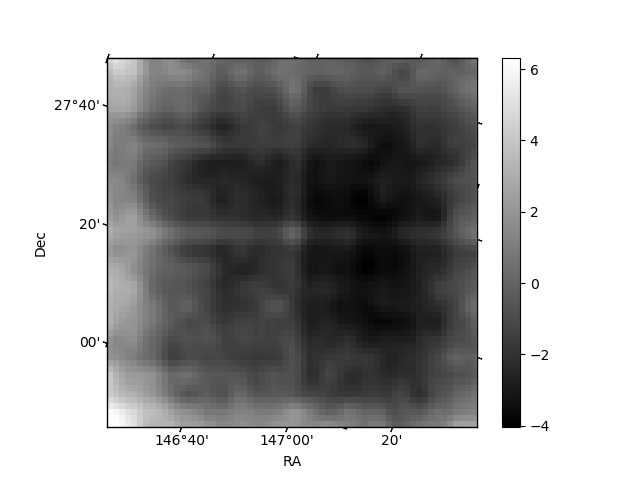
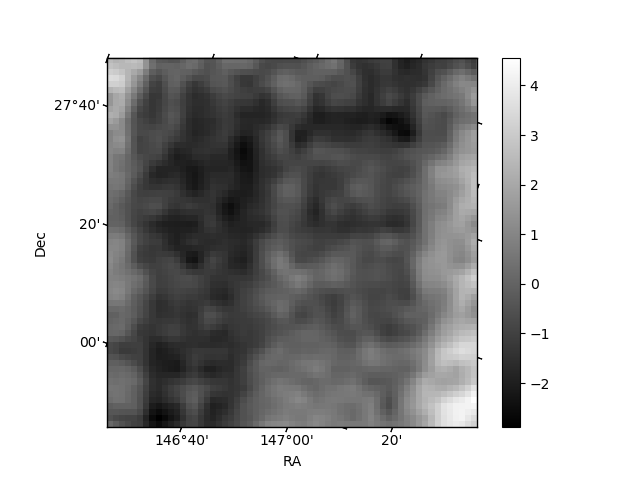
Histogram calculated using DETX and DETY for each event in the final _common_clean file
| Quadrant A | 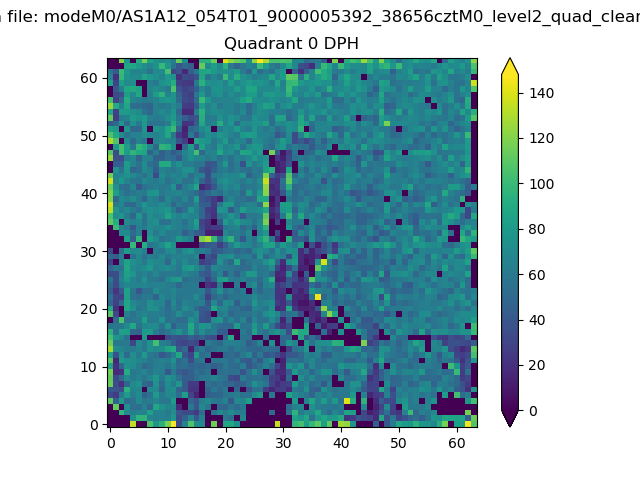 |
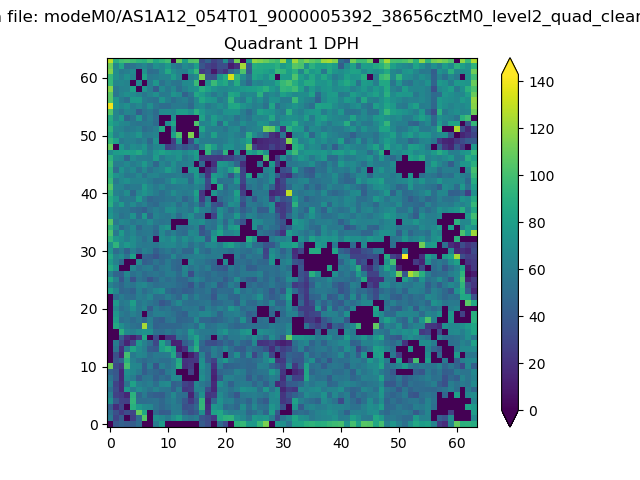 |
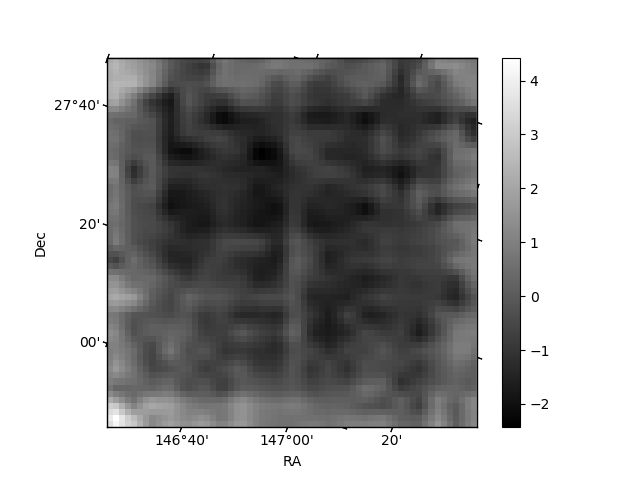
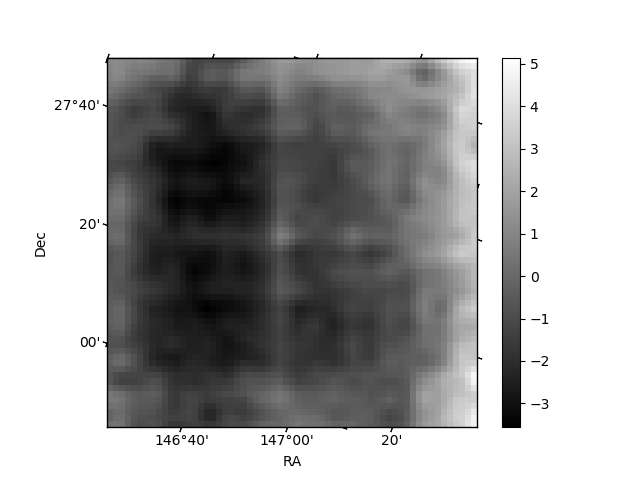
Quadrant B |
|---|---|---|---|
| Quadrant D | 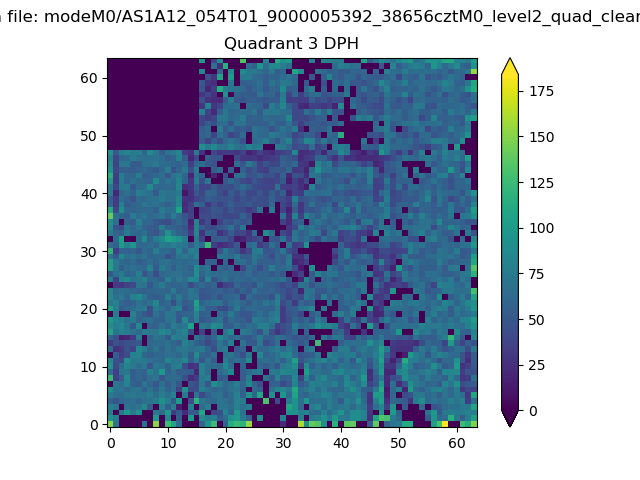 |
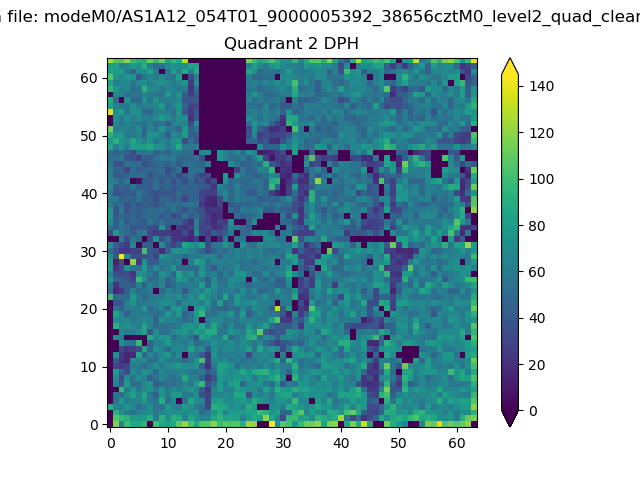 |
Quadrant C |
| Plot type | Count rate plots | Images |
|---|---|---|
| Comparison with Poisson distribution Blue bars denote a histogram of data divided into 1 sec bins. Red curve is a Poisson curve with rate = median count rate of data. |
 |
 |
| Quadrant-wise count rates Data is divided into 100 sec bins |
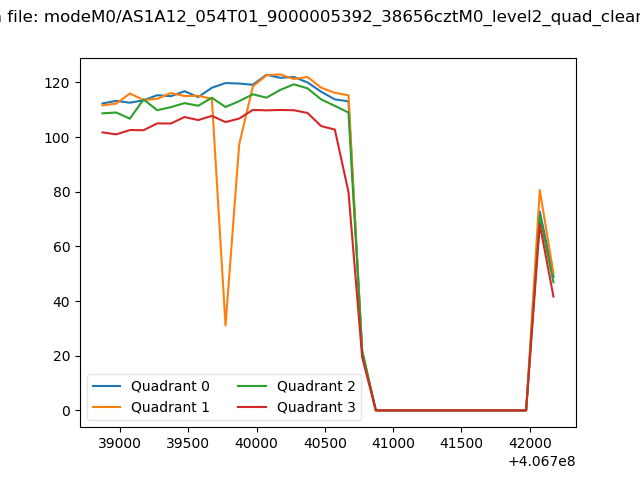 |
|
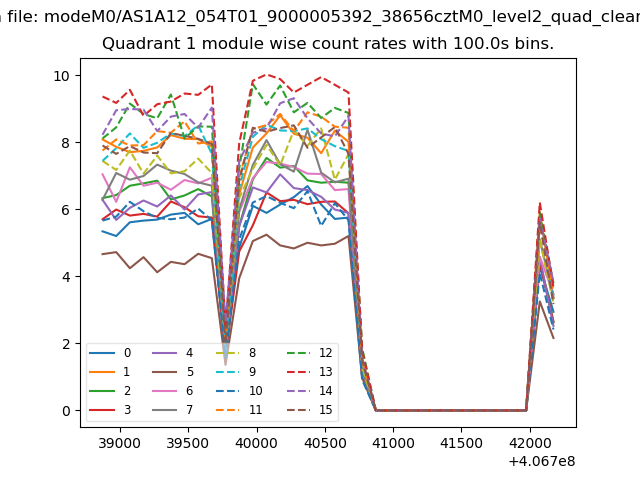
| Module-wise count rates for Quadrant A Data is divided into 100 sec bins |
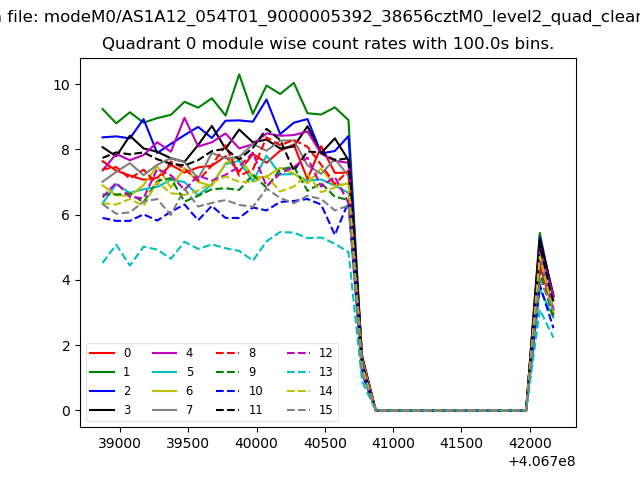 |
 |
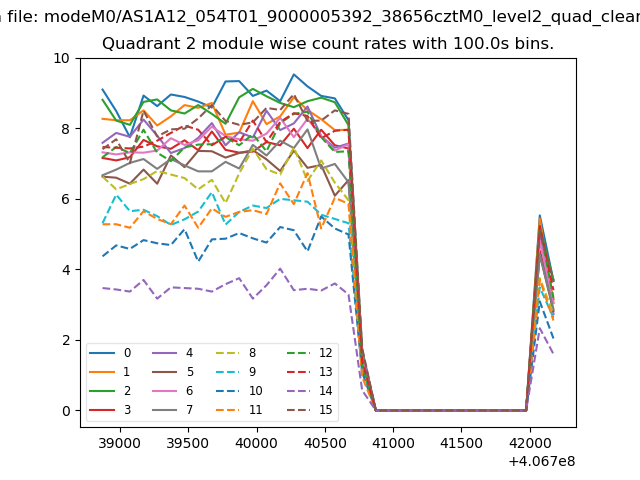
| Module-wise count rates for Quadrant B Data is divided into 100 sec bins |
 |
 |
| Module-wise count rates for Quadrant C Data is divided into 100 sec bins |
 |
 |
| Module-wise count rates for Quadrant D Data is divided into 100 sec bins |
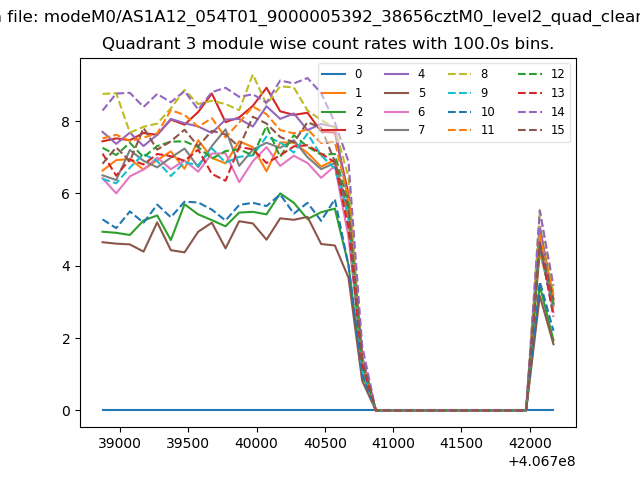 |
 |
| Parameter | Plot |
|---|---|
| CZT HV Monitor | 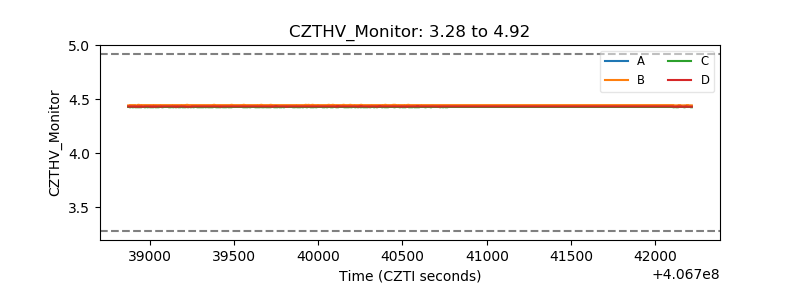 |
| D_VDD | 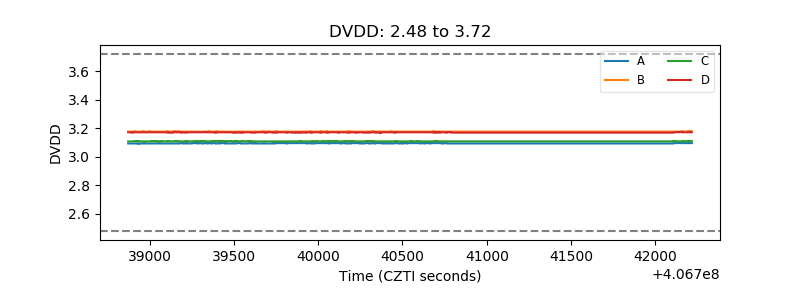 |
| Temperature 1 | 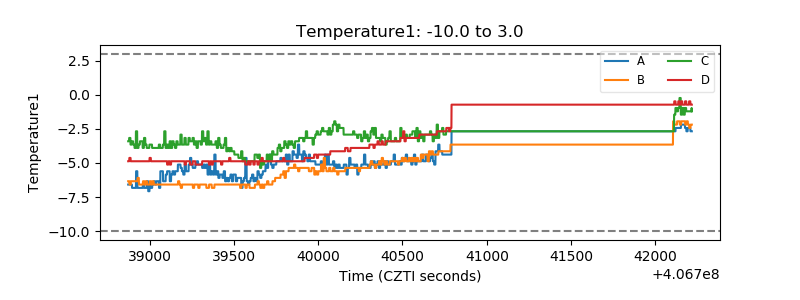 |
| Veto HV Monitor | 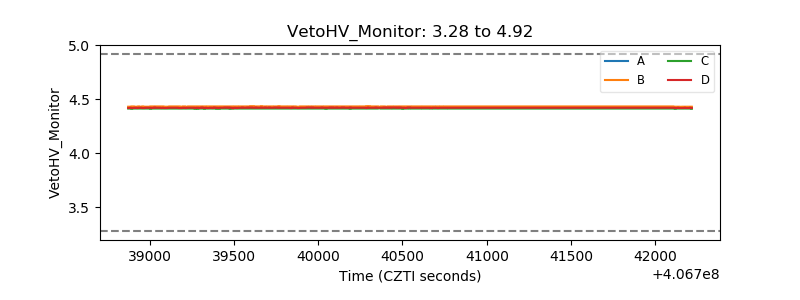 |
| Veto LLD | 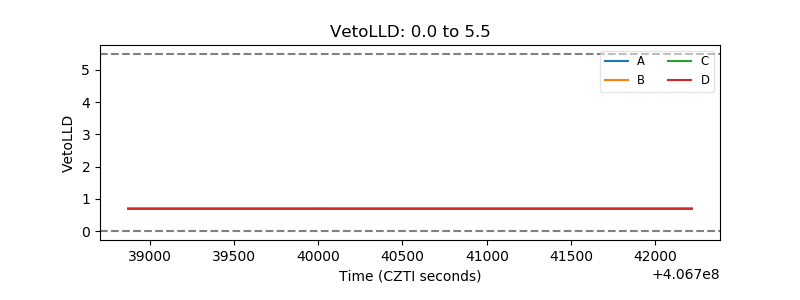 |
| Alpha Counter | 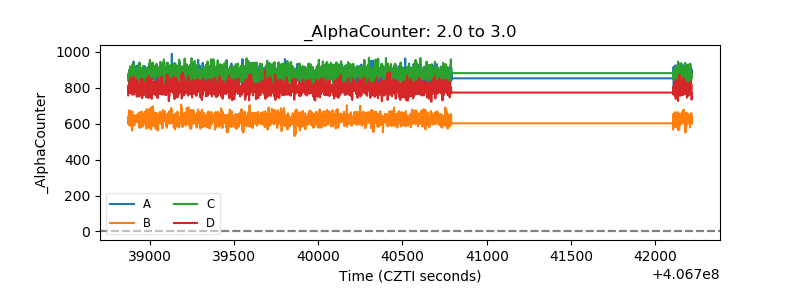 |
| _CPM_Rate | 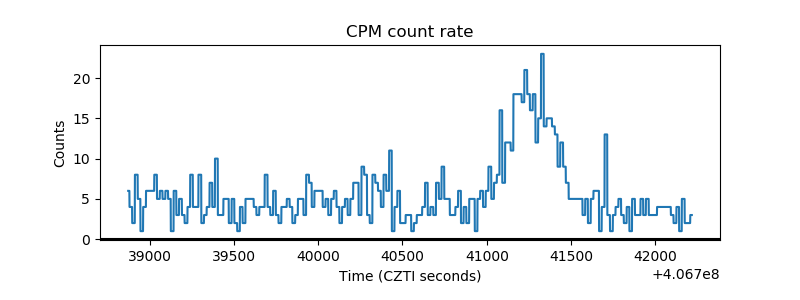 |
| CZT Counter | 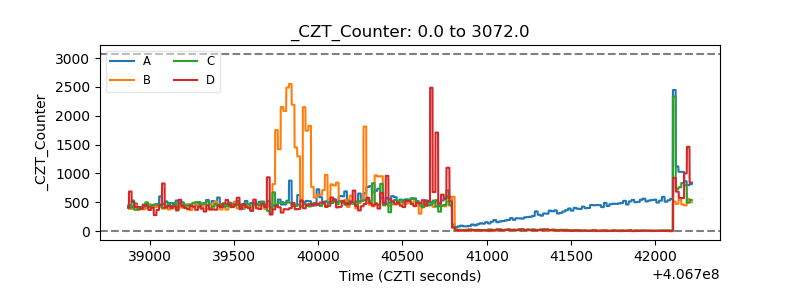 |
| +2.5 Volts monitor | 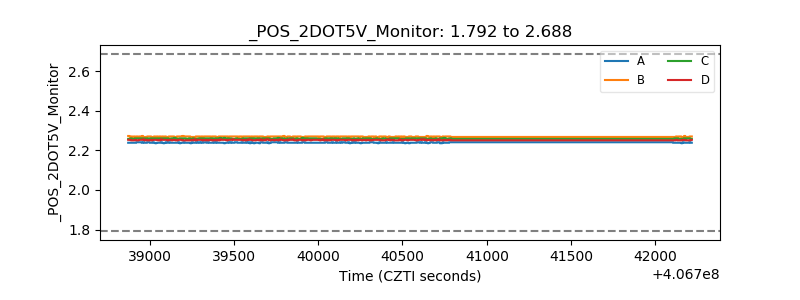 |
| +5 Volts monitor | 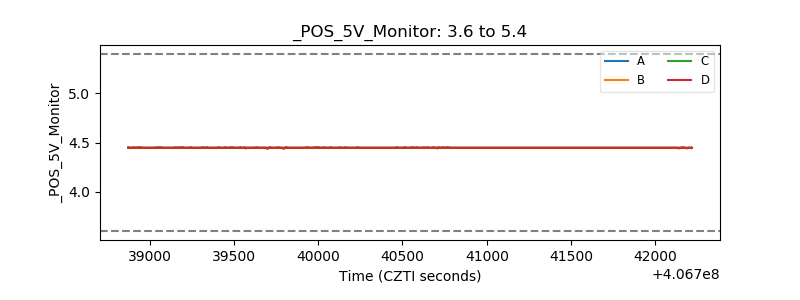 |
| _ROLL_ROT | 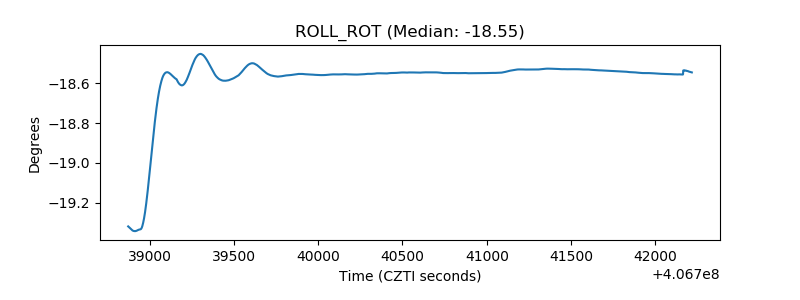 |
| _Roll_DEC | 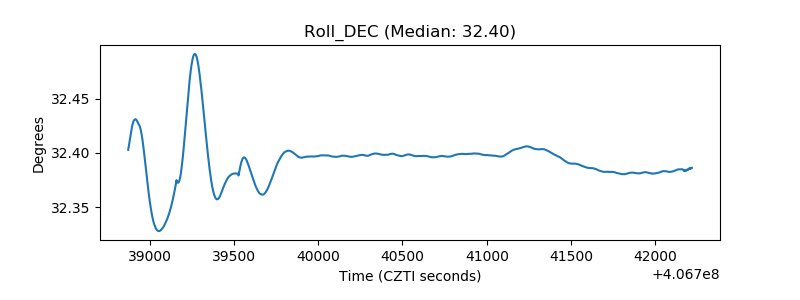 |
| _Roll_RA | 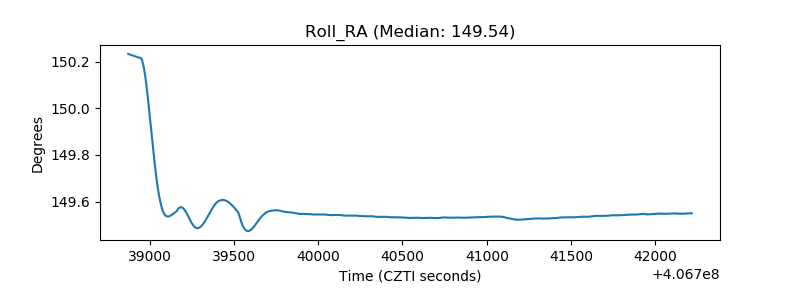 |
| Veto Counter | 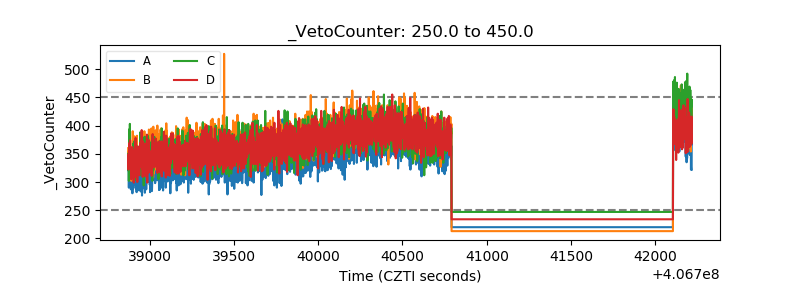 |