| Param | Original file | Final file |
|---|---|---|
| Filename | modeM0/AS1A12_054T01_9000005392_38658cztM0_level2.fits | modeM0/AS1A12_054T01_9000005392_38658cztM0_level2_quad_clean.evt |
| Size (bytes) | 704,983,680 | 173,612,160 |
| Size | 672.3 MB | 165.6 MB |
| Events in quadrant A | 6,337,664 | 1,189,804 |
| Events in quadrant B | 6,444,463 | 1,142,906 |
| Events in quadrant C | 5,453,668 | 1,154,009 |
| Events in quadrant D | 7,031,557 | 1,029,902 |
| Mode M9 | |||
|---|---|---|---|
| Quadrant | BADHDUFLAG | Total packets | Discarded packets |
| A | 0 | 31 | 0 |
| B | 0 | 31 | 0 |
| C | 0 | 31 | 0 |
| D | 0 | 32 | 0 |
| Mode SS | |||
|---|---|---|---|
| Quadrant | BADHDUFLAG | Total packets | Discarded packets |
| A | 0 | 218 | 0 |
| B | 0 | 218 | 0 |
| C | 0 | 218 | 0 |
| D | 0 | 218 | 0 |
| Mode M0 | |||
|---|---|---|---|
| Quadrant | BADHDUFLAG | Total packets | Discarded packets |
| A | 0 | 25645 | 4 |
| B | 0 | 26520 | 3 |
| C | 0 | 22949 | 3 |
| D | 0 | 28164 | 3 |
| Quadrant | Total seconds | Saturated seconds | Saturation percentage |
|---|---|---|---|
| A | 10685 | 166 | 1.553580% |
| B | 10685 | 669 | 6.261114% |
| C | 10685 | 109 | 1.020122% |
| D | 10685 | 597 | 5.587272% |
Noise dominated data is calculated using 1-second bins in cleaned event files. If a bin has >2000 counts, and if more than 50% of those come from <1% of pixels, then it is considered to be noise-dominated and hence unusable.
| Quadrant | # 1 sec bins | Bins with >0 counts | Bins with >2000 counts | High rate bins dominated by noise | Noise dominated (total time) | Noise dominated (detector-on time) | Marked lightcurve |
|---|---|---|---|---|---|---|---|
| A | 13491 | 10686 | 138 | 138 | 1.02% | 1.29% | 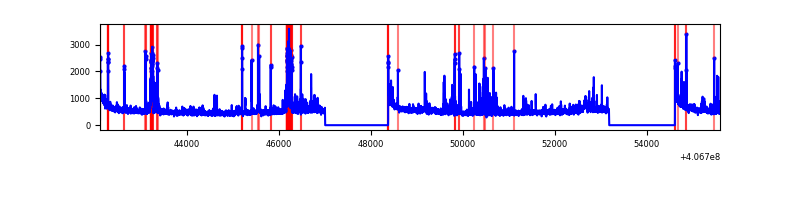 |
| B | 13491 | 10686 | 570 | 570 | 4.23% | 5.33% | 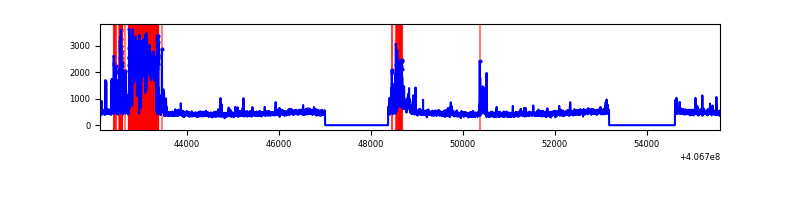 |
| C | 13491 | 10686 | 92 | 92 | 0.68% | 0.86% | 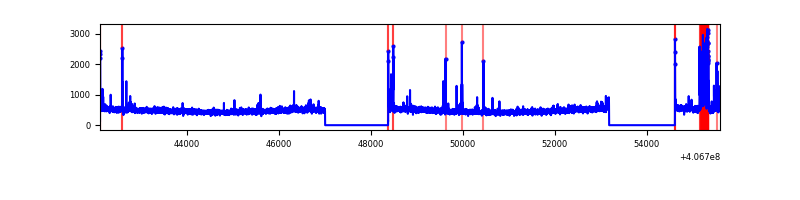 |
| D | 13491 | 10686 | 514 | 514 | 3.81% | 4.81% | 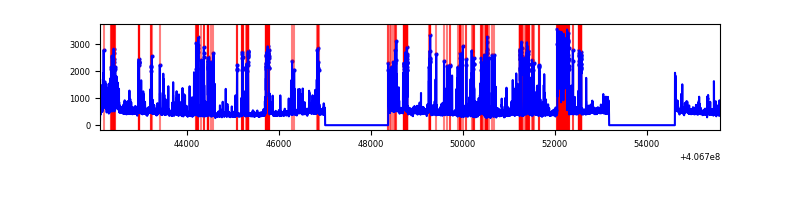 |
Top three noisy pixels from each quadrant. If the there are fewer than three noisy pixels in the level2.evt file, extra rows are filled as -1
| Pixel properties | Quadrant properties | ||||||
|---|---|---|---|---|---|---|---|
| Quadrant | DetID | PixID | Counts | Sigma | Mean | Median | Sigma |
| A | 10 | 83 | 742859 | 3063.77 | 1201 | 1177 | 242.1 |
| A | 13 | 248 | 479214 | 1974.7 | 1201 | 1177 | 242.1 |
| A | 9 | 143 | 390540 | 1608.4 | 1201 | 1177 | 242.1 |
| B | 5 | 184 | 1795496 | 8059.47 | 1151 | 1119 | 222.6 |
| B | 15 | 32 | 33869 | 147.1 | 1151 | 1119 | 222.6 |
| B | 12 | 111 | 28087 | 121.13 | 1151 | 1119 | 222.6 |
| C | 15 | 214 | 426884 | 1553.33 | 1169 | 1175 | 274.1 |
| C | 2 | 16 | 296295 | 1076.84 | 1169 | 1175 | 274.1 |
| C | 14 | 254 | 97206 | 350.4 | 1169 | 1175 | 274.1 |
| D | 12 | 6 | 1172976 | 4183.29 | 1148 | 1116 | 280.1 |
| D | 13 | 249 | 458466 | 1632.64 | 1148 | 1116 | 280.1 |
| D | 12 | 233 | 226349 | 804.03 | 1148 | 1116 | 280.1 |
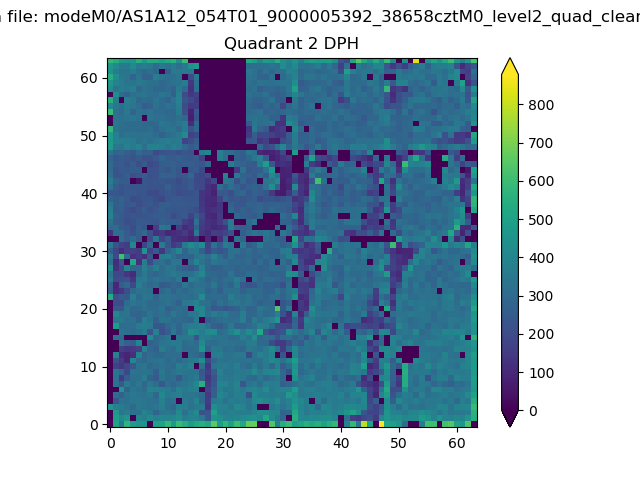
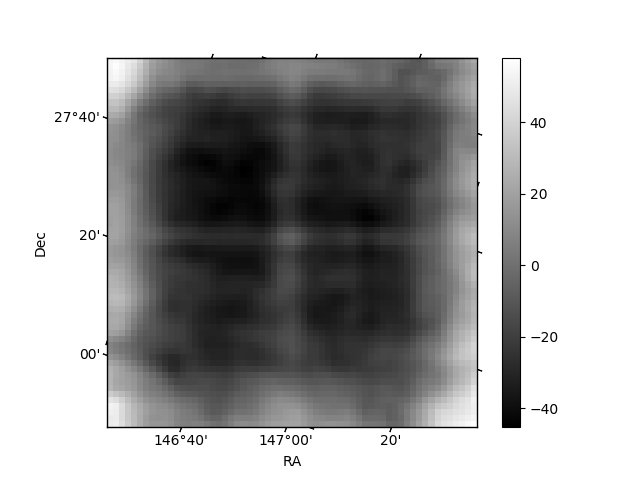
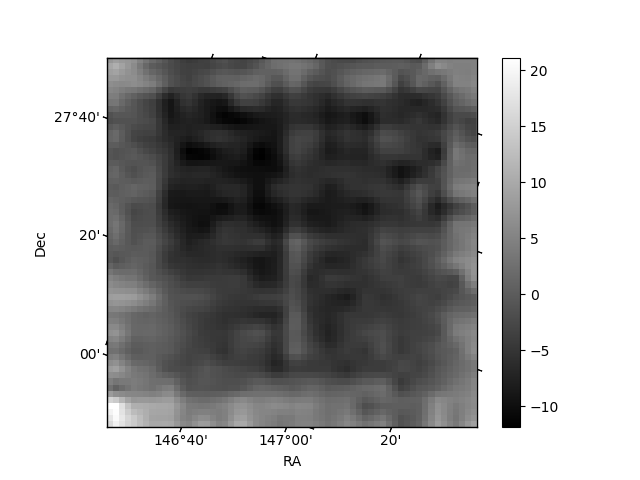
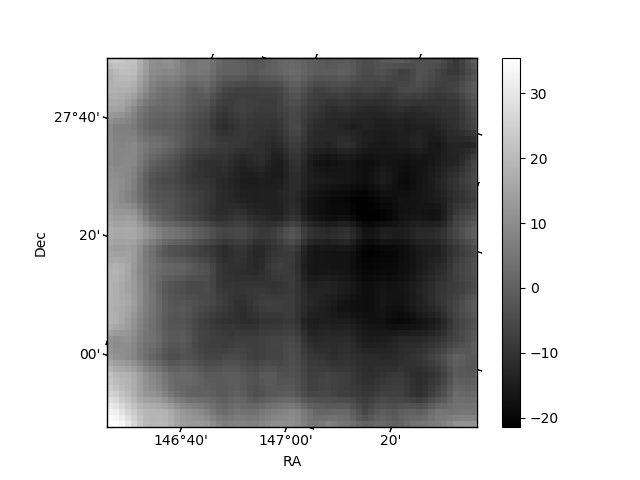
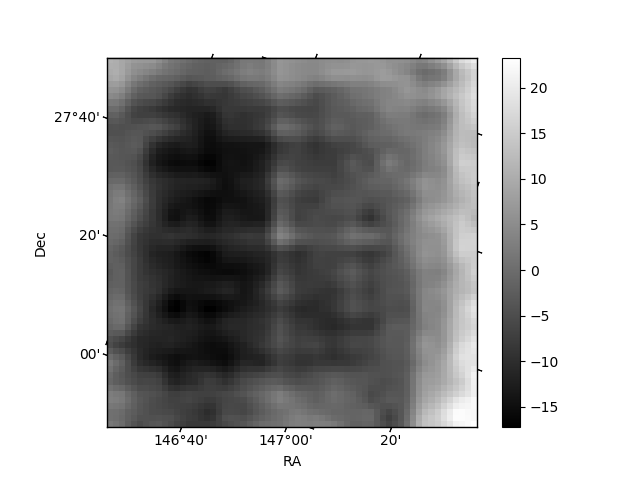
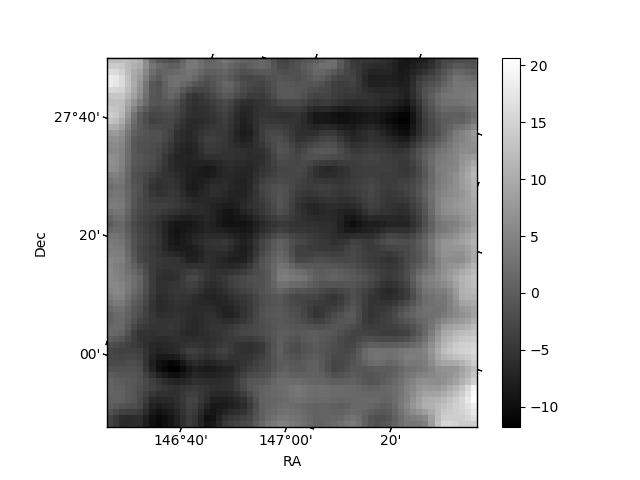
Histogram calculated using DETX and DETY for each event in the final _common_clean file
| Quadrant A | 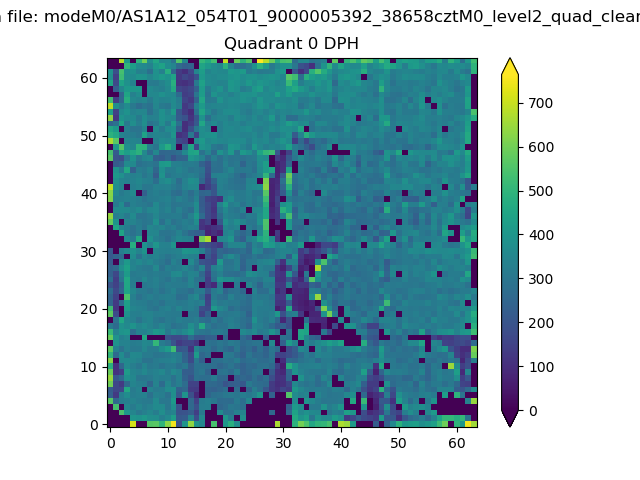 |
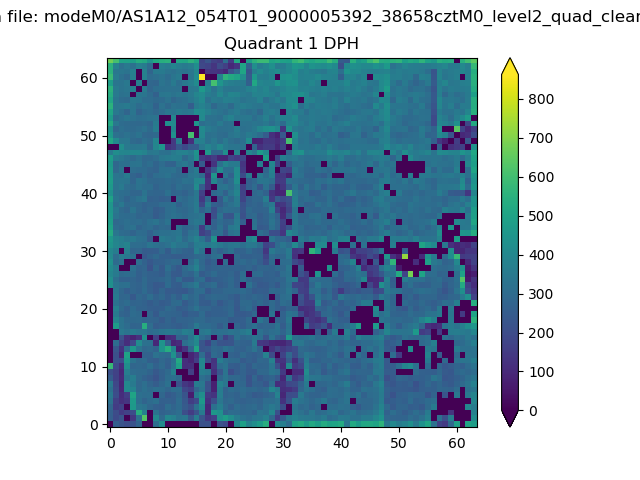 |
Quadrant B |
|---|---|---|---|
| Quadrant D | 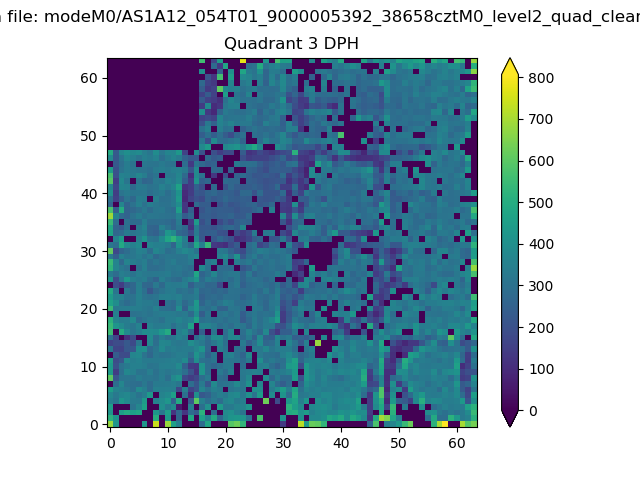 |
 |
Quadrant C |
| Plot type | Count rate plots | Images |
|---|---|---|
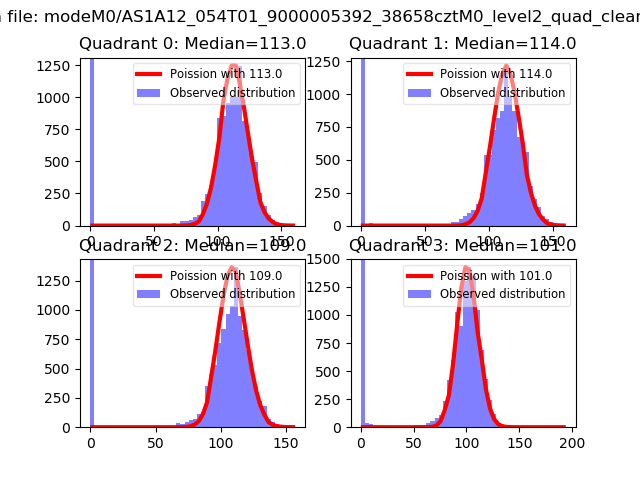
| Comparison with Poisson distribution Blue bars denote a histogram of data divided into 1 sec bins. Red curve is a Poisson curve with rate = median count rate of data. |
 |
 |
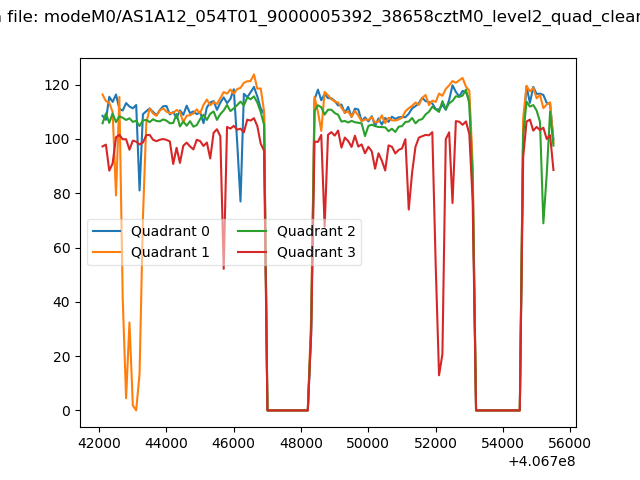
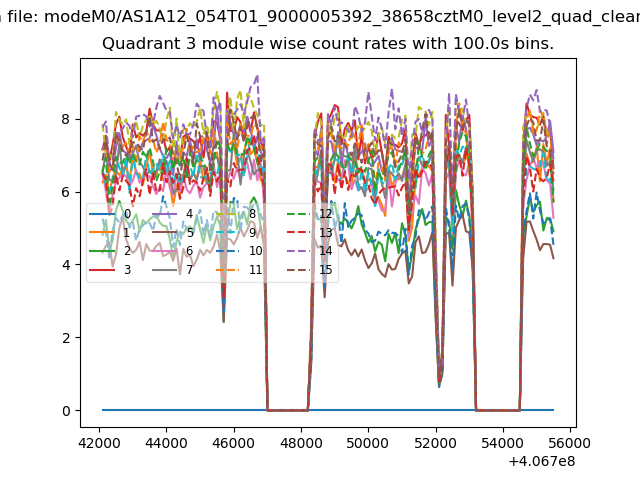
| Quadrant-wise count rates Data is divided into 100 sec bins |
 |
|
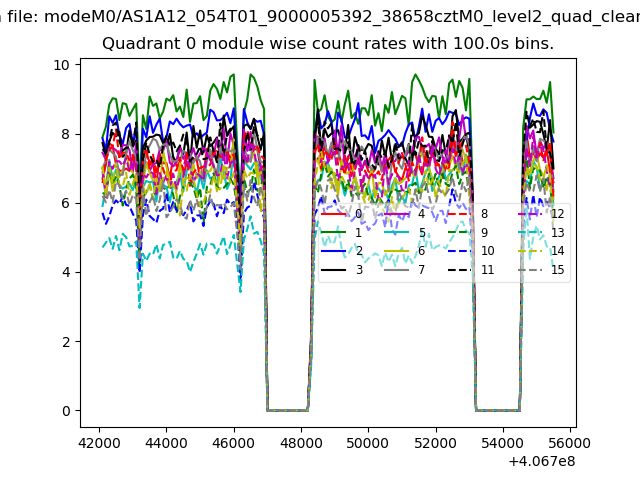
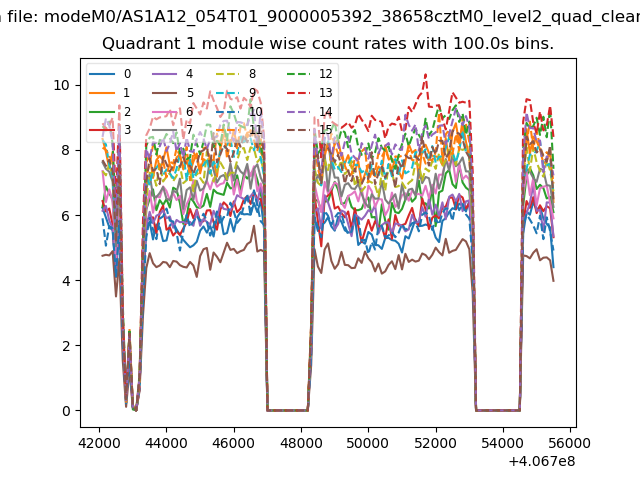
| Module-wise count rates for Quadrant A Data is divided into 100 sec bins |
 |
 |
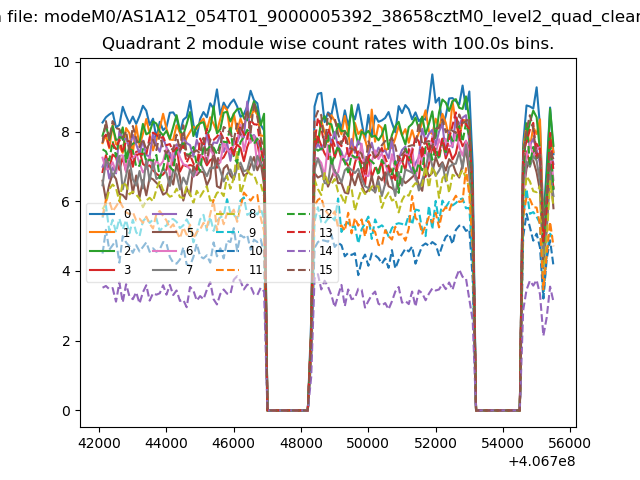
| Module-wise count rates for Quadrant B Data is divided into 100 sec bins |
 |
 |
| Module-wise count rates for Quadrant C Data is divided into 100 sec bins |
 |
 |
| Module-wise count rates for Quadrant D Data is divided into 100 sec bins |
 |
 |
| Parameter | Plot |
|---|---|
| CZT HV Monitor | 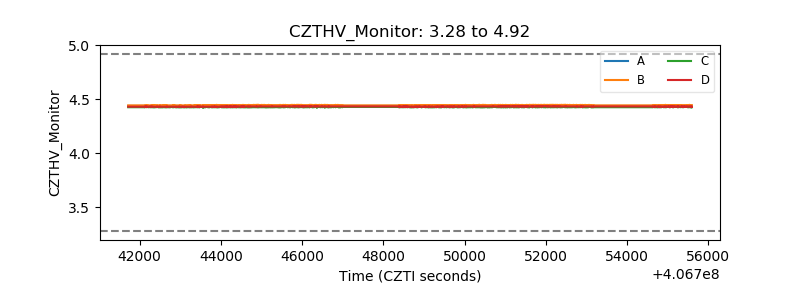 |
| D_VDD | 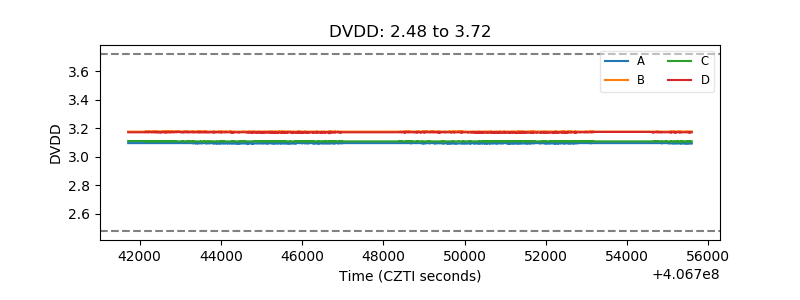 |
| Temperature 1 | 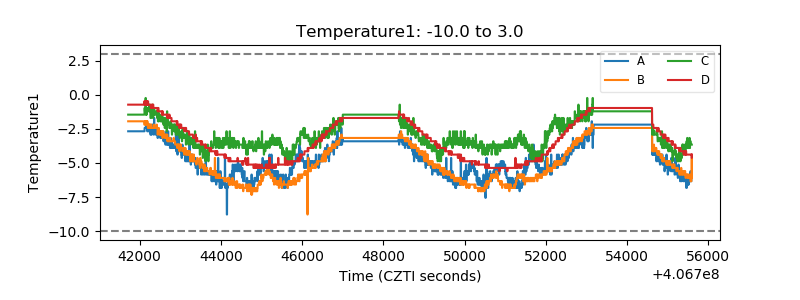 |
| Veto HV Monitor | 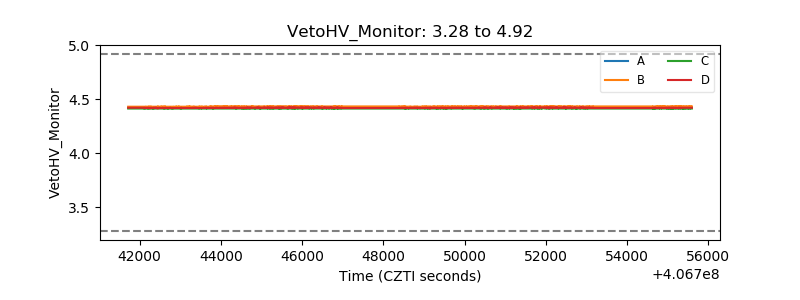 |
| Veto LLD | 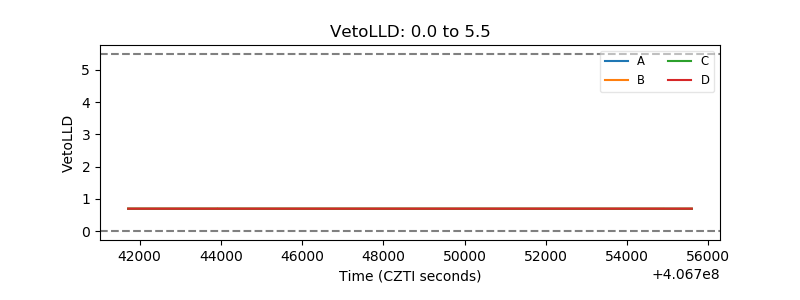 |
| Alpha Counter | 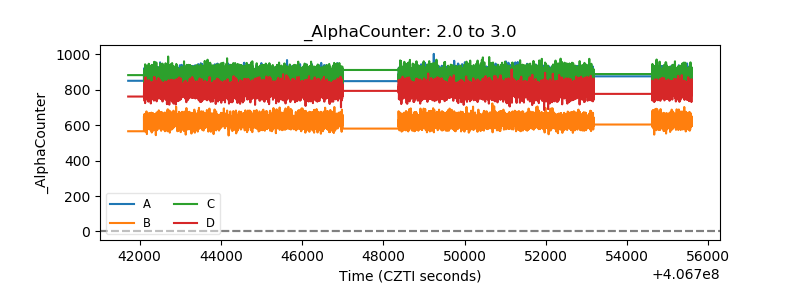 |
| _CPM_Rate | 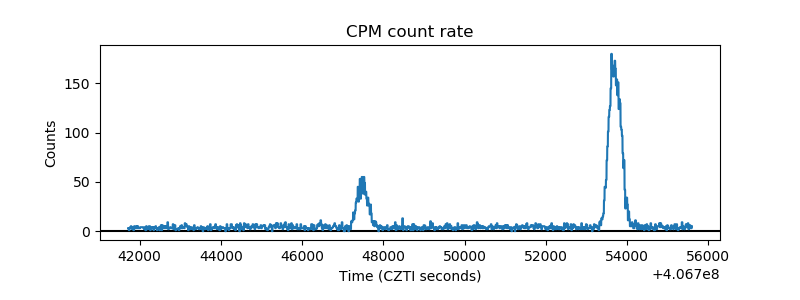 |
| CZT Counter |  |
| +2.5 Volts monitor | 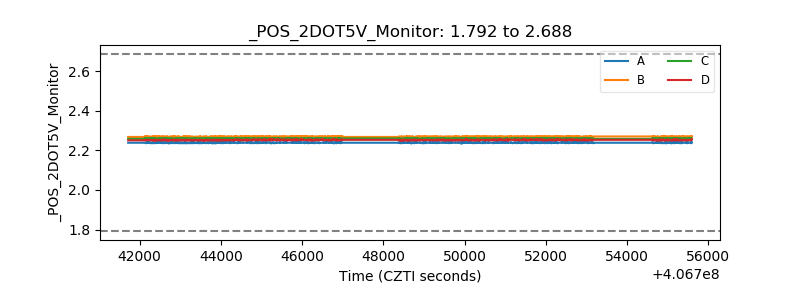 |
| +5 Volts monitor | 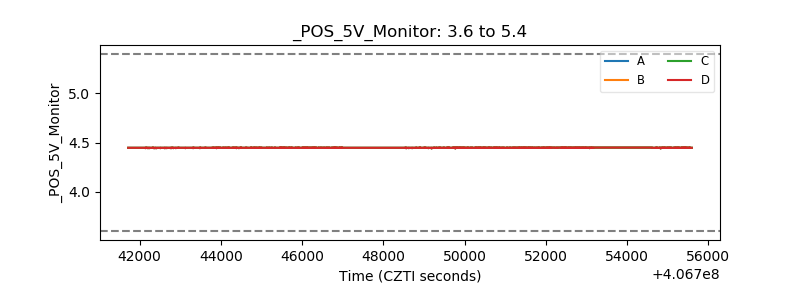 |
| _ROLL_ROT | 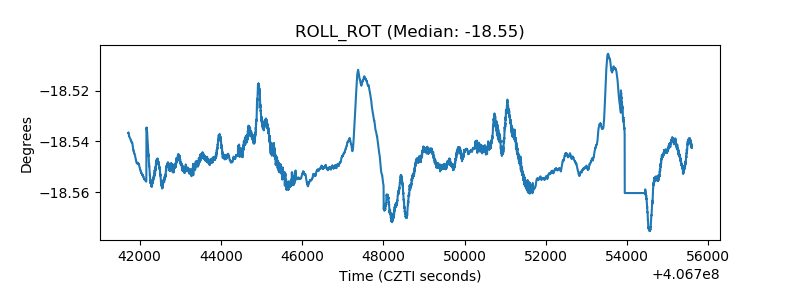 |
| _Roll_DEC | 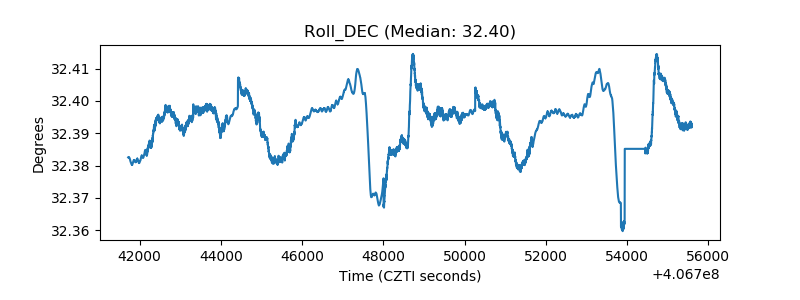 |
| _Roll_RA | 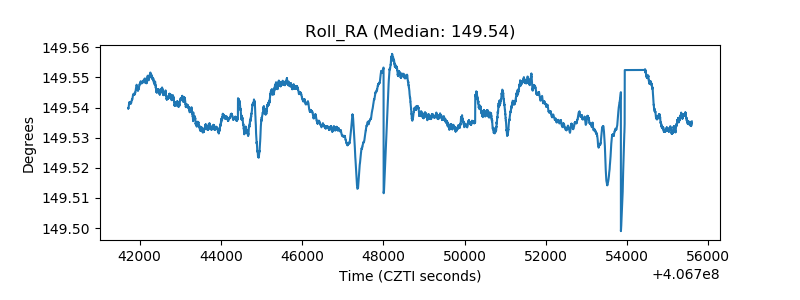 |
| Veto Counter | 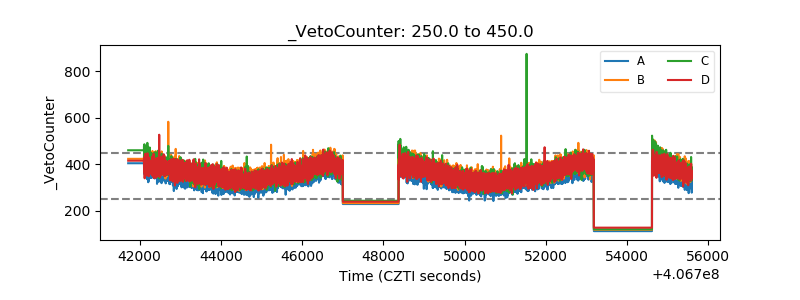 |