| Param | Original file | Final file |
|---|---|---|
| Filename | modeM0/AS1A12_054T01_9000005392_38659cztM0_level2.fits | modeM0/AS1A12_054T01_9000005392_38659cztM0_level2_quad_clean.evt |
| Size (bytes) | 363,384,000 | 93,139,200 |
| Size | 346.5 MB | 88.8 MB |
| Events in quadrant A | 3,192,625 | 635,934 |
| Events in quadrant B | 2,595,368 | 643,030 |
| Events in quadrant C | 3,033,630 | 611,098 |
| Events in quadrant D | 4,190,967 | 535,691 |
| Mode M9 | |||
|---|---|---|---|
| Quadrant | BADHDUFLAG | Total packets | Discarded packets |
| A | 0 | 27 | 0 |
| B | 0 | 27 | 0 |
| C | 0 | 27 | 0 |
| D | 0 | 28 | 0 |
| Mode SS | |||
|---|---|---|---|
| Quadrant | BADHDUFLAG | Total packets | Discarded packets |
| A | 0 | 116 | 0 |
| B | 0 | 116 | 0 |
| C | 0 | 116 | 0 |
| D | 0 | 116 | 0 |
| Mode M0 | |||
|---|---|---|---|
| Quadrant | BADHDUFLAG | Total packets | Discarded packets |
| A | 0 | 13165 | 3 |
| B | 0 | 11583 | 2 |
| C | 0 | 12552 | 2 |
| D | 0 | 16335 | 2 |
| Quadrant | Total seconds | Saturated seconds | Saturation percentage |
|---|---|---|---|
| A | 5634 | 44 | 0.780973% |
| B | 5634 | 24 | 0.425985% |
| C | 5634 | 100 | 1.774938% |
| D | 5634 | 479 | 8.501952% |
Noise dominated data is calculated using 1-second bins in cleaned event files. If a bin has >2000 counts, and if more than 50% of those come from <1% of pixels, then it is considered to be noise-dominated and hence unusable.
| Quadrant | # 1 sec bins | Bins with >0 counts | Bins with >2000 counts | High rate bins dominated by noise | Noise dominated (total time) | Noise dominated (detector-on time) | Marked lightcurve |
|---|---|---|---|---|---|---|---|
| A | 7186 | 5634 | 27 | 27 | 0.38% | 0.48% | 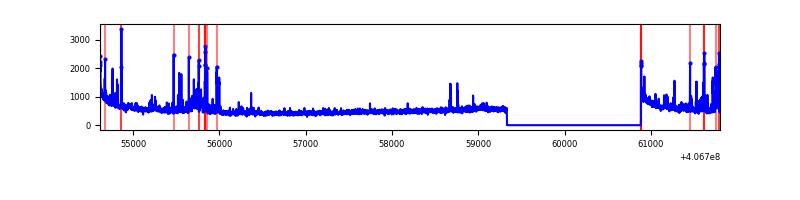 |
| B | 7186 | 5634 | 14 | 14 | 0.19% | 0.25% | 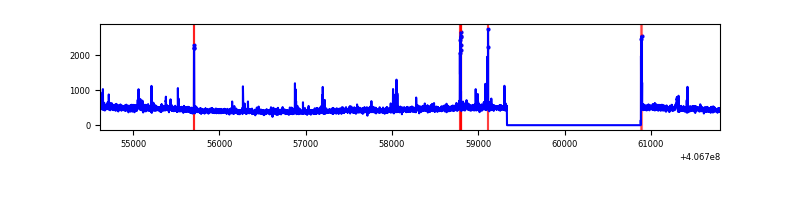 |
| C | 7186 | 5634 | 86 | 86 | 1.20% | 1.53% | 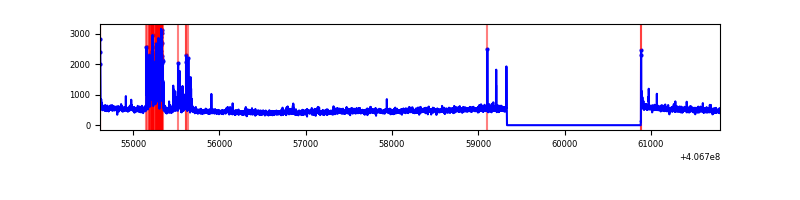 |
| D | 7186 | 5634 | 498 | 498 | 6.93% | 8.84% | 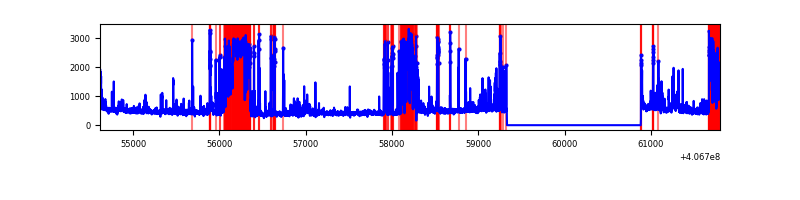 |
Top three noisy pixels from each quadrant. If the there are fewer than three noisy pixels in the level2.evt file, extra rows are filled as -1
| Pixel properties | Quadrant properties | ||||||
|---|---|---|---|---|---|---|---|
| Quadrant | DetID | PixID | Counts | Sigma | Mean | Median | Sigma |
| A | 10 | 83 | 415404 | 3208.15 | 631 | 620 | 129.3 |
| A | 9 | 143 | 150301 | 1157.71 | 631 | 620 | 129.3 |
| A | 13 | 248 | 148414 | 1143.11 | 631 | 620 | 129.3 |
| B | 5 | 184 | 40550 | 322.95 | 629 | 612 | 123.7 |
| B | 5 | 172 | 38211 | 304.04 | 629 | 612 | 123.7 |
| B | 4 | 251 | 15787 | 122.71 | 629 | 612 | 123.7 |
| C | 2 | 16 | 355303 | 2447.28 | 614 | 617 | 144.9 |
| C | 15 | 214 | 226216 | 1556.6 | 614 | 617 | 144.9 |
| C | 14 | 254 | 27001 | 182.05 | 614 | 617 | 144.9 |
| D | 12 | 6 | 1238844 | 8324.73 | 598 | 579 | 148.7 |
| D | 12 | 233 | 106045 | 709.04 | 598 | 579 | 148.7 |
| D | 1 | 232 | 102204 | 683.21 | 598 | 579 | 148.7 |
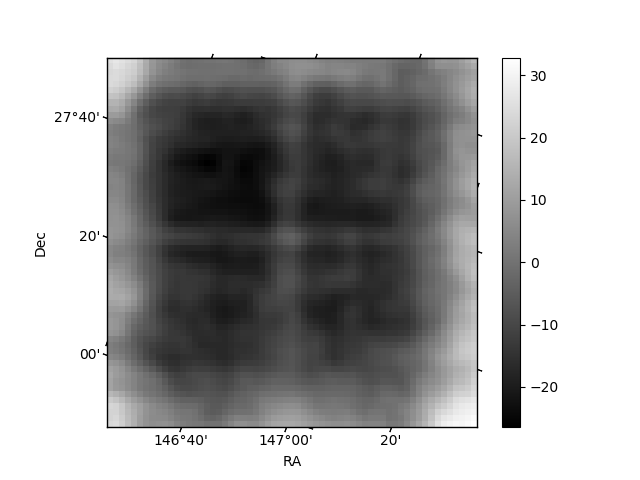
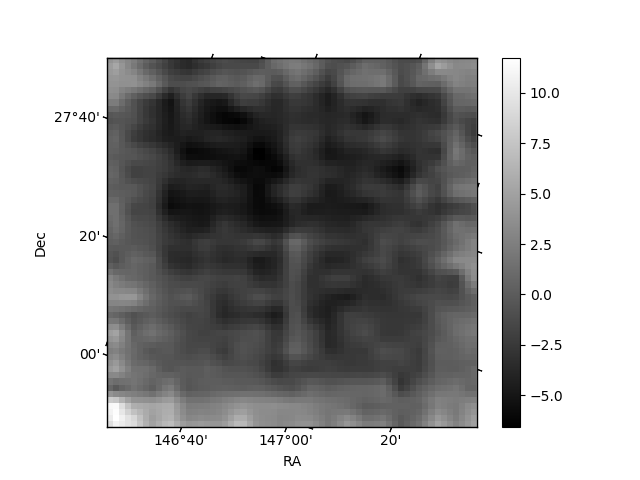
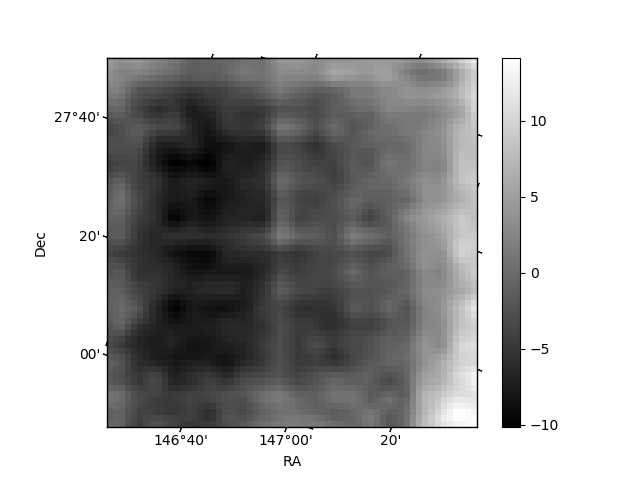
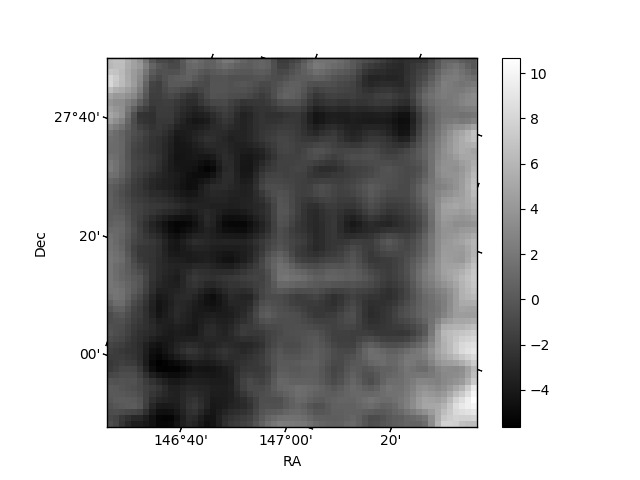
Histogram calculated using DETX and DETY for each event in the final _common_clean file
| Quadrant A | 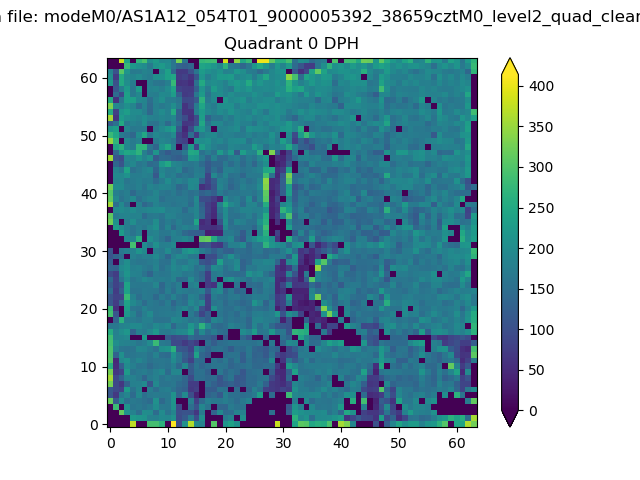 |
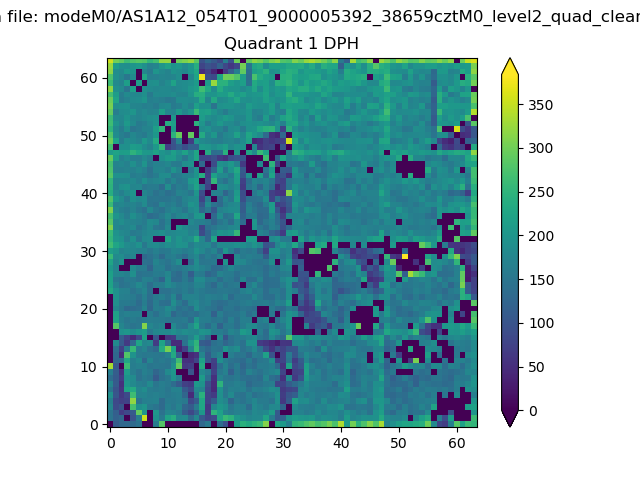 |
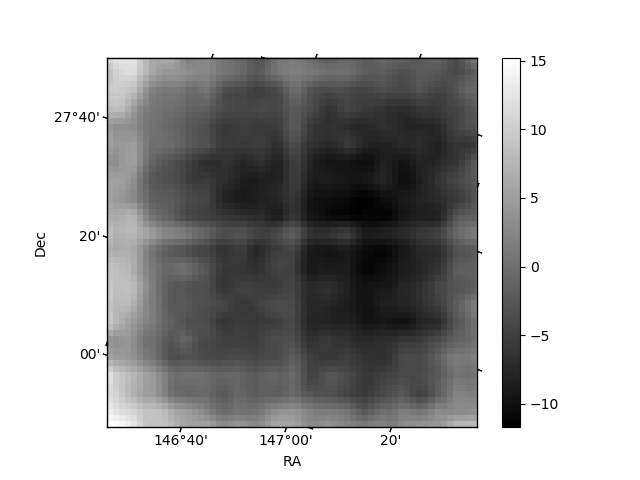
Quadrant B |
|---|---|---|---|
| Quadrant D | 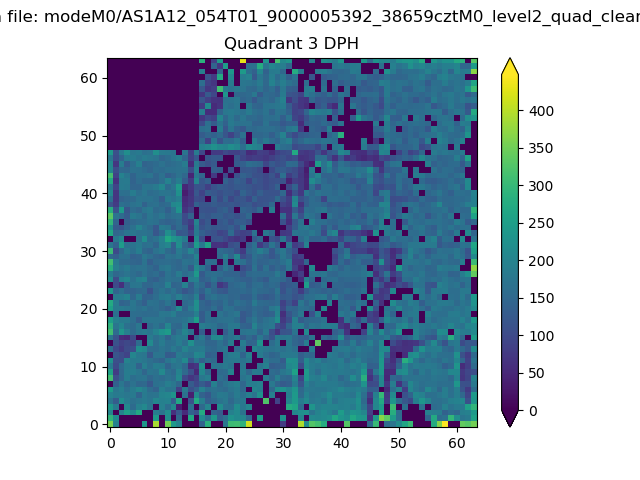 |
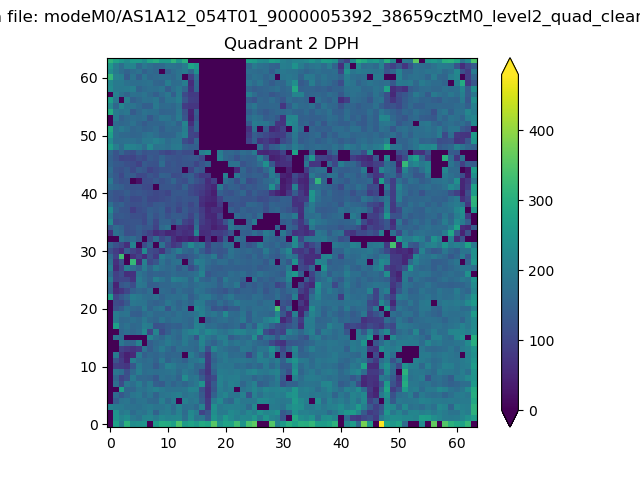 |
Quadrant C |
| Plot type | Count rate plots | Images |
|---|---|---|
| Comparison with Poisson distribution Blue bars denote a histogram of data divided into 1 sec bins. Red curve is a Poisson curve with rate = median count rate of data. |
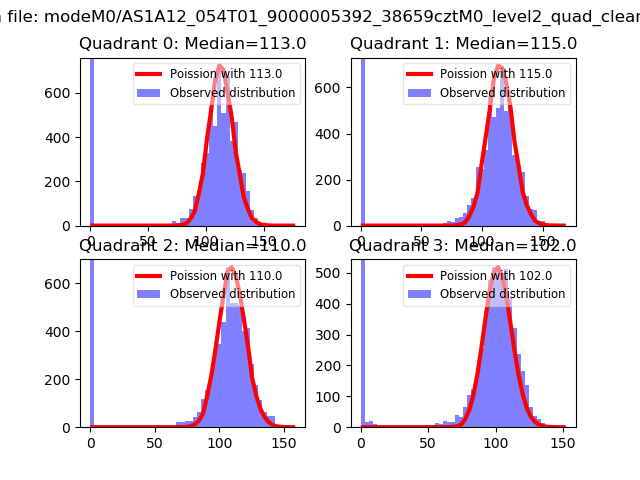 |
 |
| Quadrant-wise count rates Data is divided into 100 sec bins |
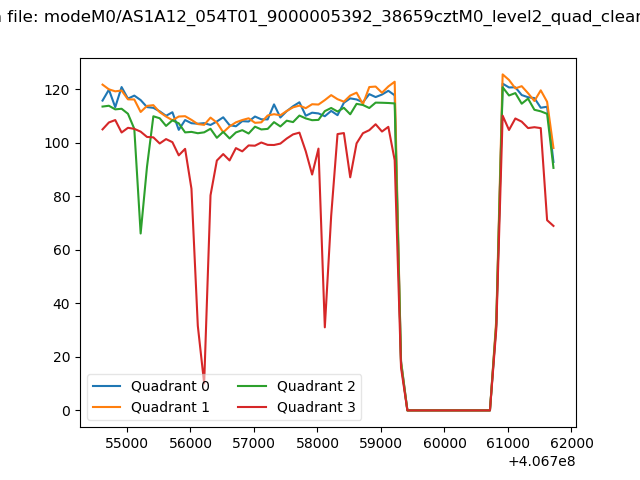 |
|
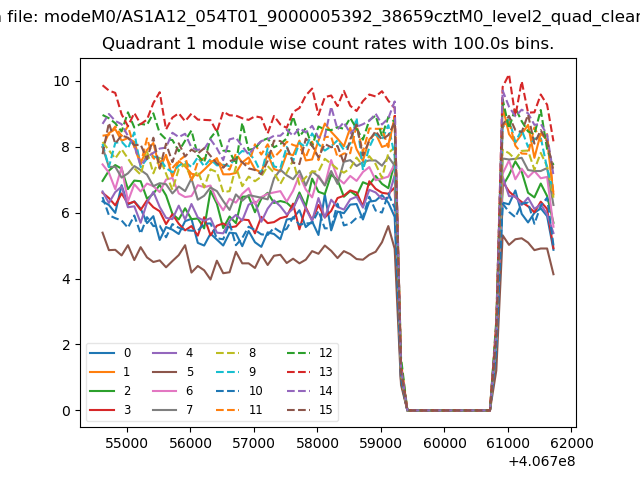
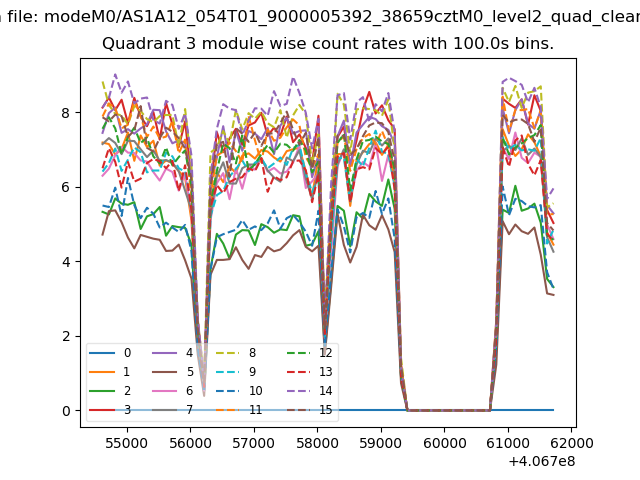
| Module-wise count rates for Quadrant A Data is divided into 100 sec bins |
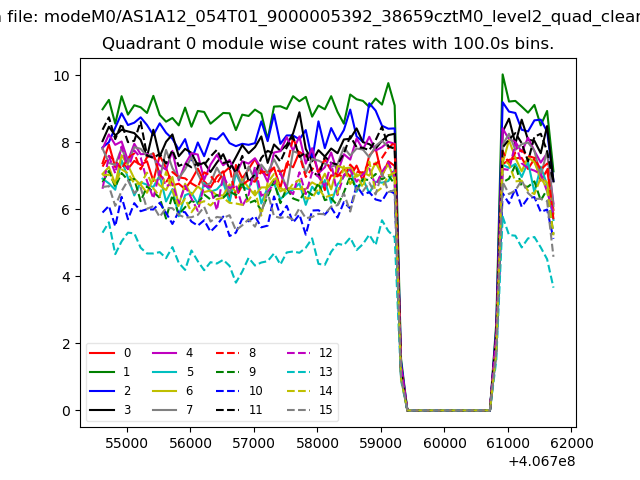 |
 |
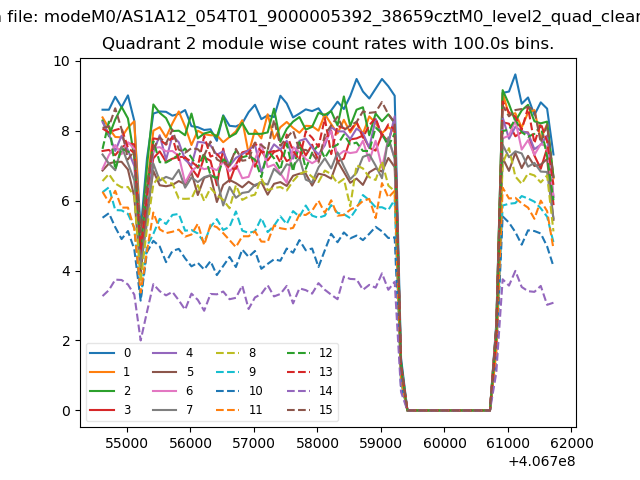
| Module-wise count rates for Quadrant B Data is divided into 100 sec bins |
 |
 |
| Module-wise count rates for Quadrant C Data is divided into 100 sec bins |
 |
 |
| Module-wise count rates for Quadrant D Data is divided into 100 sec bins |
 |
 |
| Parameter | Plot |
|---|---|
| CZT HV Monitor | 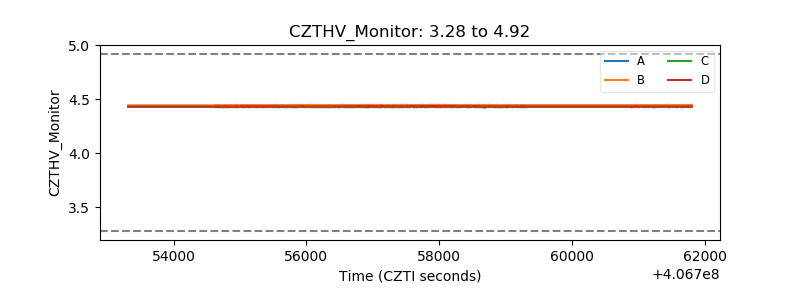 |
| D_VDD | 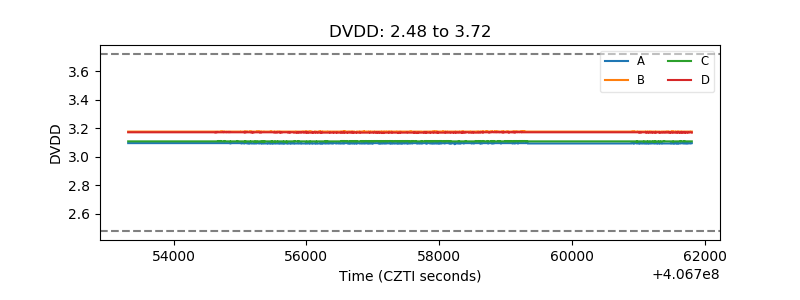 |
| Temperature 1 | 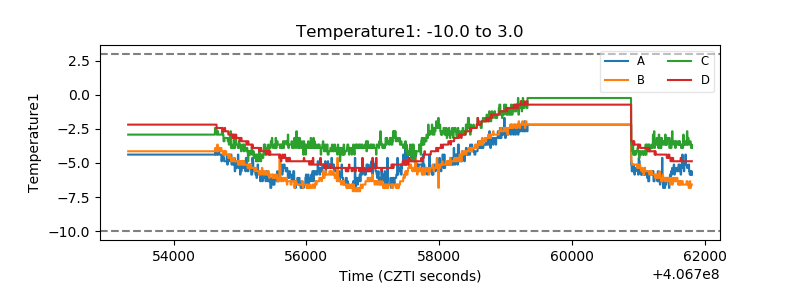 |
| Veto HV Monitor | 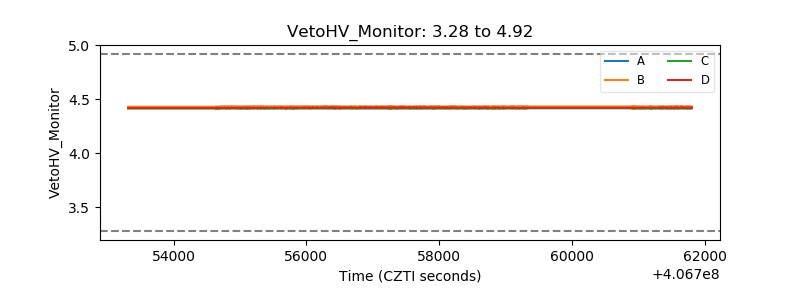 |
| Veto LLD | 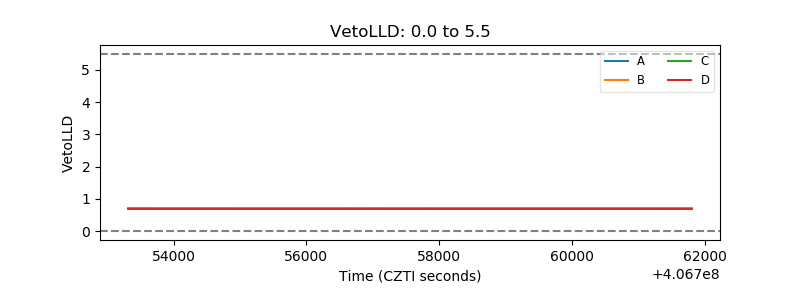 |
| Alpha Counter | 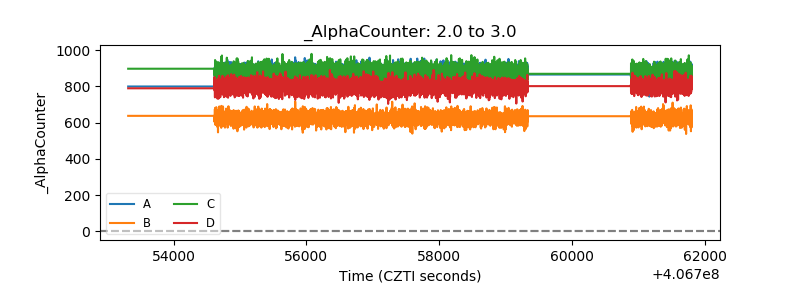 |
| _CPM_Rate | 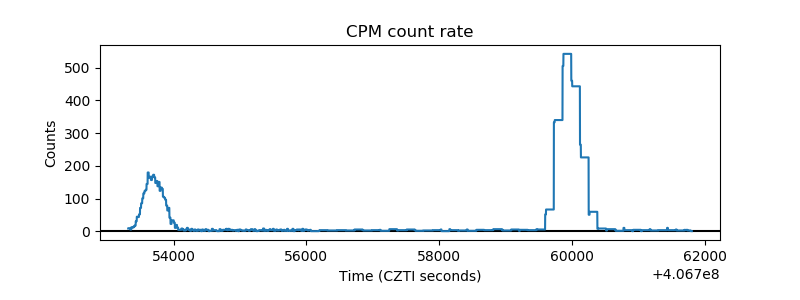 |
| CZT Counter | 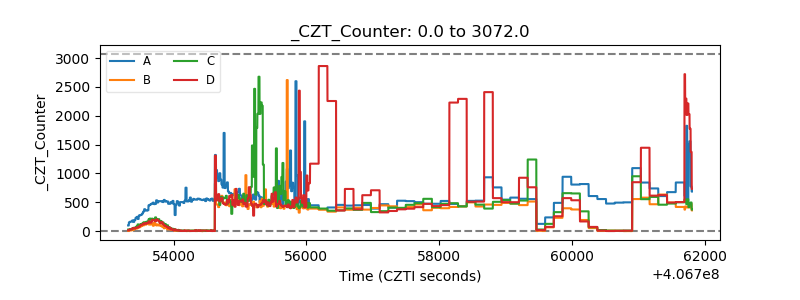 |
| +2.5 Volts monitor | 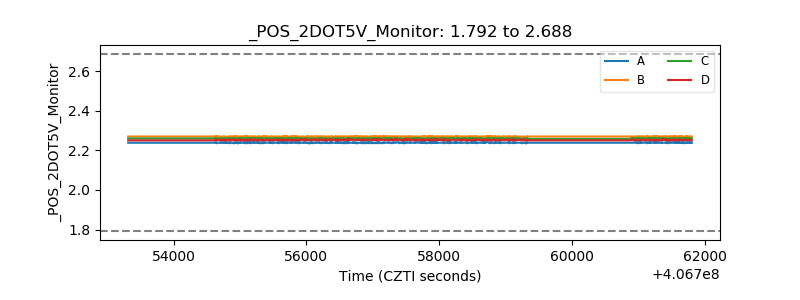 |
| +5 Volts monitor | 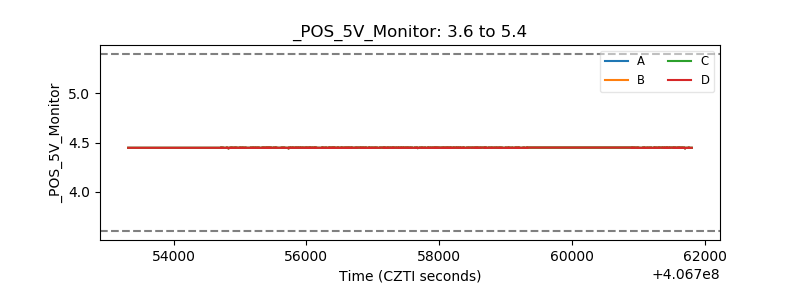 |
| _ROLL_ROT | 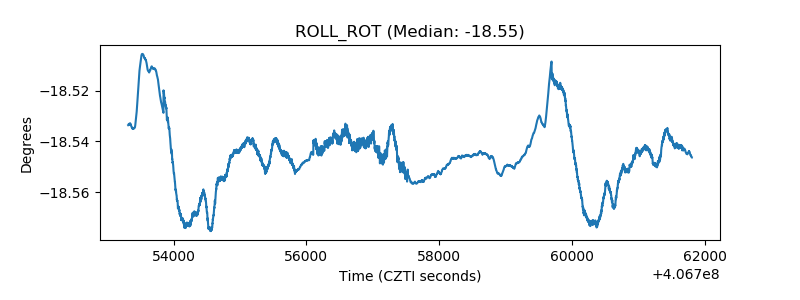 |
| _Roll_DEC | 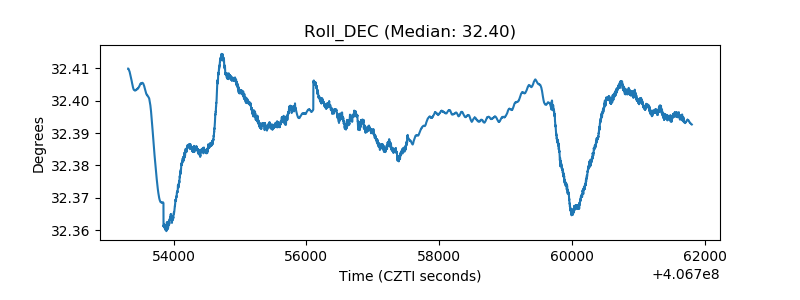 |
| _Roll_RA | 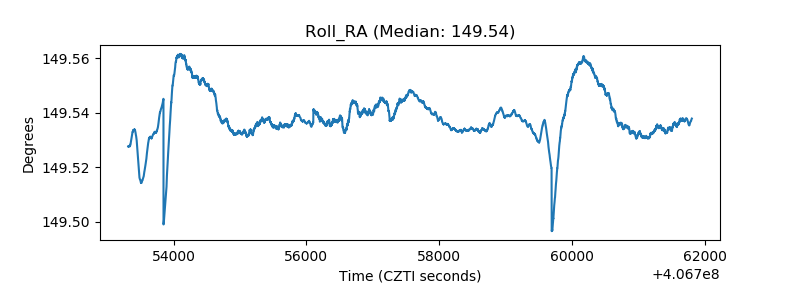 |
| Veto Counter | 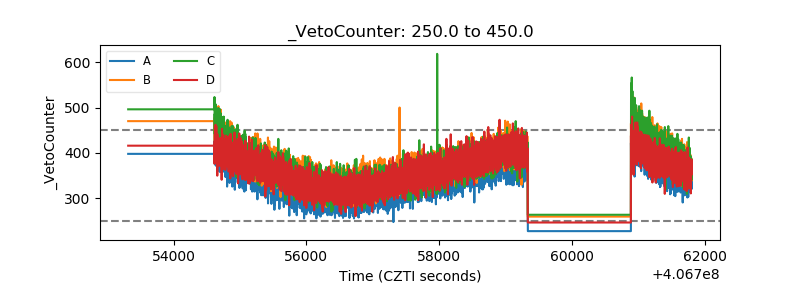 |