| Param | Original file | Final file |
|---|---|---|
| Filename | modeM0/AS1A12_054T01_9000005392_38660cztM0_level2.fits | modeM0/AS1A12_054T01_9000005392_38660cztM0_level2_quad_clean.evt |
| Size (bytes) | 395,406,720 | 89,245,440 |
| Size | 377.1 MB | 85.1 MB |
| Events in quadrant A | 5,056,928 | 564,274 |
| Events in quadrant B | 2,448,389 | 628,955 |
| Events in quadrant C | 2,611,722 | 599,087 |
| Events in quadrant D | 4,100,542 | 532,744 |
| Mode M9 | |||
|---|---|---|---|
| Quadrant | BADHDUFLAG | Total packets | Discarded packets |
| A | 0 | 28 | 0 |
| B | 0 | 28 | 0 |
| C | 0 | 28 | 0 |
| D | 0 | 29 | 0 |
| Mode SS | |||
|---|---|---|---|
| Quadrant | BADHDUFLAG | Total packets | Discarded packets |
| A | 0 | 110 | 0 |
| B | 0 | 110 | 0 |
| C | 0 | 110 | 0 |
| D | 0 | 110 | 0 |
| Mode M0 | |||
|---|---|---|---|
| Quadrant | BADHDUFLAG | Total packets | Discarded packets |
| A | 0 | 18584 | 3 |
| B | 0 | 10972 | 2 |
| C | 0 | 11168 | 2 |
| D | 0 | 15974 | 2 |
| Quadrant | Total seconds | Saturated seconds | Saturation percentage |
|---|---|---|---|
| A | 5387 | 562 | 10.432523% |
| B | 5387 | 10 | 0.185632% |
| C | 5387 | 9 | 0.167069% |
| D | 5387 | 319 | 5.921663% |
Noise dominated data is calculated using 1-second bins in cleaned event files. If a bin has >2000 counts, and if more than 50% of those come from <1% of pixels, then it is considered to be noise-dominated and hence unusable.
| Quadrant | # 1 sec bins | Bins with >0 counts | Bins with >2000 counts | High rate bins dominated by noise | Noise dominated (total time) | Noise dominated (detector-on time) | Marked lightcurve |
|---|---|---|---|---|---|---|---|
| A | 7060 | 5388 | 582 | 582 | 8.24% | 10.80% | 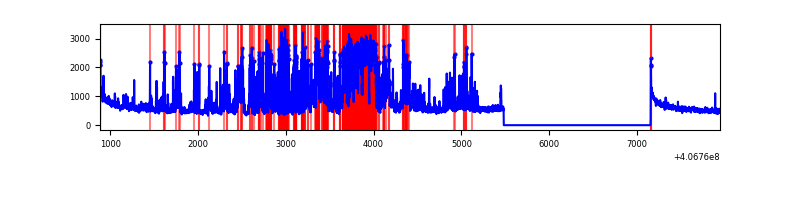 |
| B | 7060 | 5388 | 2 | 2 | 0.03% | 0.04% | 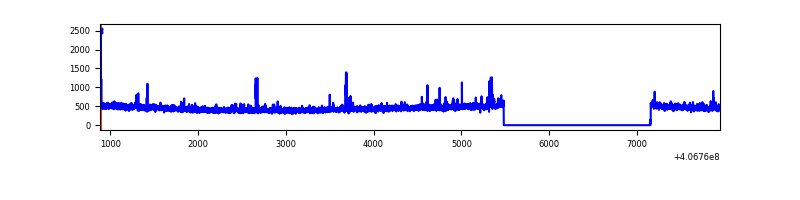 |
| C | 7060 | 5388 | 4 | 4 | 0.06% | 0.07% |  |
| D | 7060 | 5388 | 311 | 311 | 4.41% | 5.77% | 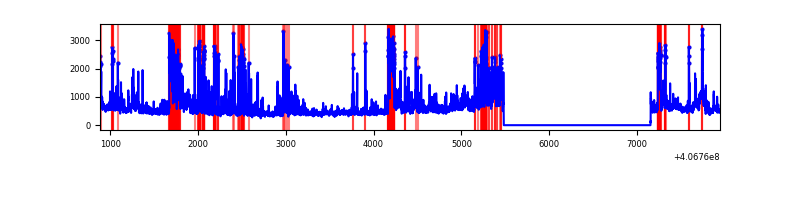 |
Top three noisy pixels from each quadrant. If the there are fewer than three noisy pixels in the level2.evt file, extra rows are filled as -1
| Pixel properties | Quadrant properties | ||||||
|---|---|---|---|---|---|---|---|
| Quadrant | DetID | PixID | Counts | Sigma | Mean | Median | Sigma |
| A | 13 | 248 | 2342088 | 19742.49 | 579 | 569 | 118.6 |
| A | 10 | 83 | 393425 | 3312.36 | 579 | 569 | 118.6 |
| A | 9 | 143 | 52267 | 435.89 | 579 | 569 | 118.6 |
| B | 0 | 230 | 22174 | 185.42 | 602 | 586 | 116.4 |
| B | 5 | 184 | 19640 | 163.66 | 602 | 586 | 116.4 |
| B | 12 | 111 | 14652 | 120.82 | 602 | 586 | 116.4 |
| C | 15 | 214 | 216215 | 1557.58 | 589 | 591 | 138.4 |
| C | 14 | 254 | 60980 | 436.23 | 589 | 591 | 138.4 |
| C | 0 | 10 | 22425 | 157.72 | 589 | 591 | 138.4 |
| D | 12 | 6 | 838288 | 5955.95 | 573 | 560 | 140.7 |
| D | 5 | 222 | 308525 | 2189.52 | 573 | 560 | 140.7 |
| D | 12 | 233 | 200651 | 1422.58 | 573 | 560 | 140.7 |
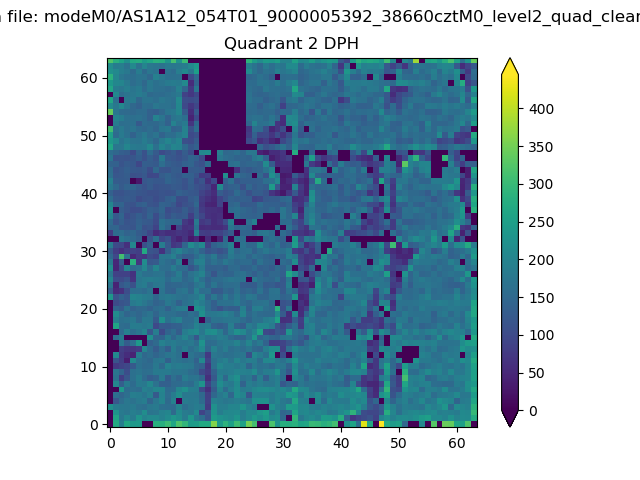
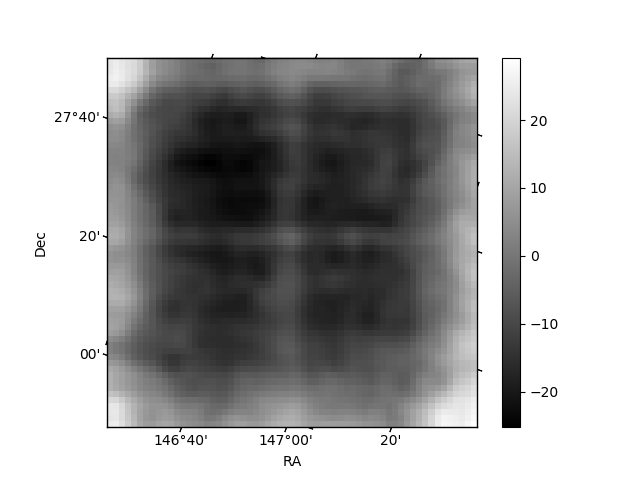
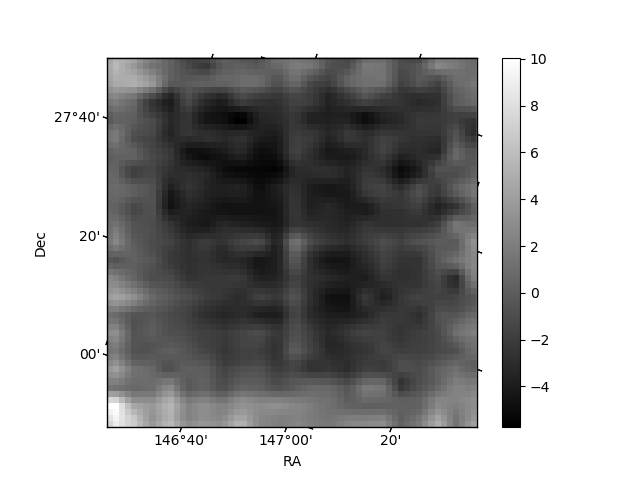
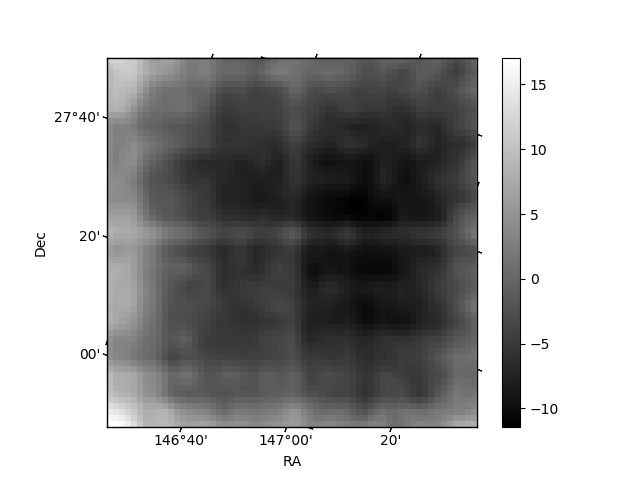
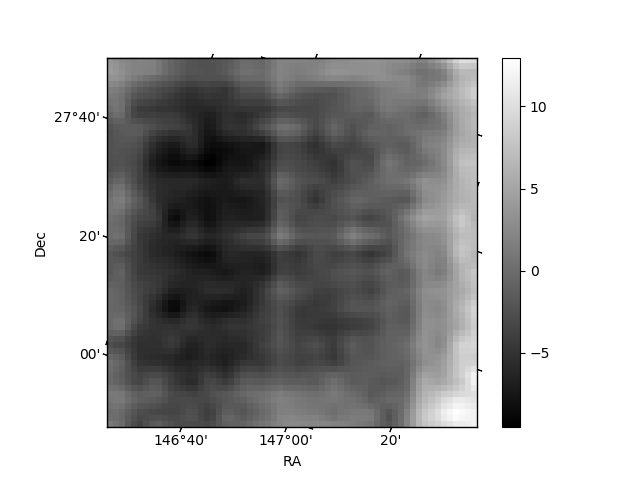
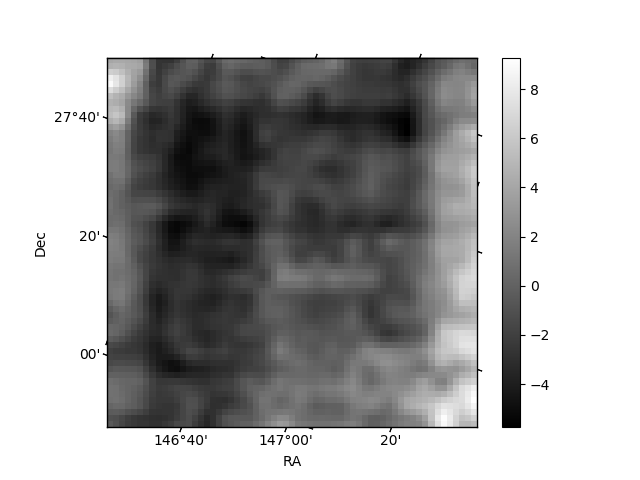
Histogram calculated using DETX and DETY for each event in the final _common_clean file
| Quadrant A | 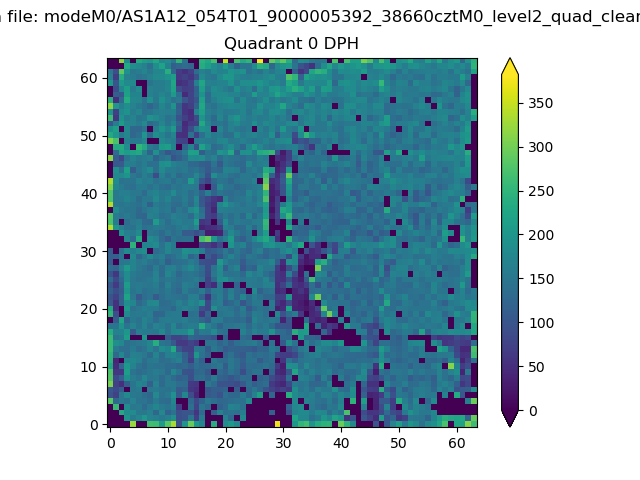 |
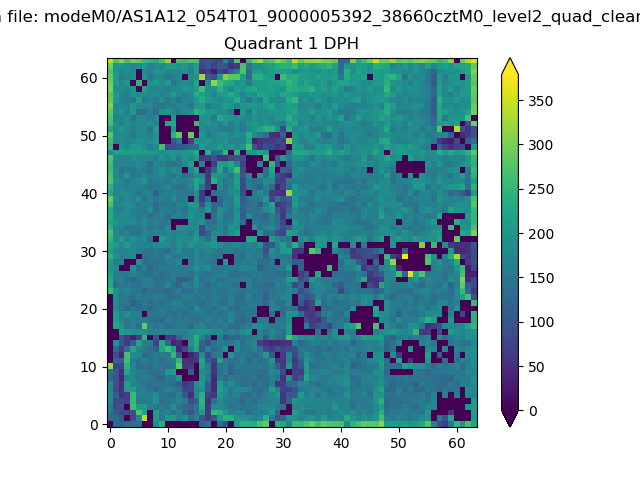 |
Quadrant B |
|---|---|---|---|
| Quadrant D | 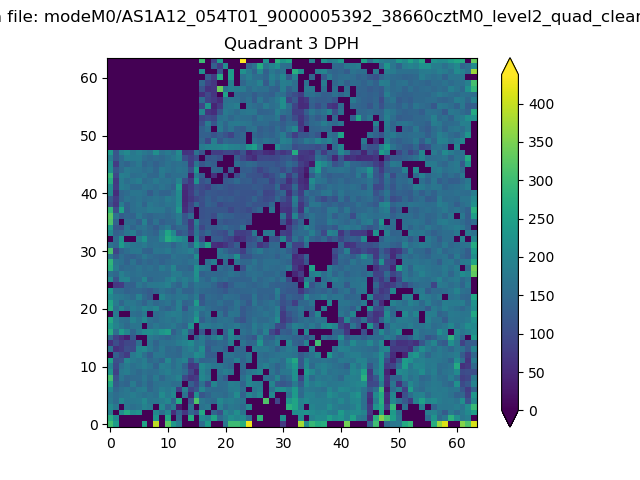 |
 |
Quadrant C |
| Plot type | Count rate plots | Images |
|---|---|---|
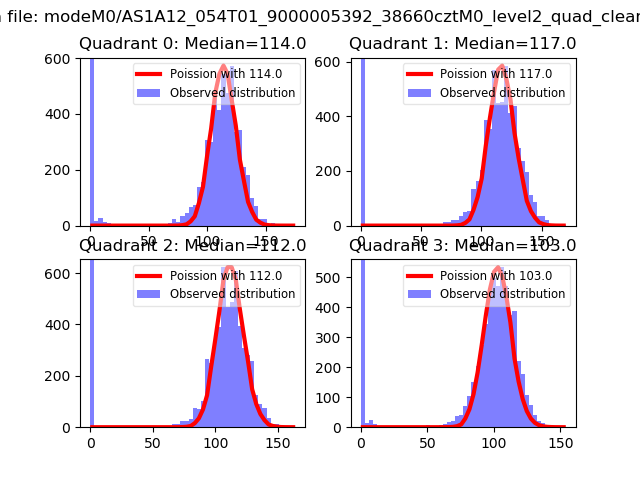
| Comparison with Poisson distribution Blue bars denote a histogram of data divided into 1 sec bins. Red curve is a Poisson curve with rate = median count rate of data. |
 |
 |
| Quadrant-wise count rates Data is divided into 100 sec bins |
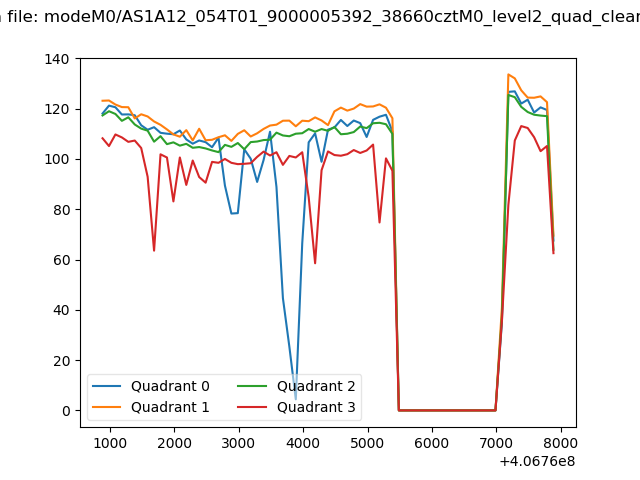 |
|
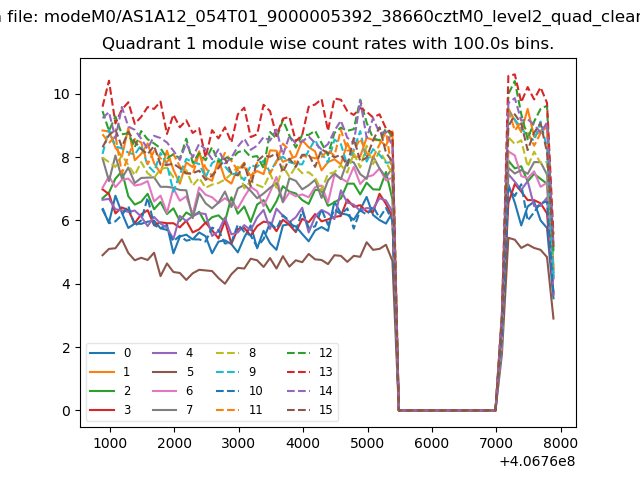
| Module-wise count rates for Quadrant A Data is divided into 100 sec bins |
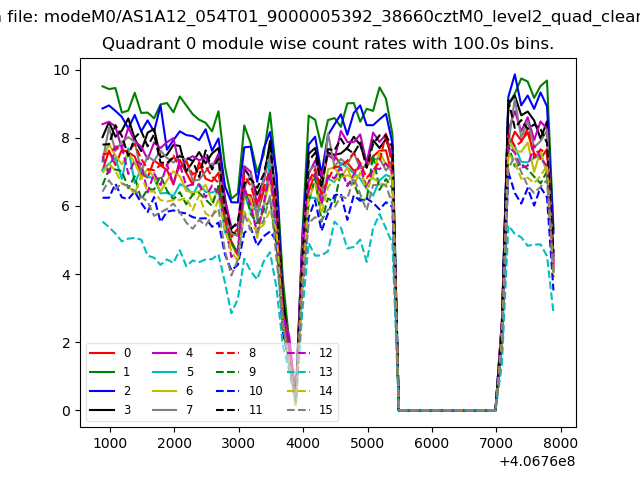 |
 |
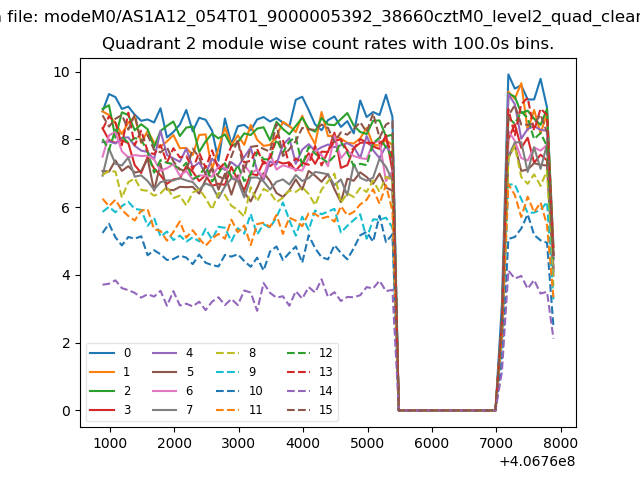
| Module-wise count rates for Quadrant B Data is divided into 100 sec bins |
 |
 |
| Module-wise count rates for Quadrant C Data is divided into 100 sec bins |
 |
 |
| Module-wise count rates for Quadrant D Data is divided into 100 sec bins |
 |
 |
| Parameter | Plot |
|---|---|
| CZT HV Monitor | 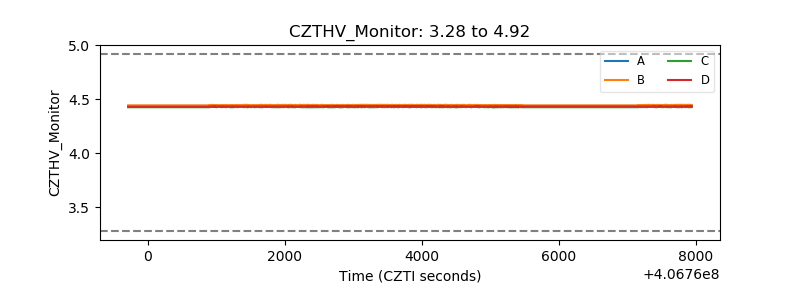 |
| D_VDD | 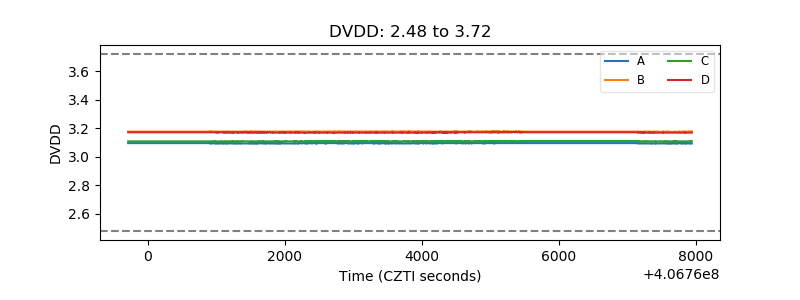 |
| Temperature 1 | 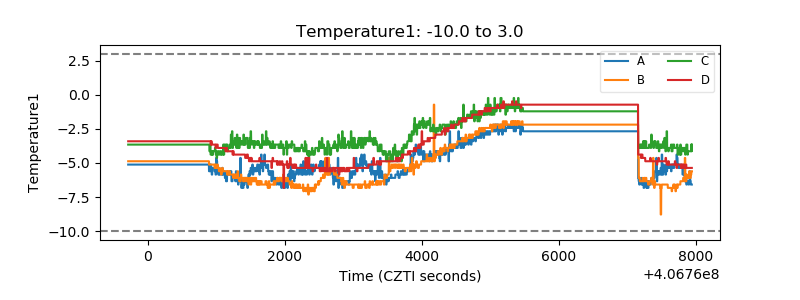 |
| Veto HV Monitor | 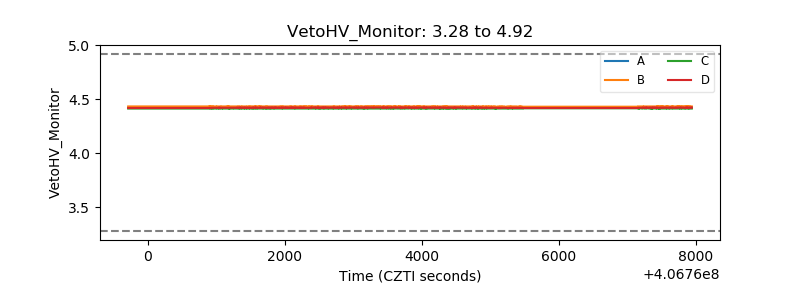 |
| Veto LLD | 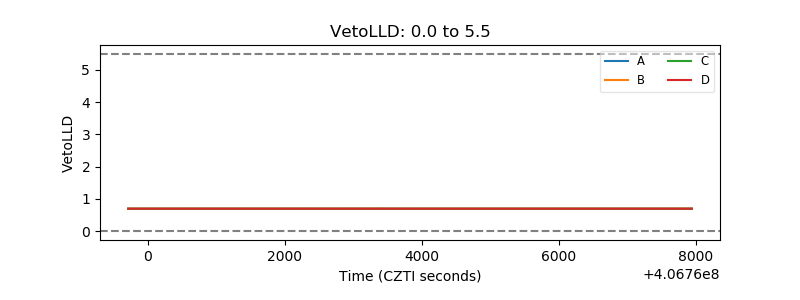 |
| Alpha Counter | 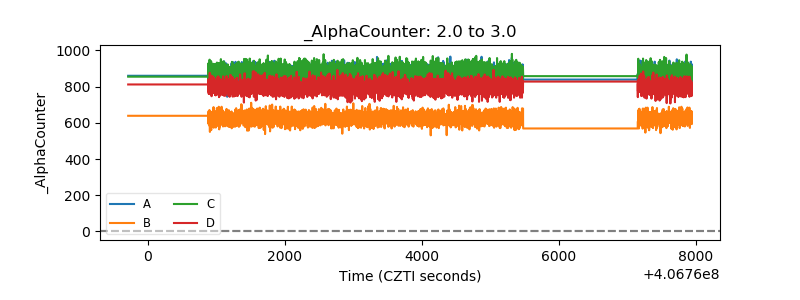 |
| _CPM_Rate | 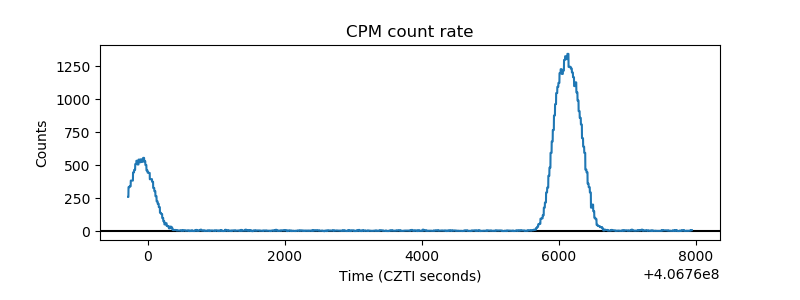 |
| CZT Counter | 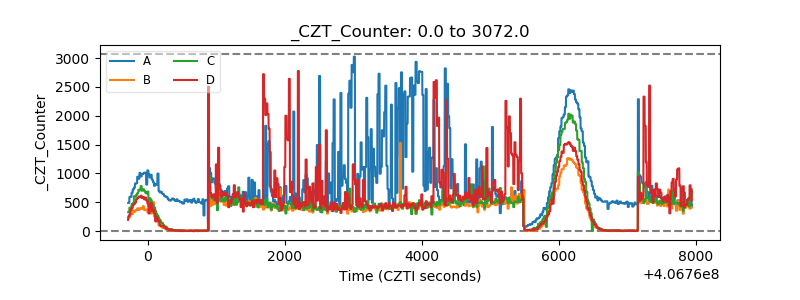 |
| +2.5 Volts monitor |  |
| +5 Volts monitor | 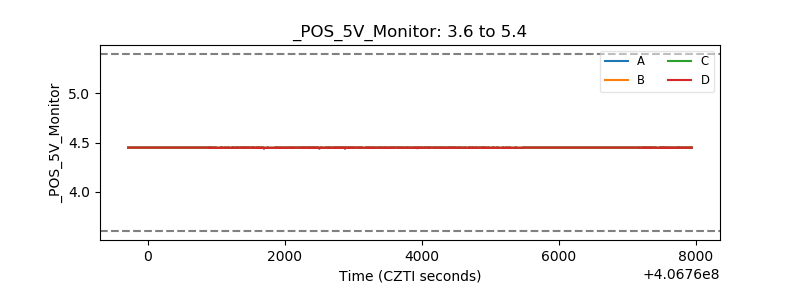 |
| _ROLL_ROT | 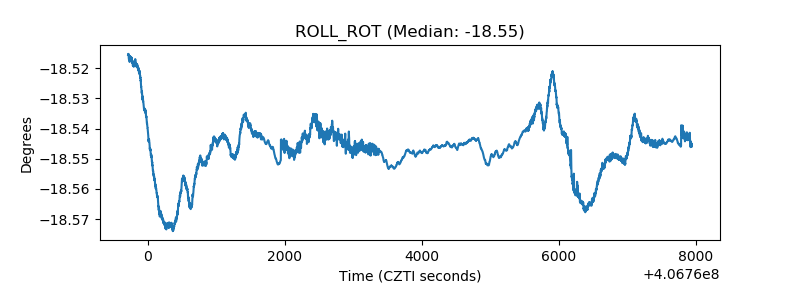 |
| _Roll_DEC | 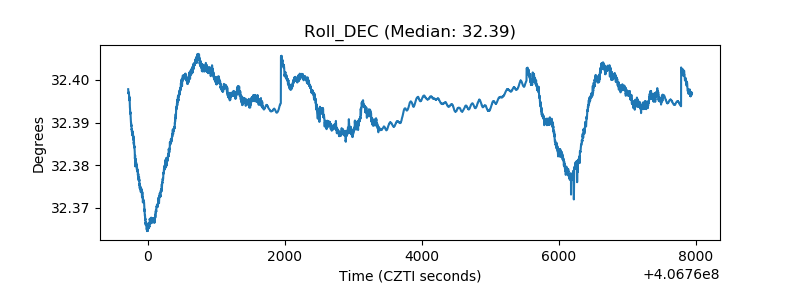 |
| _Roll_RA | 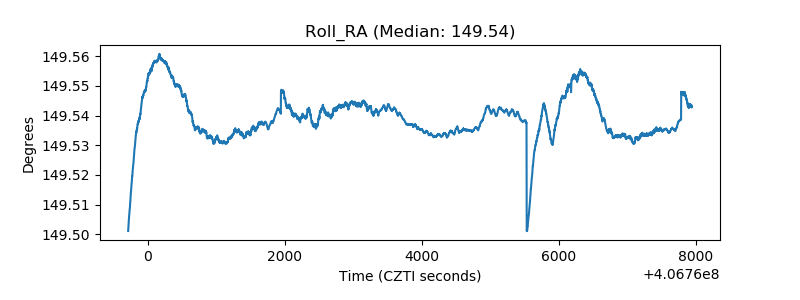 |
| Veto Counter | 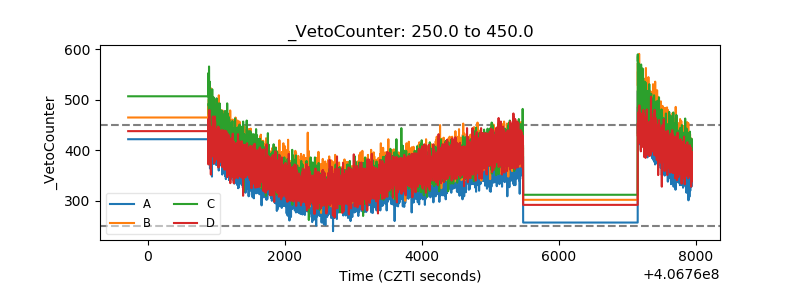 |