| Param | Original file | Final file |
|---|---|---|
| Filename | modeM0/AS1A12_054T01_9000005392_38662cztM0_level2.fits | modeM0/AS1A12_054T01_9000005392_38662cztM0_level2_quad_clean.evt |
| Size (bytes) | 338,163,840 | 97,637,760 |
| Size | 322.5 MB | 93.1 MB |
| Events in quadrant A | 2,911,581 | 664,657 |
| Events in quadrant B | 2,694,247 | 676,391 |
| Events in quadrant C | 2,921,759 | 637,900 |
| Events in quadrant D | 3,552,586 | 585,423 |
| Mode M9 | |||
|---|---|---|---|
| Quadrant | BADHDUFLAG | Total packets | Discarded packets |
| A | 0 | 36 | 0 |
| B | 0 | 36 | 0 |
| C | 0 | 36 | 0 |
| D | 0 | 36 | 0 |
| Mode SS | |||
|---|---|---|---|
| Quadrant | BADHDUFLAG | Total packets | Discarded packets |
| A | 0 | 114 | 0 |
| B | 0 | 114 | 0 |
| C | 0 | 114 | 0 |
| D | 0 | 114 | 0 |
| Mode M0 | |||
|---|---|---|---|
| Quadrant | BADHDUFLAG | Total packets | Discarded packets |
| A | 0 | 12129 | 3 |
| B | 0 | 11768 | 2 |
| C | 0 | 12219 | 2 |
| D | 0 | 14367 | 2 |
| Quadrant | Total seconds | Saturated seconds | Saturation percentage |
|---|---|---|---|
| A | 5617 | 18 | 0.320456% |
| B | 5617 | 60 | 1.068186% |
| C | 5617 | 57 | 1.014777% |
| D | 5617 | 128 | 2.278797% |
Noise dominated data is calculated using 1-second bins in cleaned event files. If a bin has >2000 counts, and if more than 50% of those come from <1% of pixels, then it is considered to be noise-dominated and hence unusable.
| Quadrant | # 1 sec bins | Bins with >0 counts | Bins with >2000 counts | High rate bins dominated by noise | Noise dominated (total time) | Noise dominated (detector-on time) | Marked lightcurve |
|---|---|---|---|---|---|---|---|
| A | 9113 | 5619 | 8 | 8 | 0.09% | 0.14% | 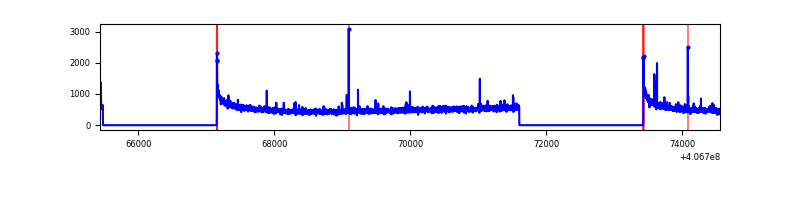 |
| B | 9113 | 5619 | 45 | 45 | 0.49% | 0.80% | 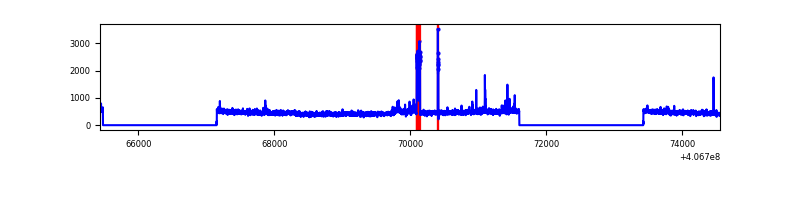 |
| C | 9113 | 5619 | 59 | 59 | 0.65% | 1.05% | 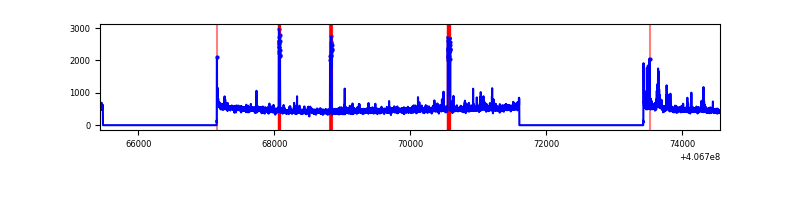 |
| D | 9113 | 5619 | 130 | 130 | 1.43% | 2.31% | 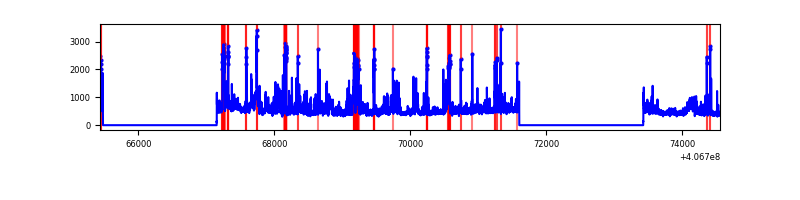 |
Top three noisy pixels from each quadrant. If the there are fewer than three noisy pixels in the level2.evt file, extra rows are filled as -1
| Pixel properties | Quadrant properties | ||||||
|---|---|---|---|---|---|---|---|
| Quadrant | DetID | PixID | Counts | Sigma | Mean | Median | Sigma |
| A | 10 | 83 | 406578 | 3181.32 | 632 | 622 | 127.6 |
| A | 9 | 143 | 27758 | 212.65 | 632 | 622 | 127.6 |
| A | 13 | 248 | 17751 | 134.23 | 632 | 622 | 127.6 |
| B | 5 | 200 | 144693 | 1197.35 | 628 | 612 | 120.3 |
| B | 5 | 184 | 25758 | 208.97 | 628 | 612 | 120.3 |
| B | 0 | 230 | 24830 | 201.26 | 628 | 612 | 120.3 |
| C | 15 | 214 | 226917 | 1586.47 | 614 | 618 | 142.6 |
| C | 3 | 9 | 128026 | 893.19 | 614 | 618 | 142.6 |
| C | 14 | 254 | 67007 | 465.42 | 614 | 618 | 142.6 |
| D | 2 | 249 | 248315 | 1692.74 | 604 | 588 | 146.3 |
| D | 5 | 157 | 229896 | 1566.88 | 604 | 588 | 146.3 |
| D | 12 | 6 | 183387 | 1249.08 | 604 | 588 | 146.3 |
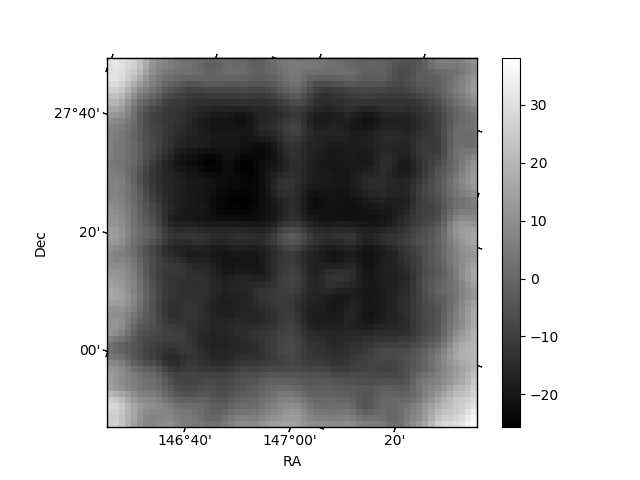
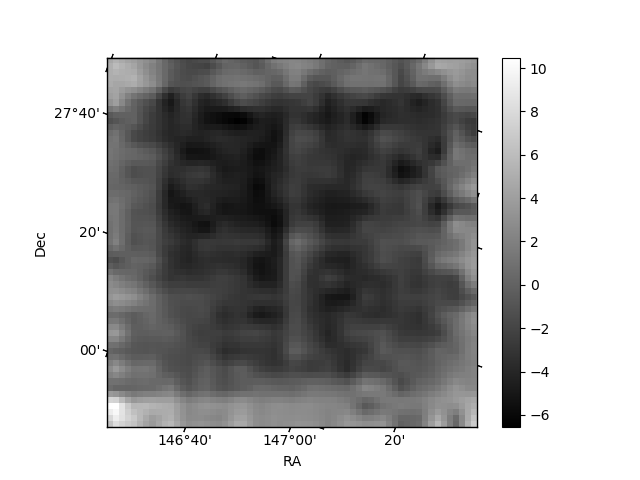
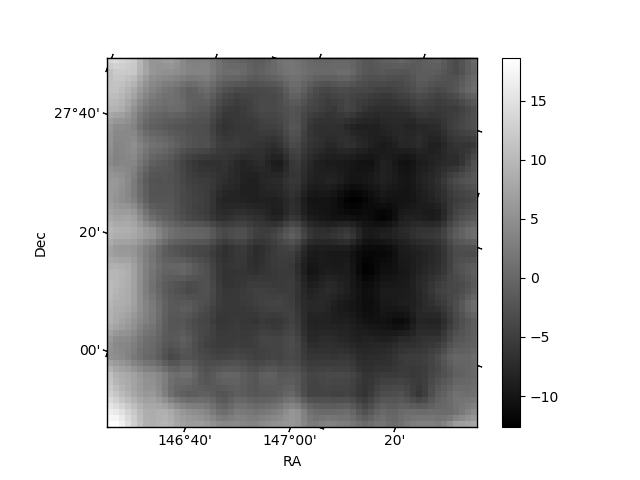
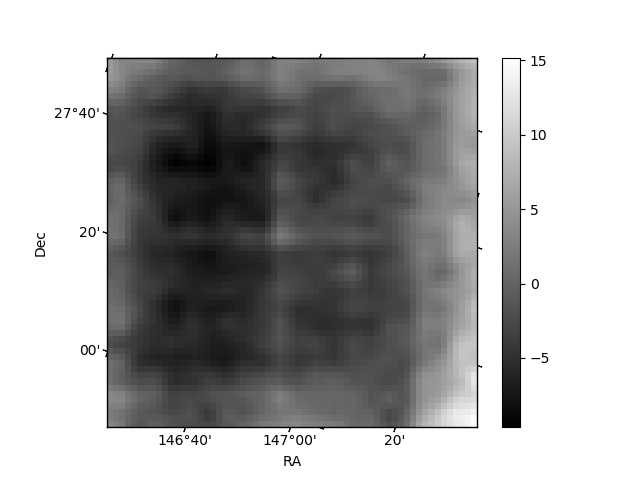
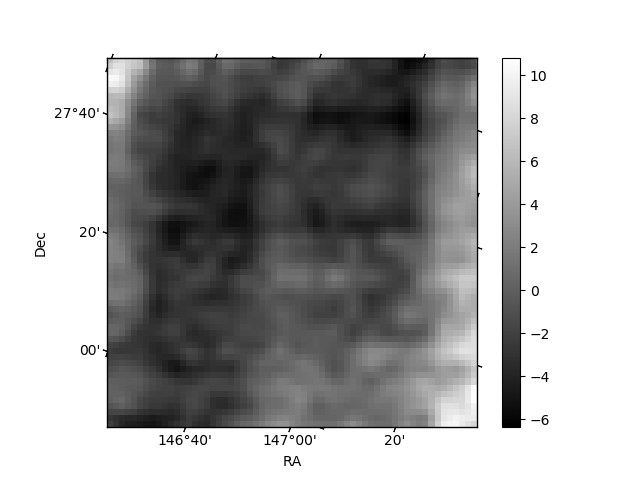
Histogram calculated using DETX and DETY for each event in the final _common_clean file
| Quadrant A | 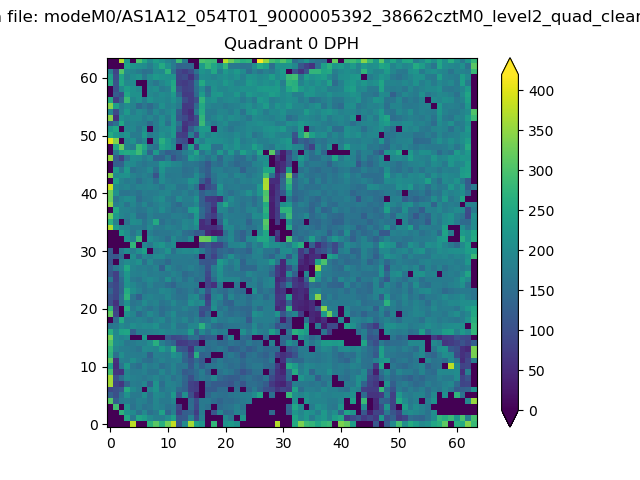 |
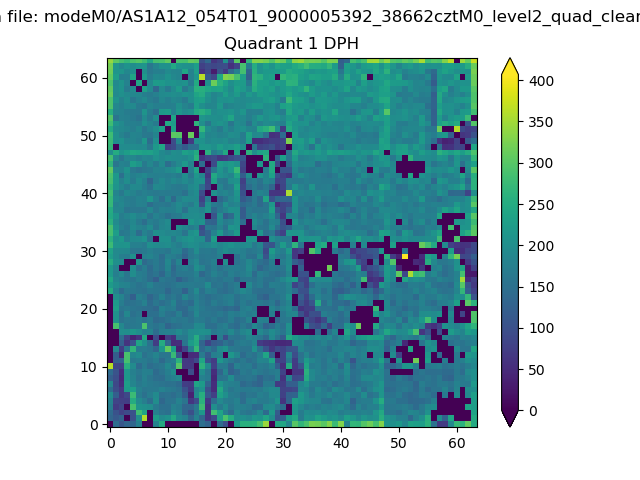 |
Quadrant B |
|---|---|---|---|
| Quadrant D | 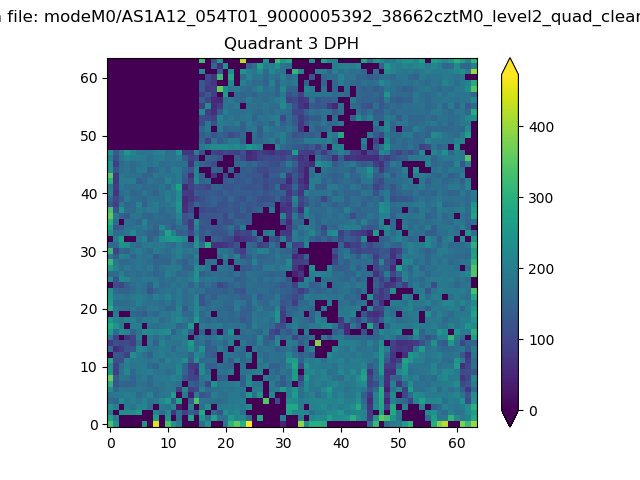 |
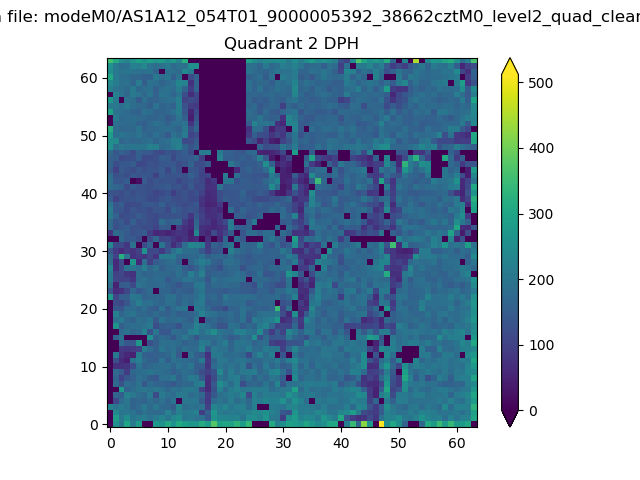 |
Quadrant C |
| Plot type | Count rate plots | Images |
|---|---|---|
| Comparison with Poisson distribution Blue bars denote a histogram of data divided into 1 sec bins. Red curve is a Poisson curve with rate = median count rate of data. |
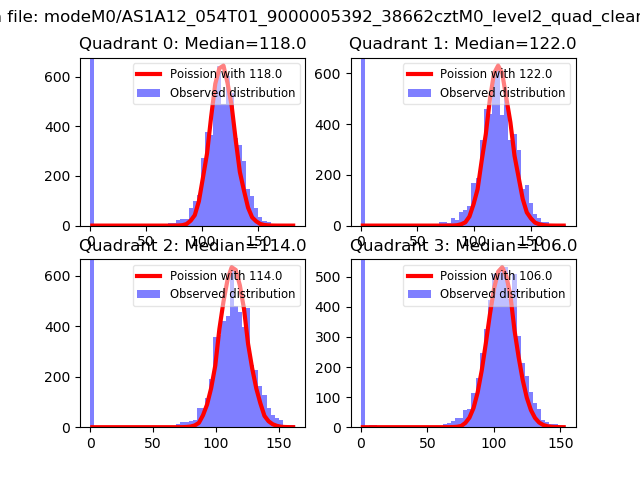 |
 |
| Quadrant-wise count rates Data is divided into 100 sec bins |
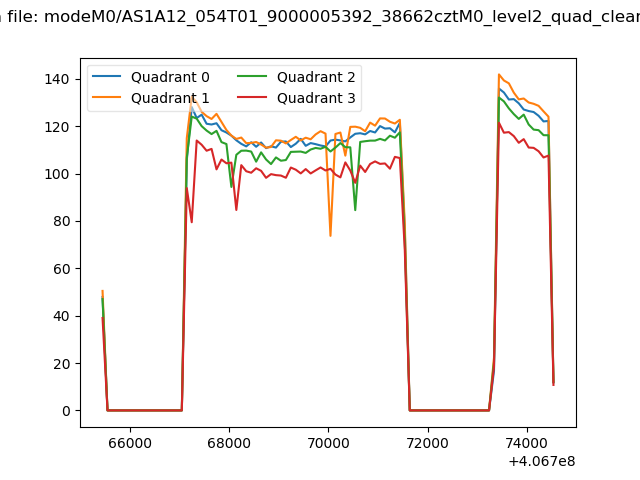 |
|
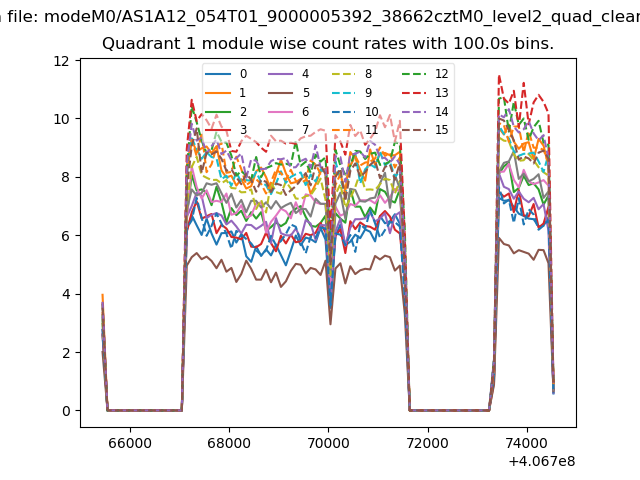
| Module-wise count rates for Quadrant A Data is divided into 100 sec bins |
 |
 |
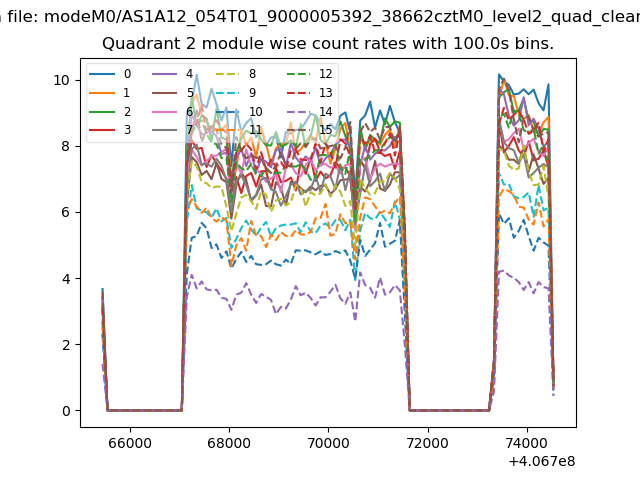
| Module-wise count rates for Quadrant B Data is divided into 100 sec bins |
 |
 |
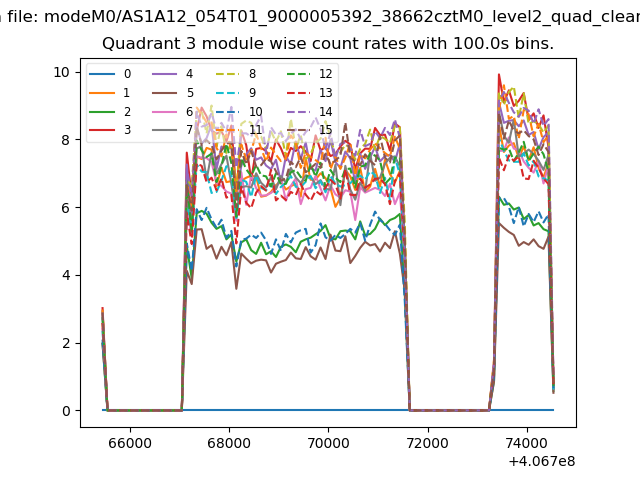
| Module-wise count rates for Quadrant C Data is divided into 100 sec bins |
 |
 |
| Module-wise count rates for Quadrant D Data is divided into 100 sec bins |
 |
 |
| Parameter | Plot |
|---|---|
| CZT HV Monitor | 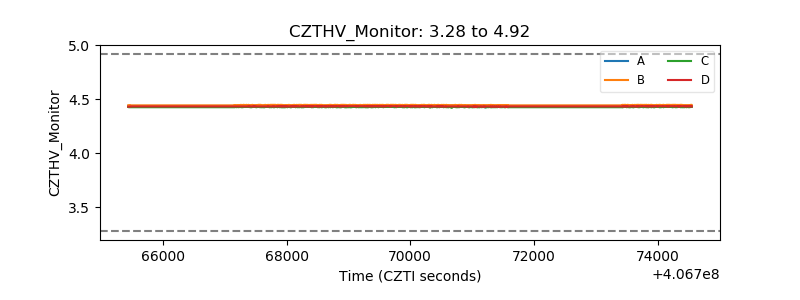 |
| D_VDD | 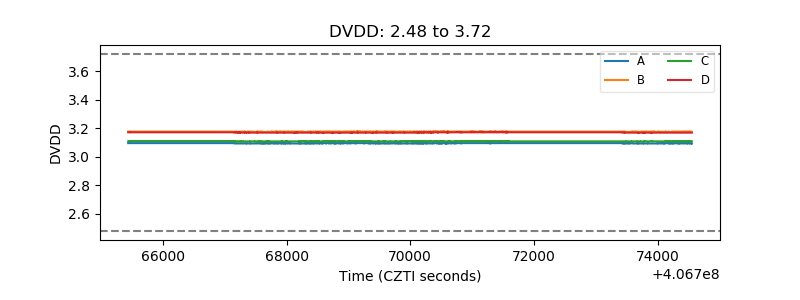 |
| Temperature 1 | 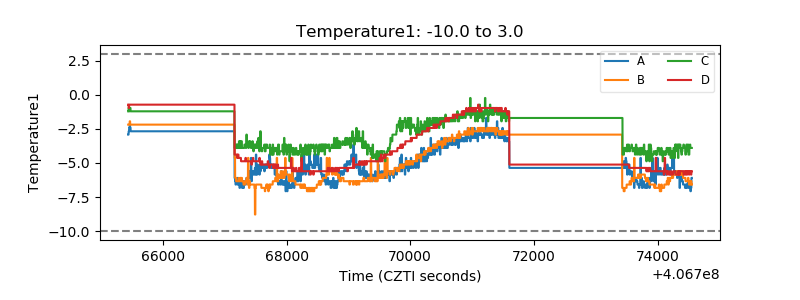 |
| Veto HV Monitor | 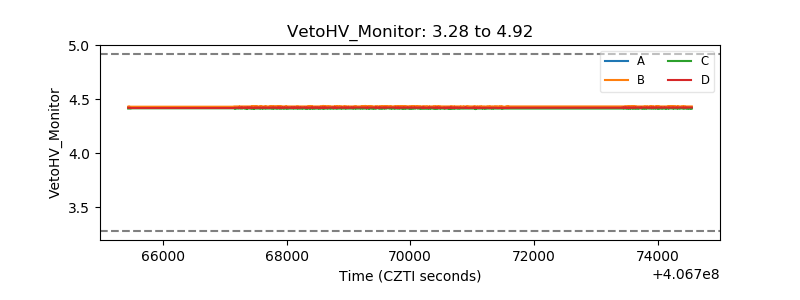 |
| Veto LLD | 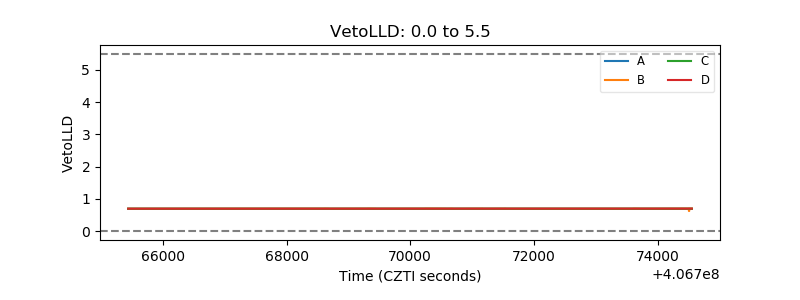 |
| Alpha Counter | 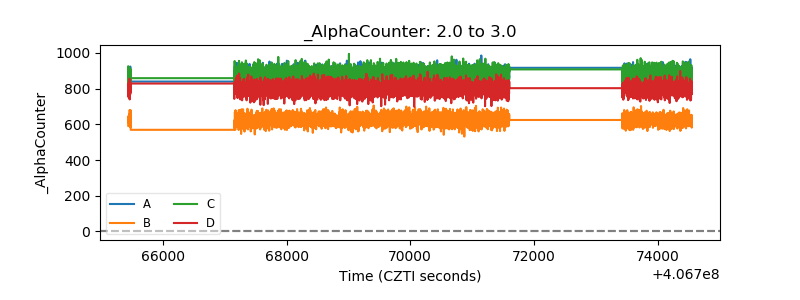 |
| _CPM_Rate | 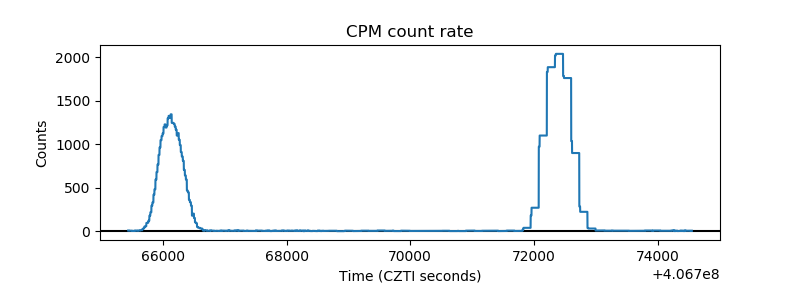 |
| CZT Counter | 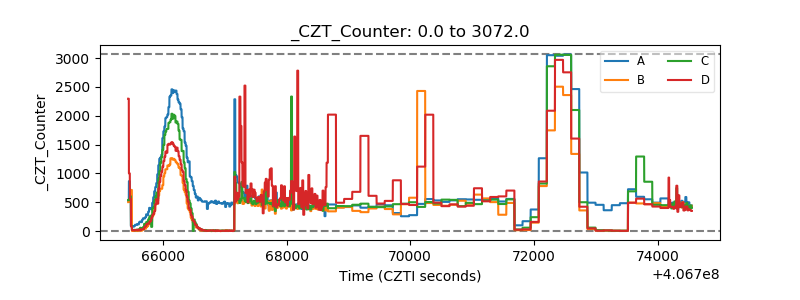 |
| +2.5 Volts monitor | 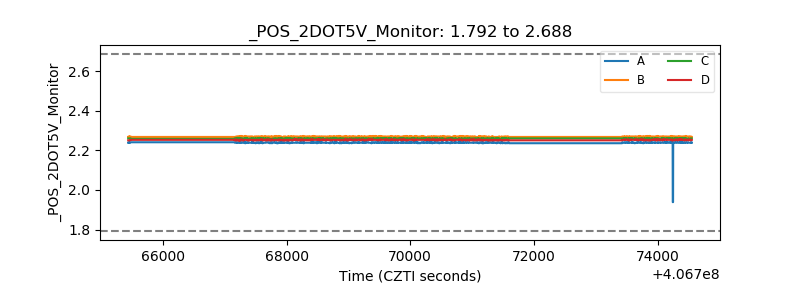 |
| +5 Volts monitor | 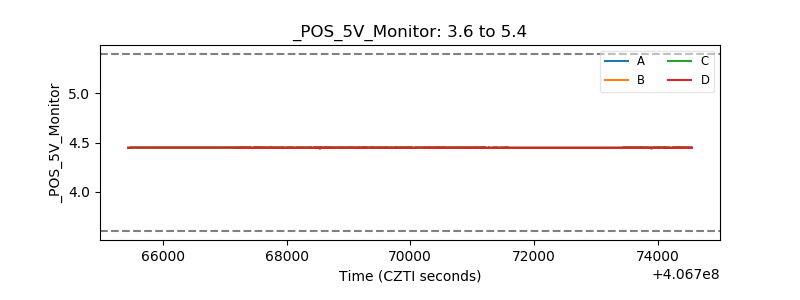 |
| _ROLL_ROT | 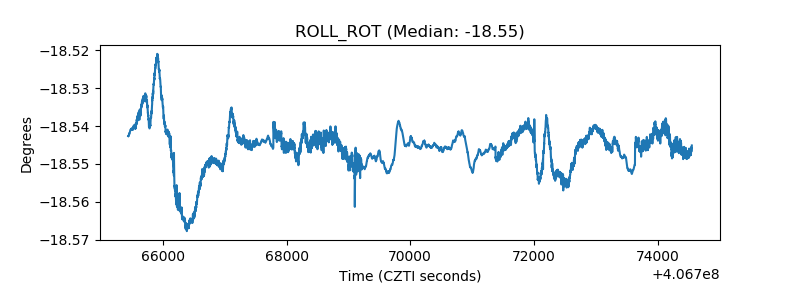 |
| _Roll_DEC | 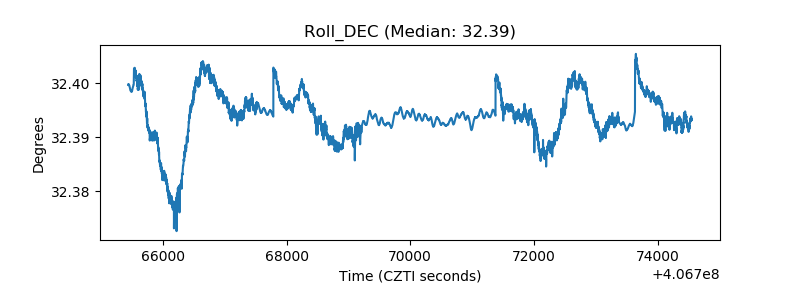 |
| _Roll_RA | 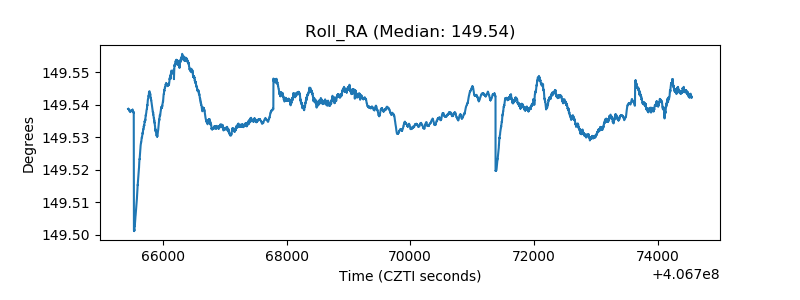 |
| Veto Counter | 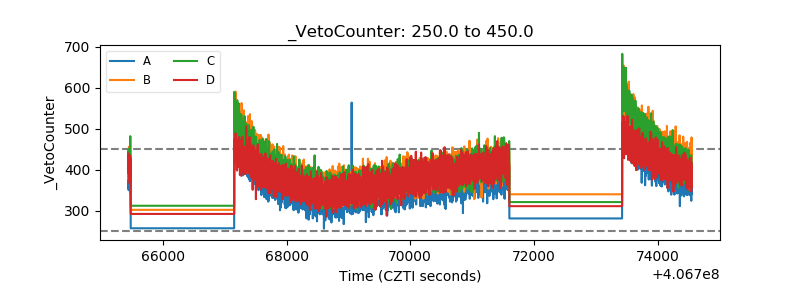 |