| Param | Original file | Final file |
|---|---|---|
| Filename | modeM0/AS1A12_054T01_9000005392_38663cztM0_level2.fits | modeM0/AS1A12_054T01_9000005392_38663cztM0_level2_quad_clean.evt |
| Size (bytes) | 335,816,640 | 97,819,200 |
| Size | 320.3 MB | 93.3 MB |
| Events in quadrant A | 2,877,429 | 672,068 |
| Events in quadrant B | 2,655,734 | 689,545 |
| Events in quadrant C | 2,753,138 | 650,751 |
| Events in quadrant D | 3,718,614 | 567,262 |
| Mode M9 | |||
|---|---|---|---|
| Quadrant | BADHDUFLAG | Total packets | Discarded packets |
| A | 0 | 27 | 0 |
| B | 0 | 27 | 0 |
| C | 0 | 27 | 0 |
| D | 0 | 28 | 0 |
| Mode SS | |||
|---|---|---|---|
| Quadrant | BADHDUFLAG | Total packets | Discarded packets |
| A | 0 | 112 | 0 |
| B | 0 | 112 | 0 |
| C | 0 | 112 | 0 |
| D | 0 | 112 | 0 |
| Mode M0 | |||
|---|---|---|---|
| Quadrant | BADHDUFLAG | Total packets | Discarded packets |
| A | 0 | 11812 | 3 |
| B | 0 | 11401 | 2 |
| C | 0 | 11500 | 2 |
| D | 0 | 14798 | 2 |
| Quadrant | Total seconds | Saturated seconds | Saturation percentage |
|---|---|---|---|
| A | 5465 | 18 | 0.329369% |
| B | 5465 | 56 | 1.024703% |
| C | 5465 | 13 | 0.237877% |
| D | 5465 | 334 | 6.111619% |
Noise dominated data is calculated using 1-second bins in cleaned event files. If a bin has >2000 counts, and if more than 50% of those come from <1% of pixels, then it is considered to be noise-dominated and hence unusable.
| Quadrant | # 1 sec bins | Bins with >0 counts | Bins with >2000 counts | High rate bins dominated by noise | Noise dominated (total time) | Noise dominated (detector-on time) | Marked lightcurve |
|---|---|---|---|---|---|---|---|
| A | 7408 | 5466 | 6 | 6 | 0.08% | 0.11% | 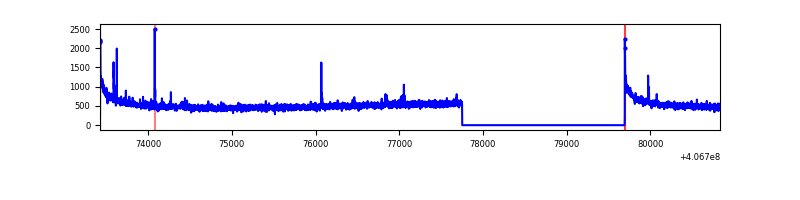 |
| B | 7408 | 5466 | 48 | 48 | 0.65% | 0.88% | 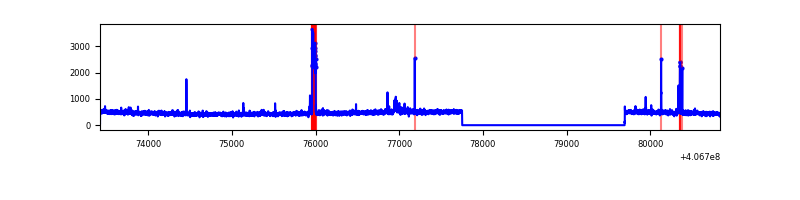 |
| C | 7408 | 5466 | 7 | 7 | 0.09% | 0.13% | 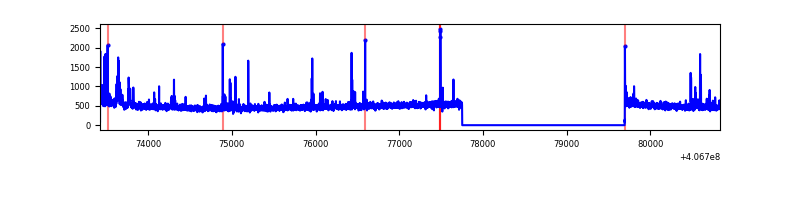 |
| D | 7408 | 5466 | 269 | 269 | 3.63% | 4.92% | 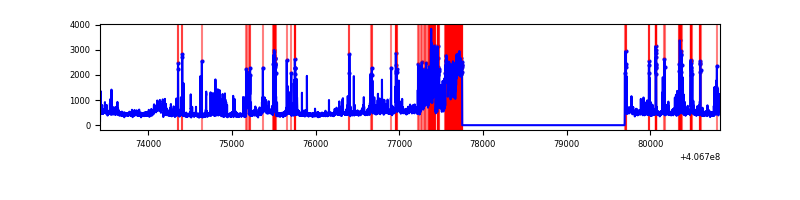 |
Top three noisy pixels from each quadrant. If the there are fewer than three noisy pixels in the level2.evt file, extra rows are filled as -1
| Pixel properties | Quadrant properties | ||||||
|---|---|---|---|---|---|---|---|
| Quadrant | DetID | PixID | Counts | Sigma | Mean | Median | Sigma |
| A | 10 | 83 | 399179 | 3101.97 | 630 | 619 | 128.5 |
| A | 13 | 248 | 20699 | 156.28 | 630 | 619 | 128.5 |
| A | 13 | 254 | 10402 | 76.14 | 630 | 619 | 128.5 |
| B | 5 | 184 | 138335 | 1163.74 | 625 | 610 | 118.3 |
| B | 12 | 111 | 14461 | 117.04 | 625 | 610 | 118.3 |
| B | 11 | 111 | 13602 | 109.78 | 625 | 610 | 118.3 |
| C | 15 | 214 | 221319 | 1555.29 | 610 | 614 | 141.9 |
| C | 14 | 254 | 123712 | 867.46 | 610 | 614 | 141.9 |
| C | 0 | 10 | 12759 | 85.58 | 610 | 614 | 141.9 |
| D | 10 | 118 | 458358 | 3224.78 | 588 | 572 | 142.0 |
| D | 9 | 49 | 298231 | 2096.8 | 588 | 572 | 142.0 |
| D | 12 | 6 | 156810 | 1100.59 | 588 | 572 | 142.0 |
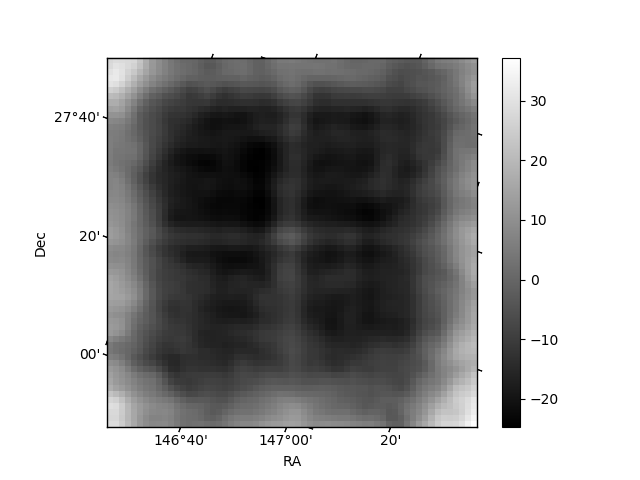
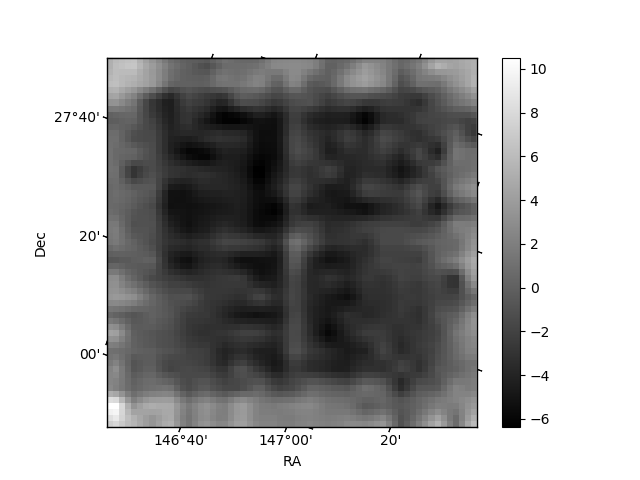
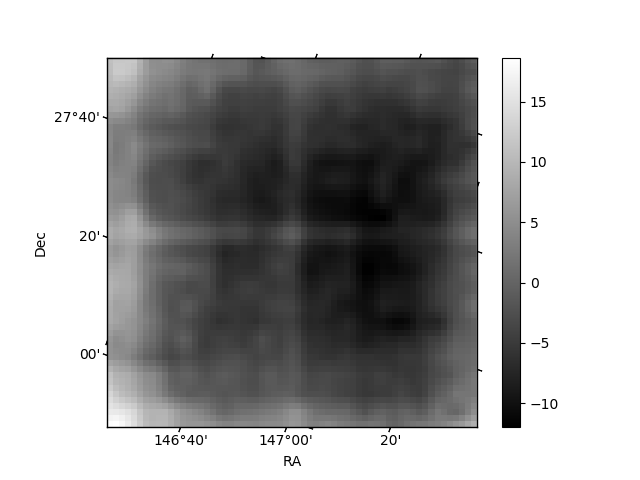
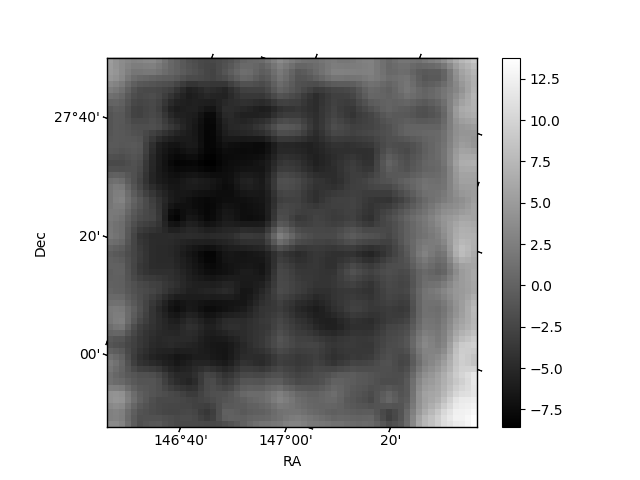
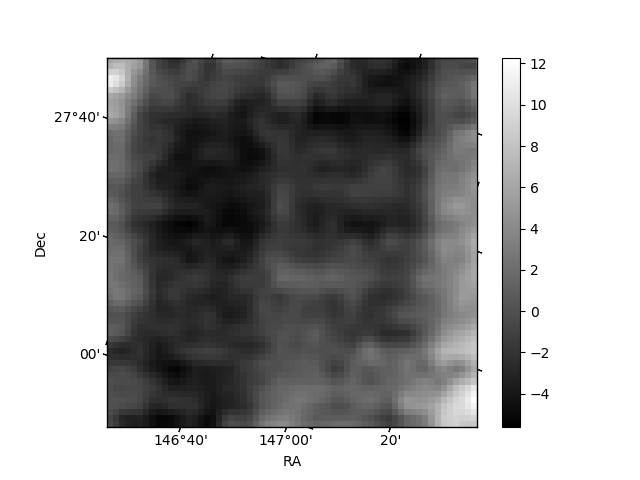
Histogram calculated using DETX and DETY for each event in the final _common_clean file
| Quadrant A | 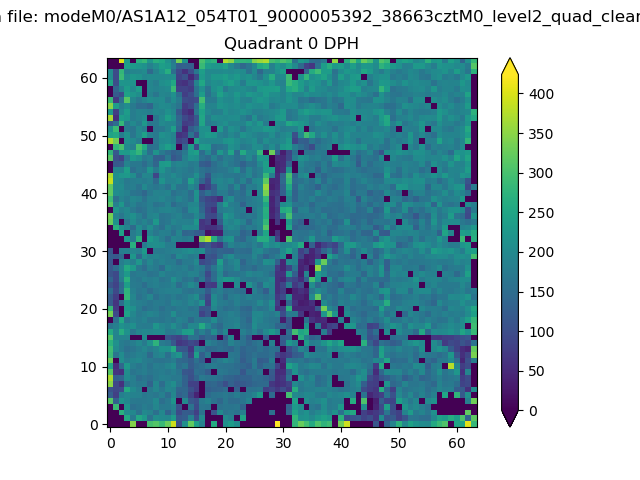 |
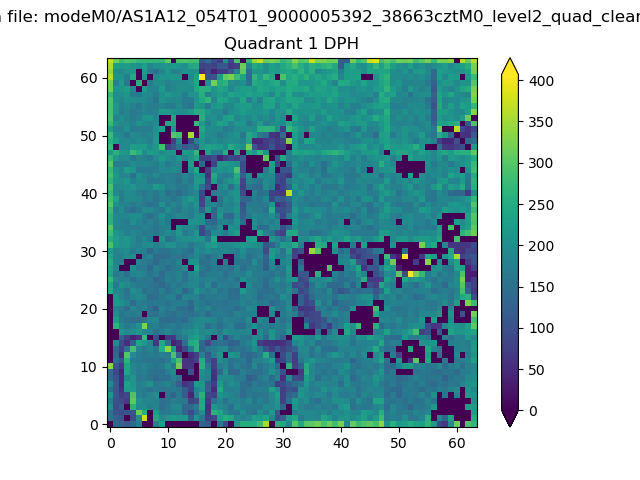 |
Quadrant B |
|---|---|---|---|
| Quadrant D | 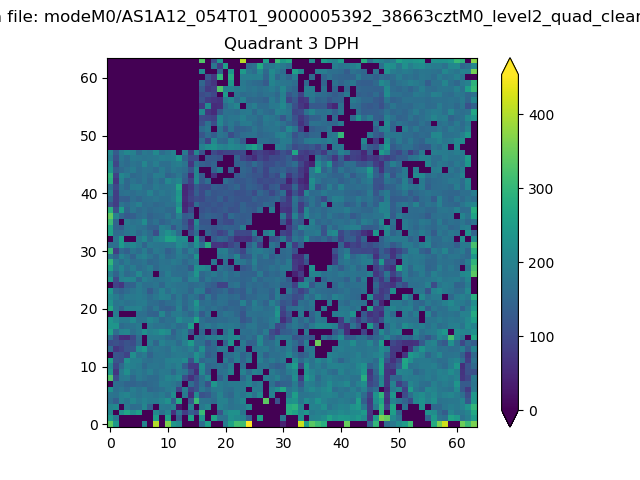 |
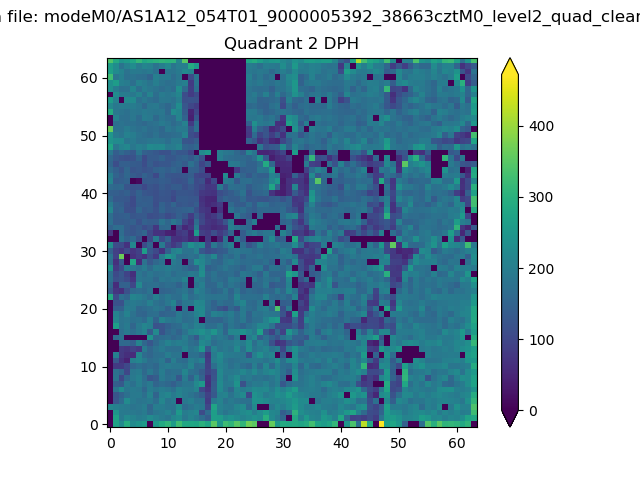 |
Quadrant C |
| Plot type | Count rate plots | Images |
|---|---|---|
| Comparison with Poisson distribution Blue bars denote a histogram of data divided into 1 sec bins. Red curve is a Poisson curve with rate = median count rate of data. |
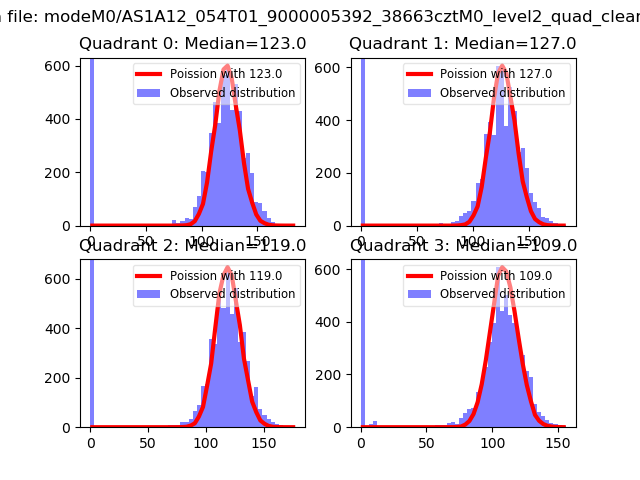 |
 |
| Quadrant-wise count rates Data is divided into 100 sec bins |
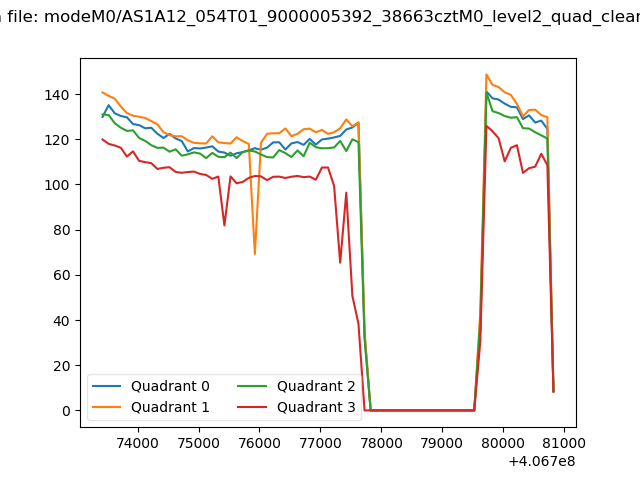 |
|
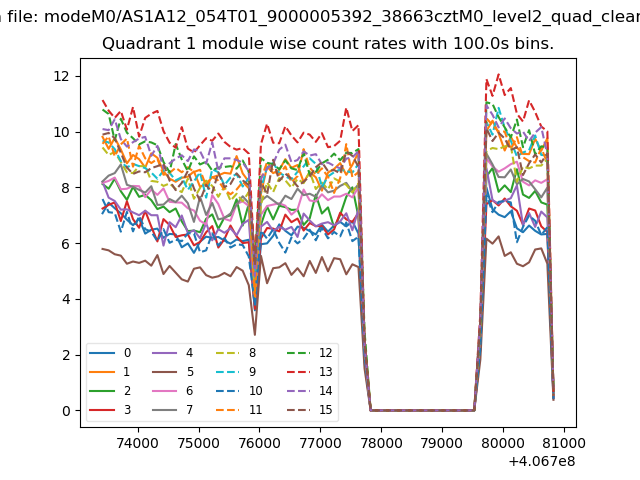
| Module-wise count rates for Quadrant A Data is divided into 100 sec bins |
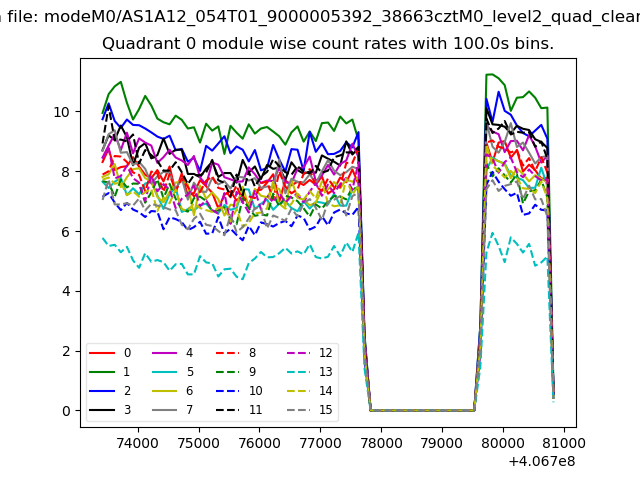 |
 |
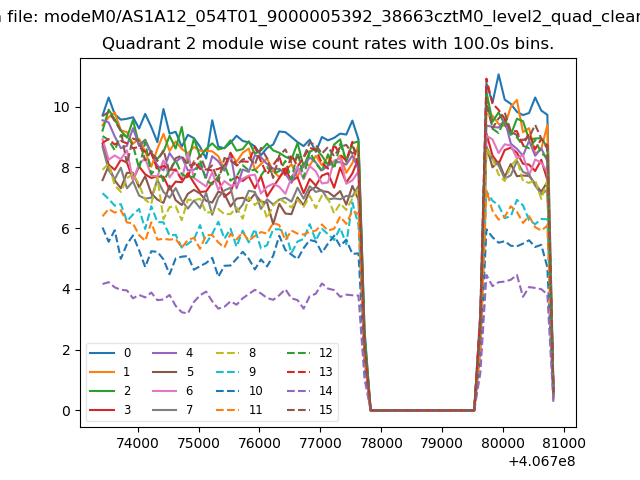
| Module-wise count rates for Quadrant B Data is divided into 100 sec bins |
 |
 |
| Module-wise count rates for Quadrant C Data is divided into 100 sec bins |
 |
 |
| Module-wise count rates for Quadrant D Data is divided into 100 sec bins |
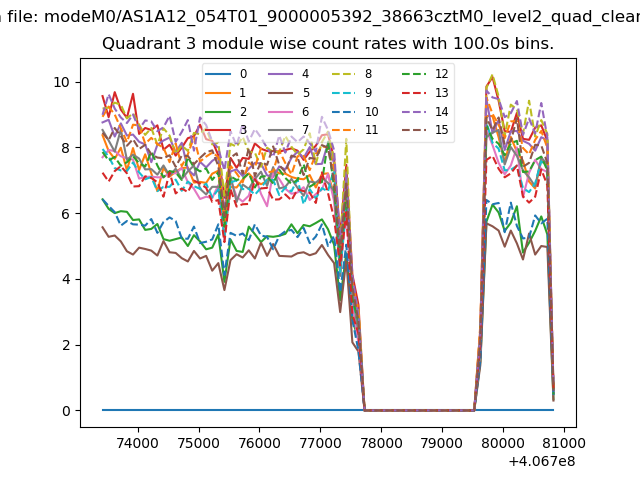 |
 |
| Parameter | Plot |
|---|---|
| CZT HV Monitor | 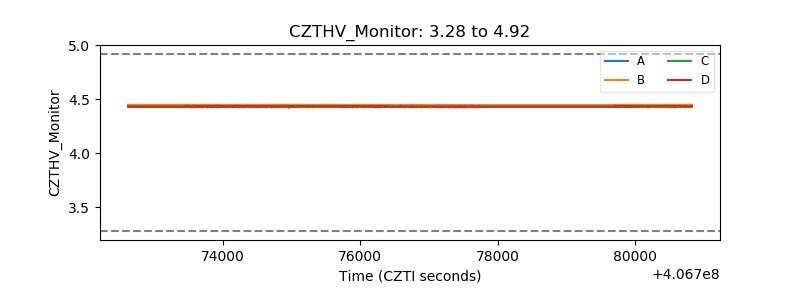 |
| D_VDD | 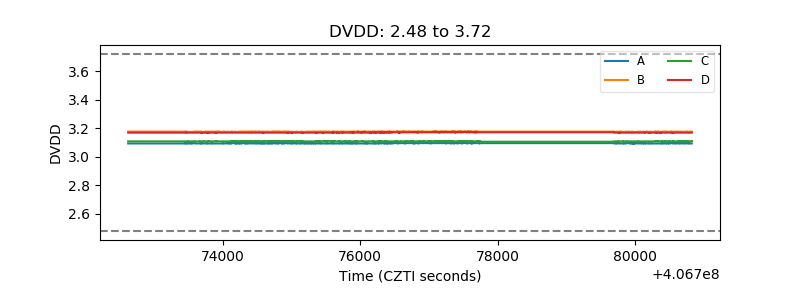 |
| Temperature 1 | 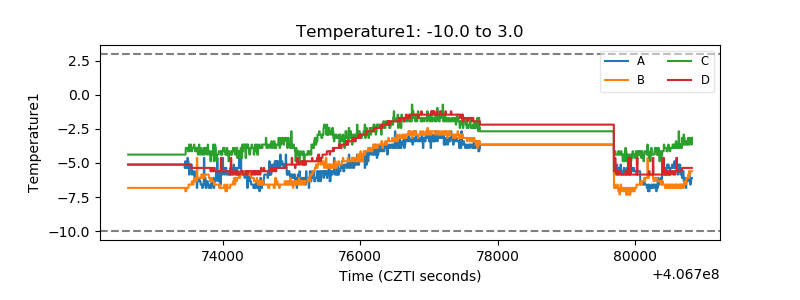 |
| Veto HV Monitor | 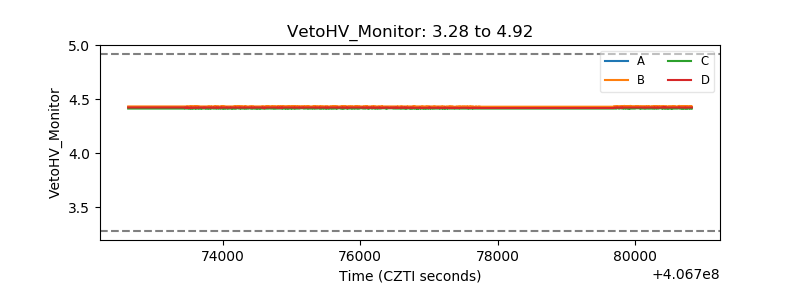 |
| Veto LLD | 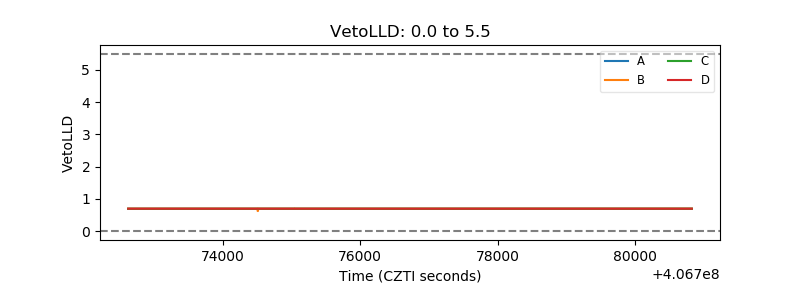 |
| Alpha Counter | 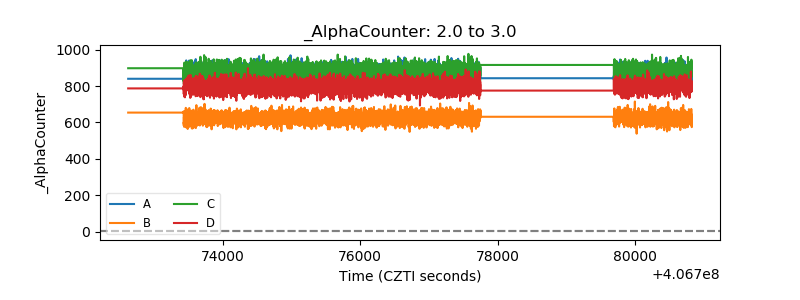 |
| _CPM_Rate | 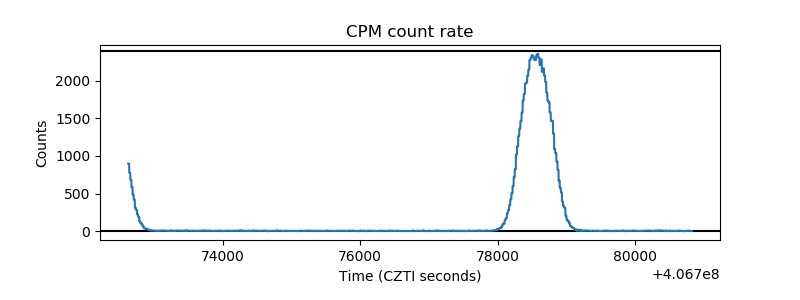 |
| CZT Counter | 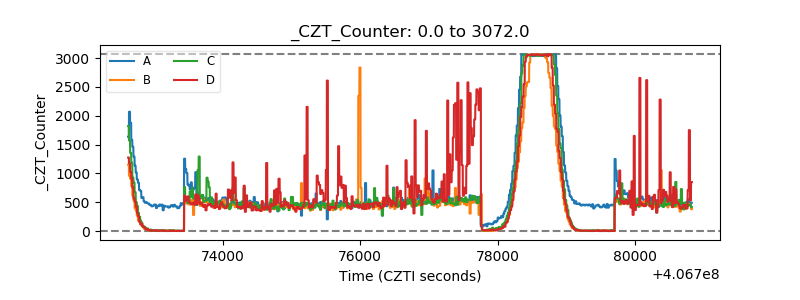 |
| +2.5 Volts monitor | 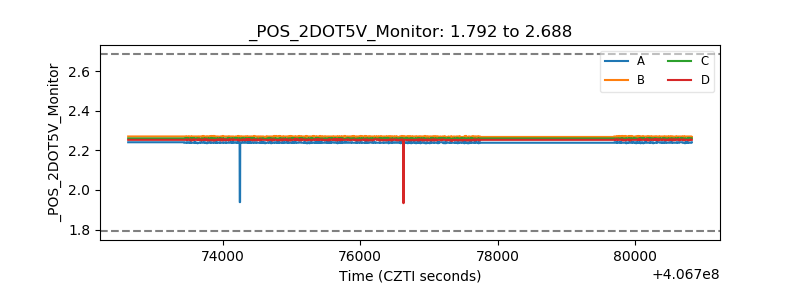 |
| +5 Volts monitor | 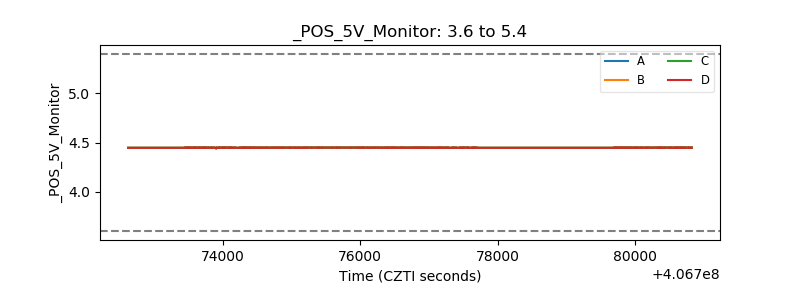 |
| _ROLL_ROT | 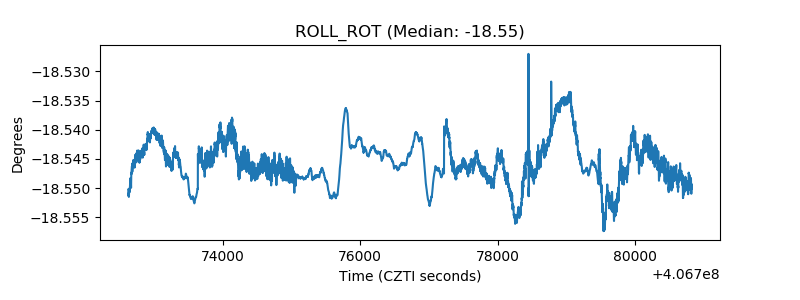 |
| _Roll_DEC | 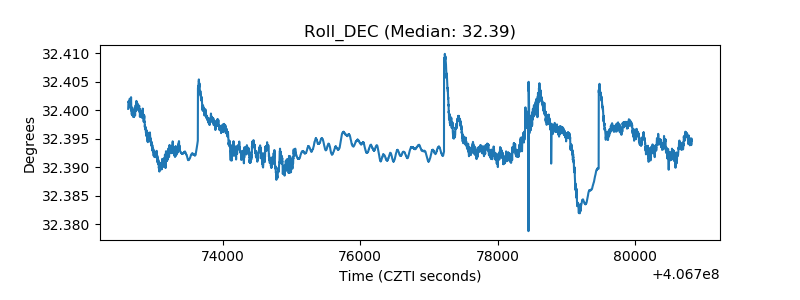 |
| _Roll_RA | 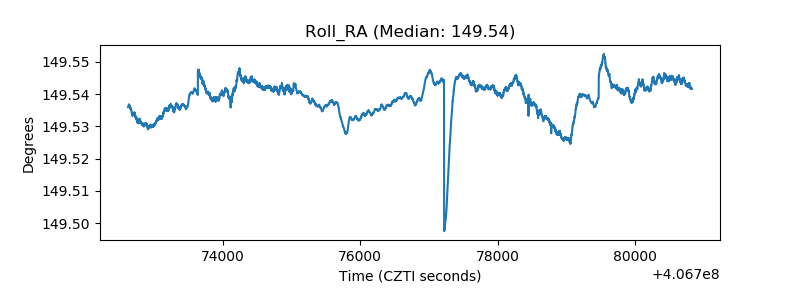 |
| Veto Counter | 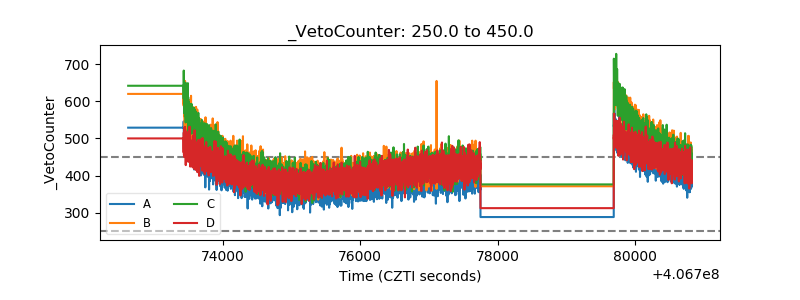 |