| Param | Original file | Final file |
|---|---|---|
| Filename | modeM0/AS1A12_054T01_9000005392_38664cztM0_level2.fits | modeM0/AS1A12_054T01_9000005392_38664cztM0_level2_quad_clean.evt |
| Size (bytes) | 365,947,200 | 95,336,640 |
| Size | 349.0 MB | 90.9 MB |
| Events in quadrant A | 3,287,668 | 657,233 |
| Events in quadrant B | 3,113,407 | 654,626 |
| Events in quadrant C | 2,598,308 | 639,448 |
| Events in quadrant D | 4,140,426 | 570,105 |
| Mode M9 | |||
|---|---|---|---|
| Quadrant | BADHDUFLAG | Total packets | Discarded packets |
| A | 0 | 32 | 0 |
| B | 0 | 32 | 0 |
| C | 0 | 32 | 0 |
| D | 0 | 33 | 0 |
| Mode SS | |||
|---|---|---|---|
| Quadrant | BADHDUFLAG | Total packets | Discarded packets |
| A | 0 | 106 | 0 |
| B | 0 | 106 | 0 |
| C | 0 | 106 | 0 |
| D | 0 | 106 | 0 |
| Mode M0 | |||
|---|---|---|---|
| Quadrant | BADHDUFLAG | Total packets | Discarded packets |
| A | 0 | 13056 | 3 |
| B | 0 | 12514 | 2 |
| C | 0 | 10734 | 2 |
| D | 0 | 15922 | 2 |
| Quadrant | Total seconds | Saturated seconds | Saturation percentage |
|---|---|---|---|
| A | 5222 | 83 | 1.589429% |
| B | 5222 | 267 | 5.112984% |
| C | 5222 | 6 | 0.114899% |
| D | 5222 | 239 | 4.576791% |
Noise dominated data is calculated using 1-second bins in cleaned event files. If a bin has >2000 counts, and if more than 50% of those come from <1% of pixels, then it is considered to be noise-dominated and hence unusable.
| Quadrant | # 1 sec bins | Bins with >0 counts | Bins with >2000 counts | High rate bins dominated by noise | Noise dominated (total time) | Noise dominated (detector-on time) | Marked lightcurve |
|---|---|---|---|---|---|---|---|
| A | 7284 | 5223 | 43 | 43 | 0.59% | 0.82% | 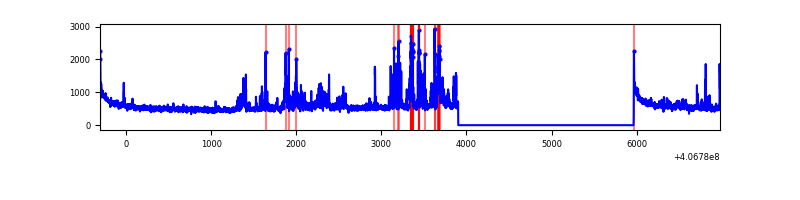 |
| B | 7284 | 5223 | 219 | 219 | 3.01% | 4.19% | 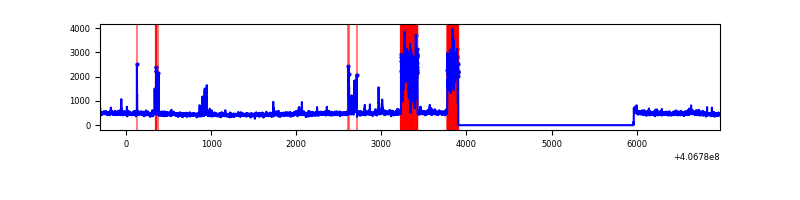 |
| C | 7284 | 5223 | 3 | 3 | 0.04% | 0.06% | 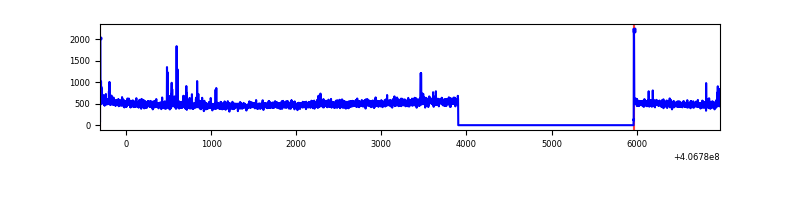 |
| D | 7284 | 5223 | 206 | 206 | 2.83% | 3.94% | 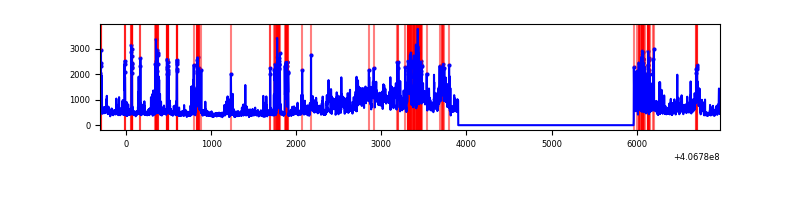 |
Top three noisy pixels from each quadrant. If the there are fewer than three noisy pixels in the level2.evt file, extra rows are filled as -1
| Pixel properties | Quadrant properties | ||||||
|---|---|---|---|---|---|---|---|
| Quadrant | DetID | PixID | Counts | Sigma | Mean | Median | Sigma |
| A | 13 | 248 | 497867 | 4017.52 | 614 | 605 | 123.8 |
| A | 10 | 83 | 393650 | 3175.52 | 614 | 605 | 123.8 |
| A | 13 | 254 | 10078 | 76.54 | 614 | 605 | 123.8 |
| B | 4 | 251 | 647653 | 5699.69 | 596 | 581 | 113.5 |
| B | 5 | 172 | 50624 | 440.8 | 596 | 581 | 113.5 |
| B | 5 | 184 | 26092 | 224.71 | 596 | 581 | 113.5 |
| C | 15 | 214 | 211731 | 1523.39 | 597 | 601 | 138.6 |
| C | 14 | 254 | 25009 | 176.11 | 597 | 601 | 138.6 |
| C | 0 | 10 | 15655 | 108.62 | 597 | 601 | 138.6 |
| D | 9 | 49 | 808653 | 5686.93 | 583 | 569 | 142.1 |
| D | 10 | 118 | 544553 | 3828.31 | 583 | 569 | 142.1 |
| D | 12 | 6 | 90180 | 630.64 | 583 | 569 | 142.1 |
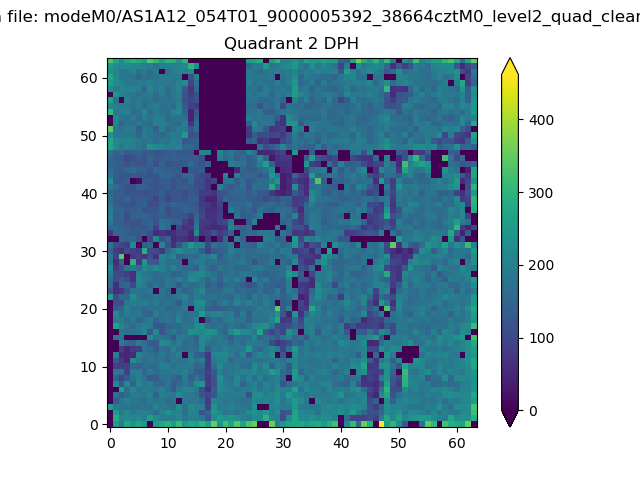
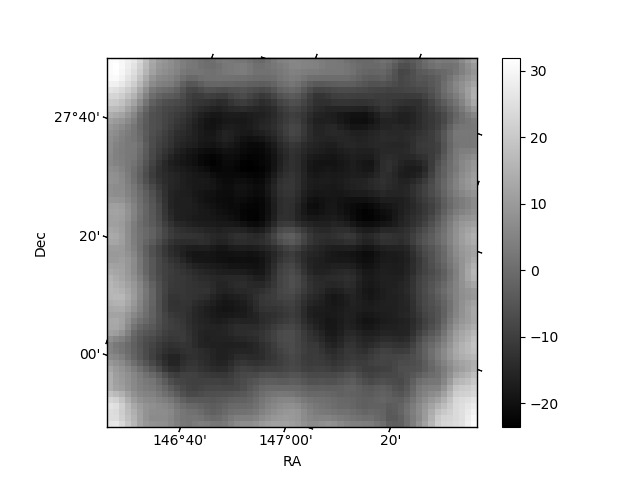
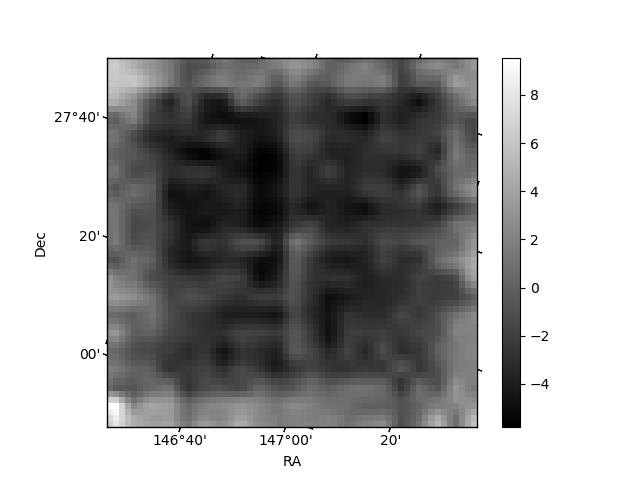
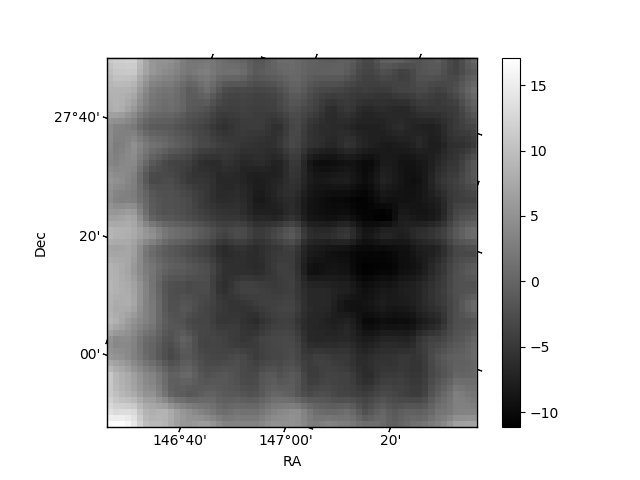
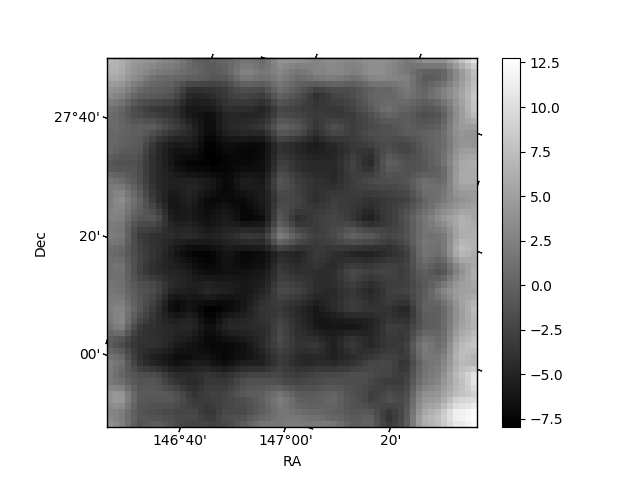
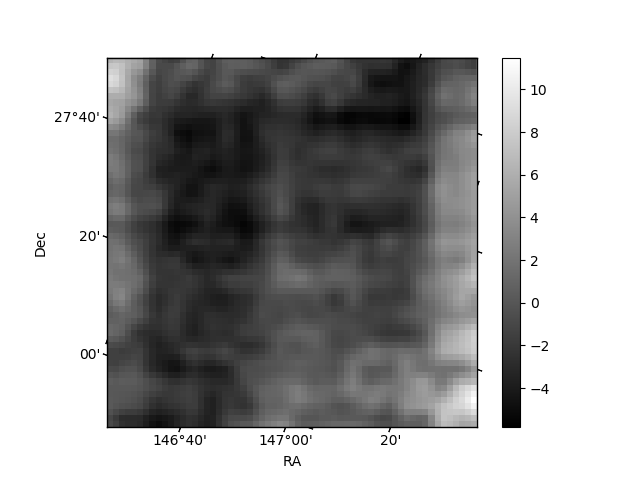
Histogram calculated using DETX and DETY for each event in the final _common_clean file
| Quadrant A | 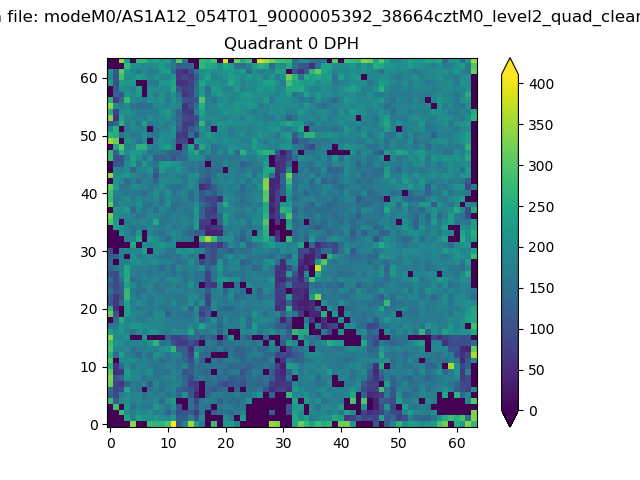 |
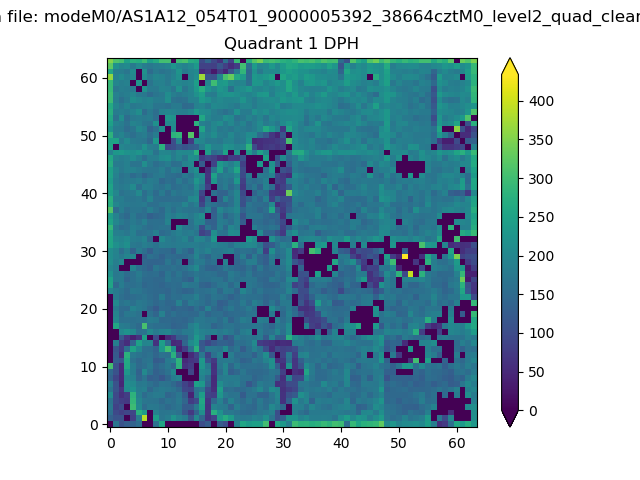 |
Quadrant B |
|---|---|---|---|
| Quadrant D | 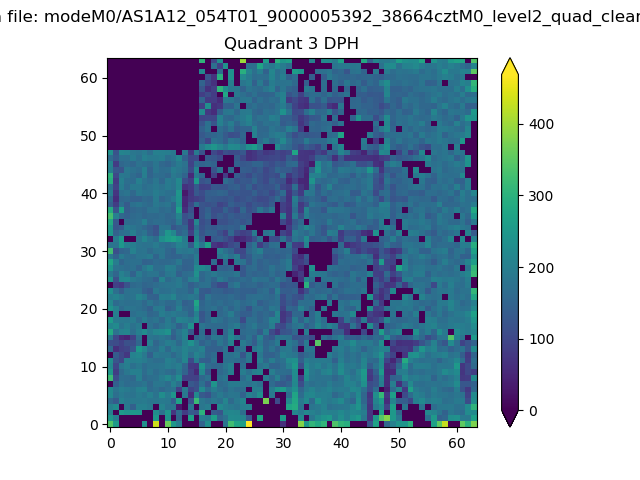 |
 |
Quadrant C |
| Plot type | Count rate plots | Images |
|---|---|---|
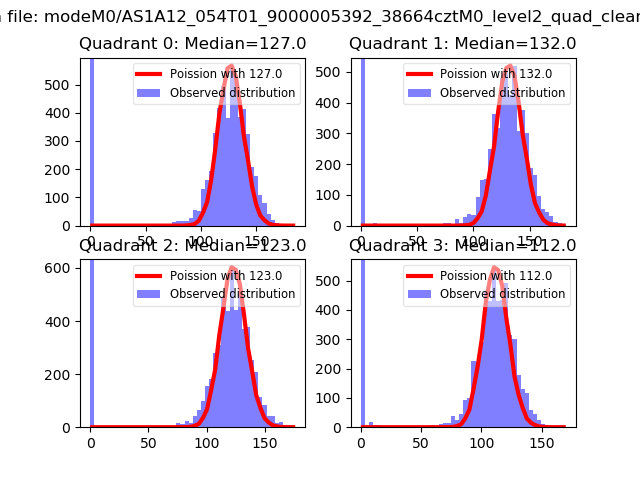
| Comparison with Poisson distribution Blue bars denote a histogram of data divided into 1 sec bins. Red curve is a Poisson curve with rate = median count rate of data. |
 |
 |
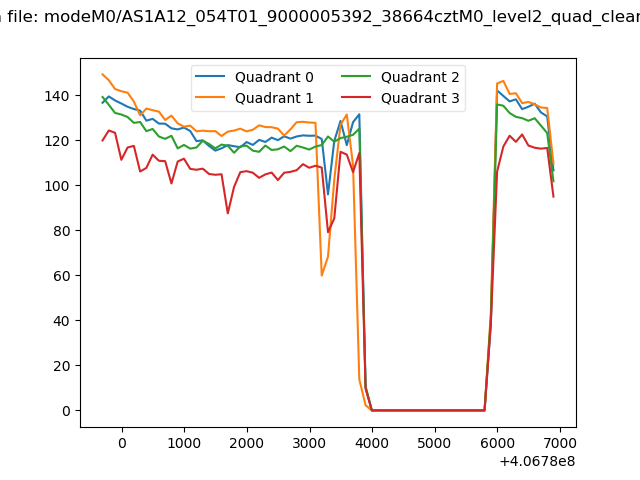
| Quadrant-wise count rates Data is divided into 100 sec bins |
 |
|
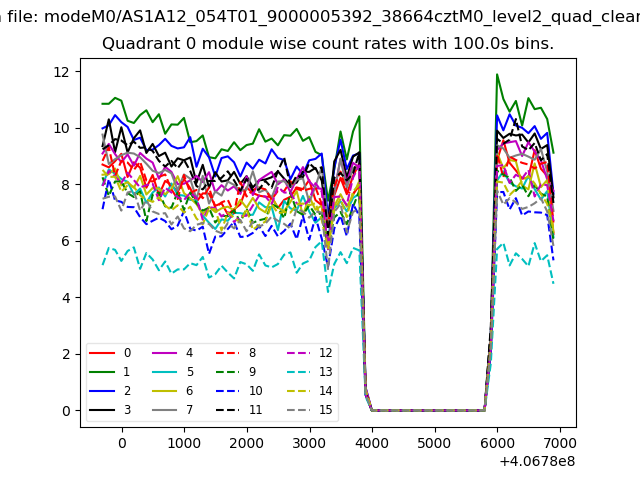
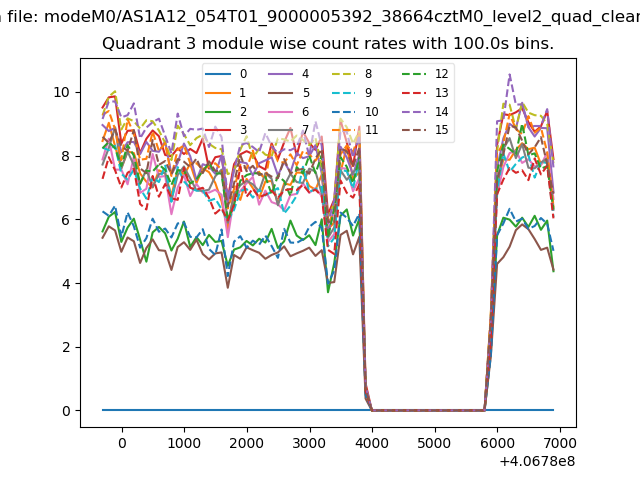
| Module-wise count rates for Quadrant A Data is divided into 100 sec bins |
 |
 |
| Module-wise count rates for Quadrant B Data is divided into 100 sec bins |
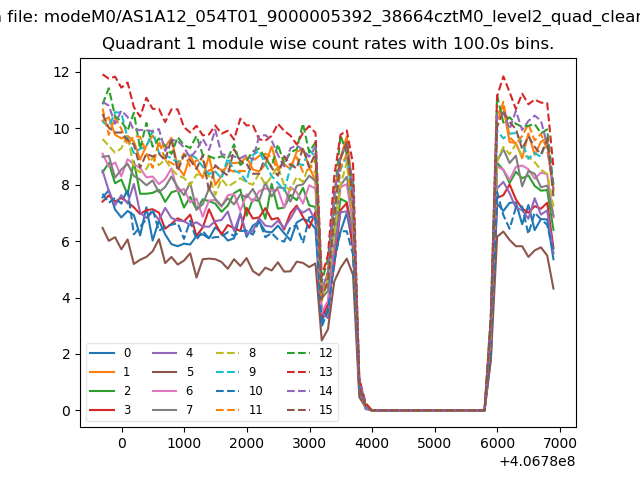 |
 |
| Module-wise count rates for Quadrant C Data is divided into 100 sec bins |
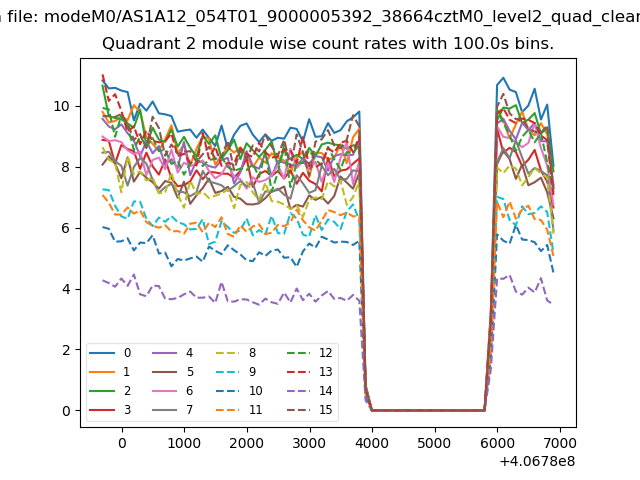 |
 |
| Module-wise count rates for Quadrant D Data is divided into 100 sec bins |
 |
 |
| Parameter | Plot |
|---|---|
| CZT HV Monitor | 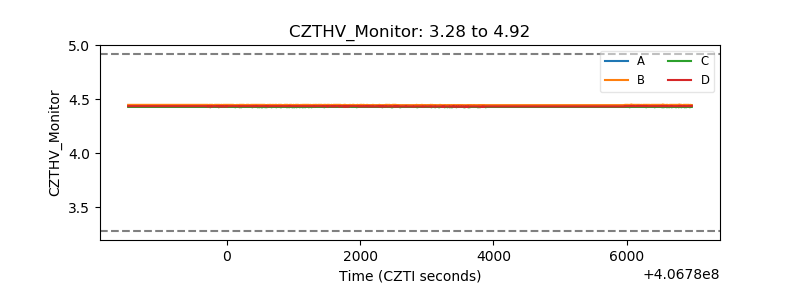 |
| D_VDD | 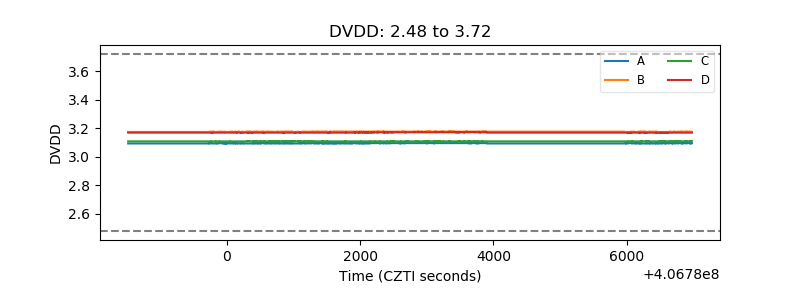 |
| Temperature 1 | 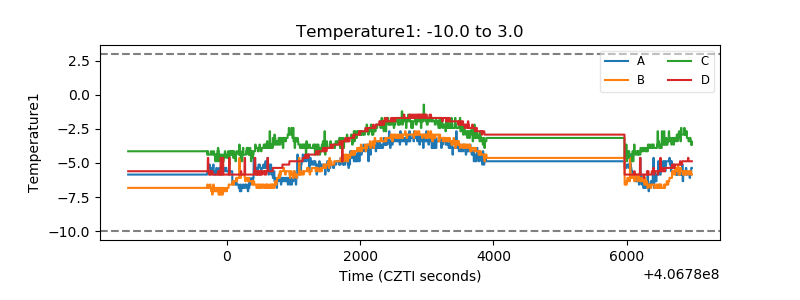 |
| Veto HV Monitor | 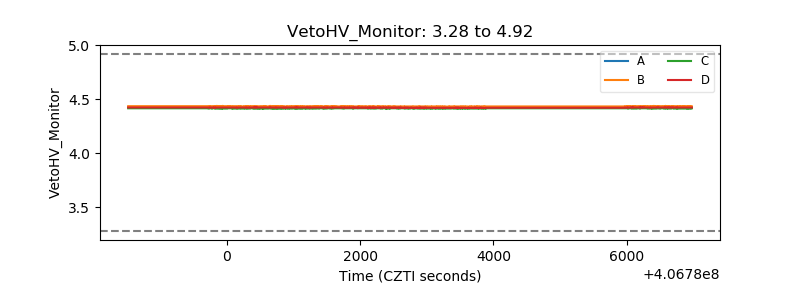 |
| Veto LLD | 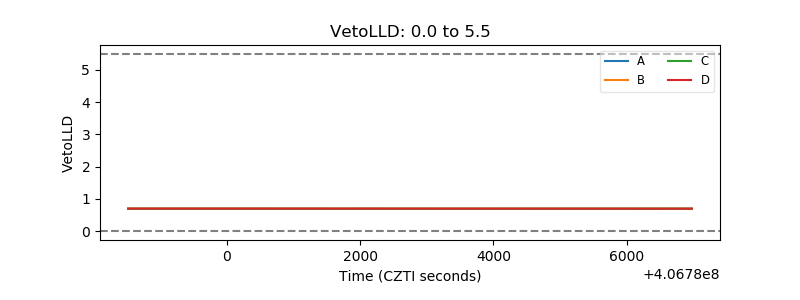 |
| Alpha Counter | 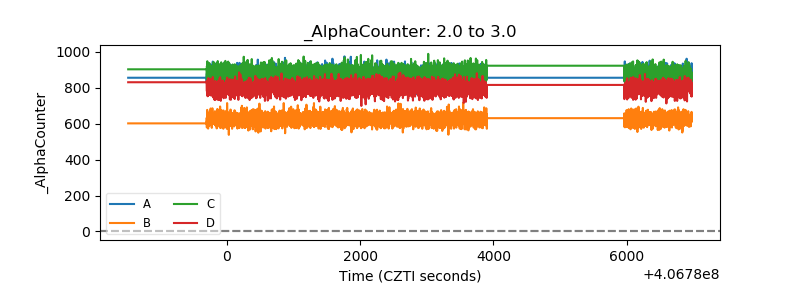 |
| _CPM_Rate | 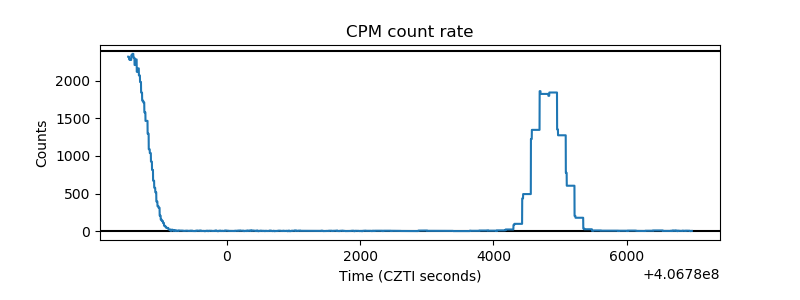 |
| CZT Counter | 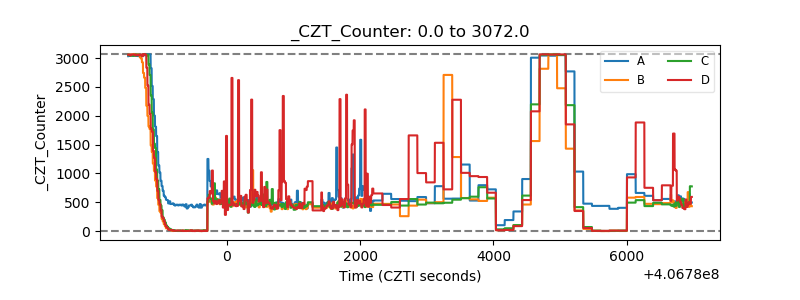 |
| +2.5 Volts monitor | 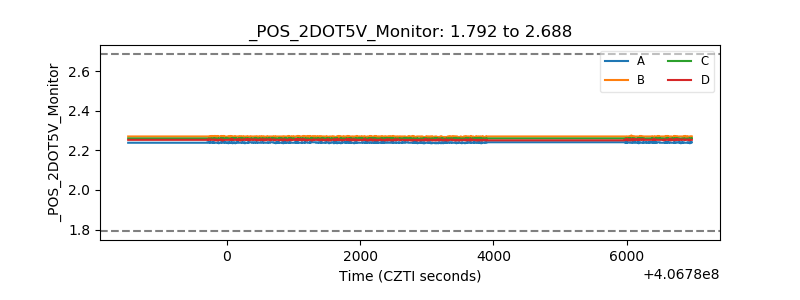 |
| +5 Volts monitor | 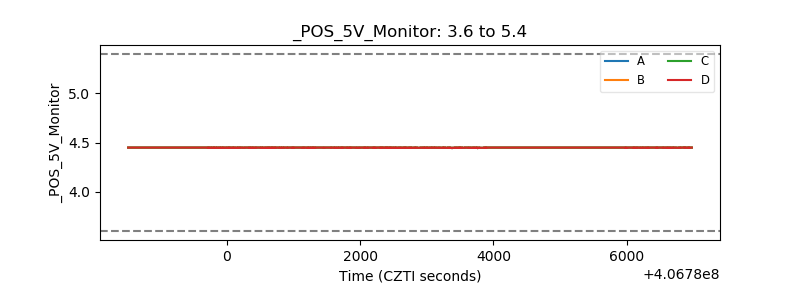 |
| _ROLL_ROT | 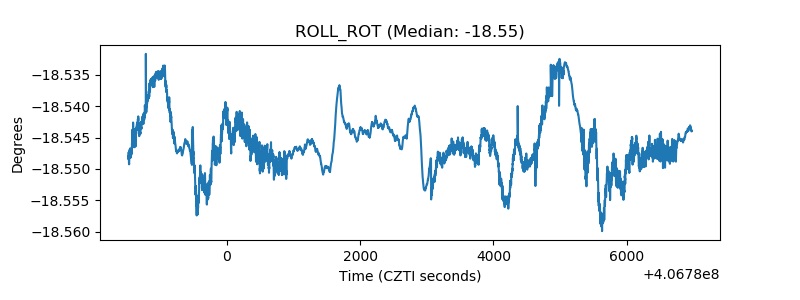 |
| _Roll_DEC | 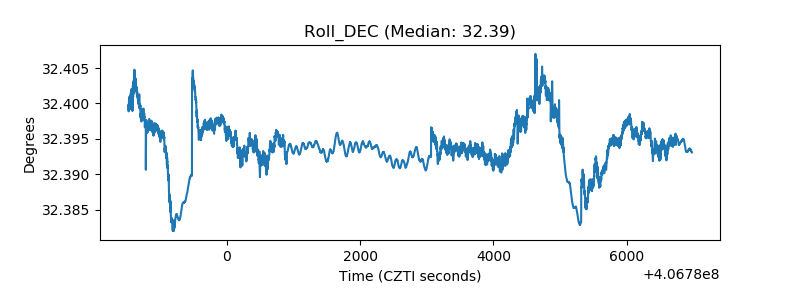 |
| _Roll_RA | 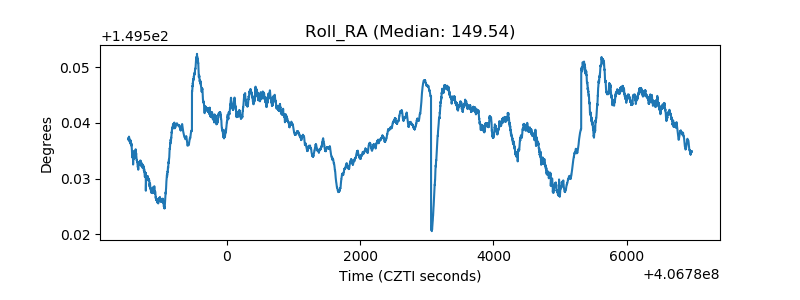 |
| Veto Counter | 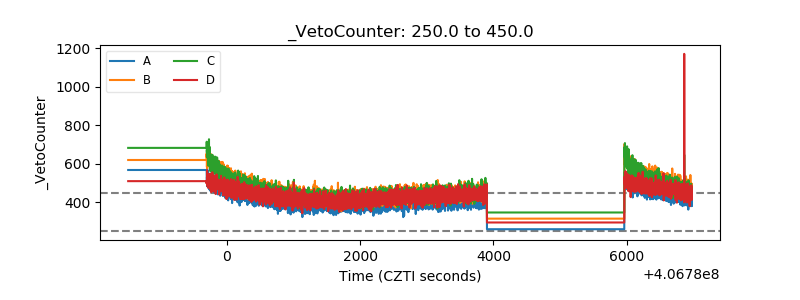 |