| Param | Original file | Final file |
|---|---|---|
| Filename | modeM0/AS1A12_054T01_9000005392_38665cztM0_level2.fits | modeM0/AS1A12_054T01_9000005392_38665cztM0_level2_quad_clean.evt |
| Size (bytes) | 395,193,600 | 91,837,440 |
| Size | 376.9 MB | 87.6 MB |
| Events in quadrant A | 4,017,539 | 605,387 |
| Events in quadrant B | 2,521,466 | 670,415 |
| Events in quadrant C | 2,594,095 | 628,346 |
| Events in quadrant D | 5,094,542 | 516,158 |
| Mode M9 | |||
|---|---|---|---|
| Quadrant | BADHDUFLAG | Total packets | Discarded packets |
| A | 0 | 28 | 0 |
| B | 0 | 28 | 0 |
| C | 0 | 28 | 0 |
| D | 0 | 29 | 0 |
| Mode SS | |||
|---|---|---|---|
| Quadrant | BADHDUFLAG | Total packets | Discarded packets |
| A | 0 | 104 | 0 |
| B | 0 | 104 | 0 |
| C | 0 | 104 | 0 |
| D | 0 | 104 | 0 |
| Mode M0 | |||
|---|---|---|---|
| Quadrant | BADHDUFLAG | Total packets | Discarded packets |
| A | 0 | 15193 | 3 |
| B | 0 | 10699 | 2 |
| C | 0 | 10651 | 2 |
| D | 0 | 18749 | 2 |
| Quadrant | Total seconds | Saturated seconds | Saturation percentage |
|---|---|---|---|
| A | 5153 | 430 | 8.344654% |
| B | 5153 | 28 | 0.543373% |
| C | 5153 | 8 | 0.155249% |
| D | 5153 | 680 | 13.196196% |
Noise dominated data is calculated using 1-second bins in cleaned event files. If a bin has >2000 counts, and if more than 50% of those come from <1% of pixels, then it is considered to be noise-dominated and hence unusable.
| Quadrant | # 1 sec bins | Bins with >0 counts | Bins with >2000 counts | High rate bins dominated by noise | Noise dominated (total time) | Noise dominated (detector-on time) | Marked lightcurve |
|---|---|---|---|---|---|---|---|
| A | 7276 | 5154 | 367 | 367 | 5.04% | 7.12% | 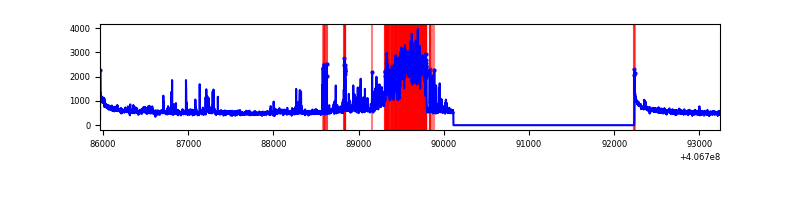 |
| B | 7276 | 5154 | 16 | 16 | 0.22% | 0.31% | 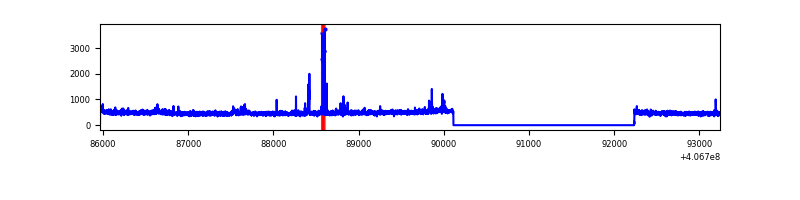 |
| C | 7276 | 5154 | 10 | 10 | 0.14% | 0.19% | 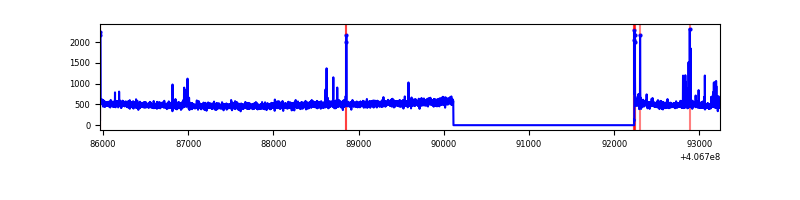 |
| D | 7276 | 5154 | 602 | 602 | 8.27% | 11.68% | 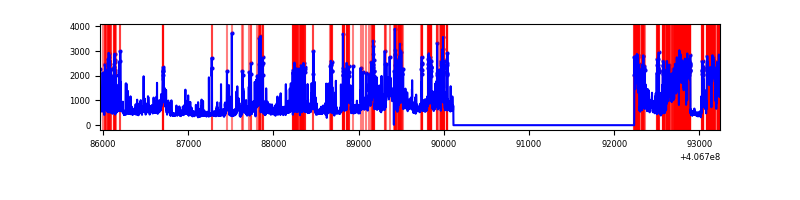 |
Top three noisy pixels from each quadrant. If the there are fewer than three noisy pixels in the level2.evt file, extra rows are filled as -1
| Pixel properties | Quadrant properties | ||||||
|---|---|---|---|---|---|---|---|
| Quadrant | DetID | PixID | Counts | Sigma | Mean | Median | Sigma |
| A | 13 | 248 | 1282928 | 10848.15 | 587 | 576 | 118.2 |
| A | 10 | 83 | 383105 | 3236.03 | 587 | 576 | 118.2 |
| A | 9 | 143 | 63771 | 534.6 | 587 | 576 | 118.2 |
| B | 5 | 172 | 67251 | 573.36 | 605 | 590 | 116.3 |
| B | 0 | 155 | 26266 | 220.84 | 605 | 590 | 116.3 |
| B | 5 | 184 | 24193 | 203.01 | 605 | 590 | 116.3 |
| C | 15 | 214 | 210939 | 1541.53 | 591 | 596 | 136.5 |
| C | 15 | 208 | 57554 | 417.42 | 591 | 596 | 136.5 |
| C | 0 | 10 | 20378 | 144.97 | 591 | 596 | 136.5 |
| D | 13 | 171 | 1046127 | 7694.99 | 554 | 538 | 135.9 |
| D | 9 | 49 | 437239 | 3213.89 | 554 | 538 | 135.9 |
| D | 10 | 118 | 416779 | 3063.32 | 554 | 538 | 135.9 |
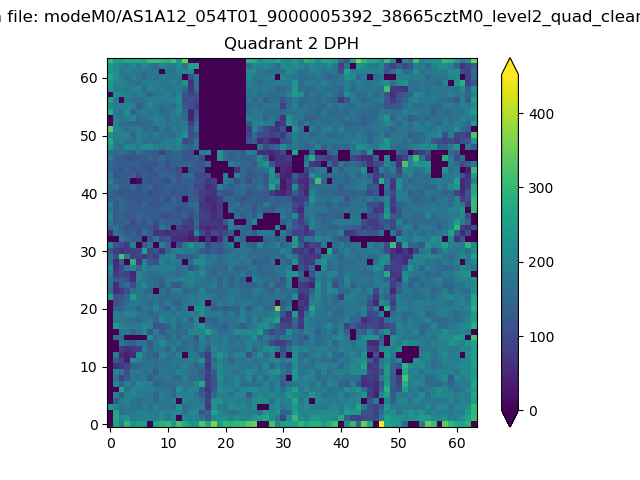
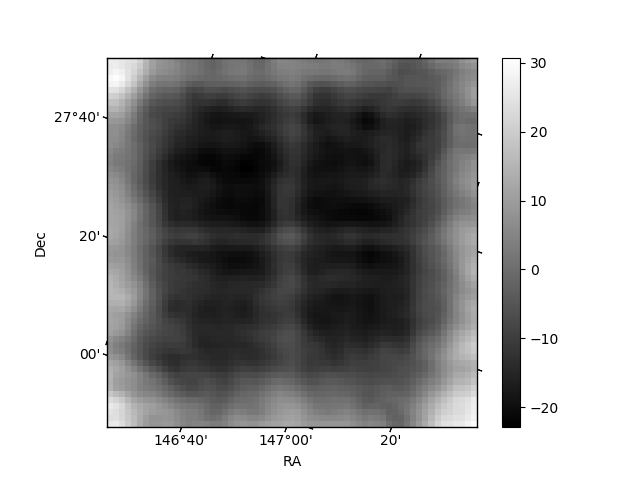
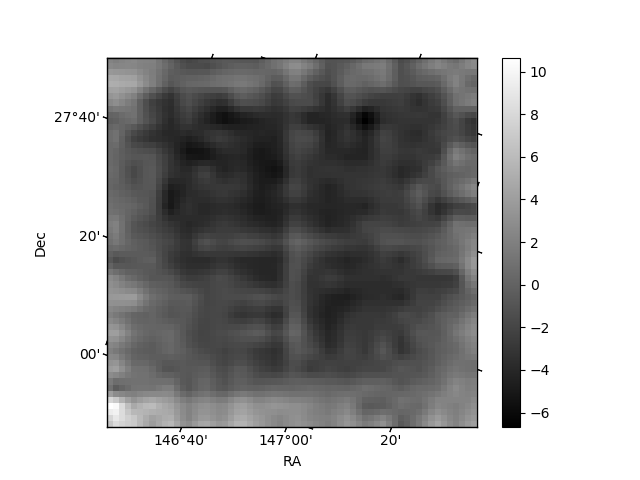
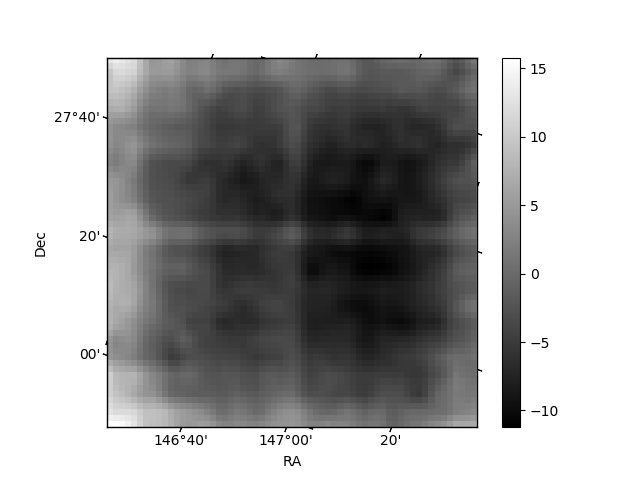
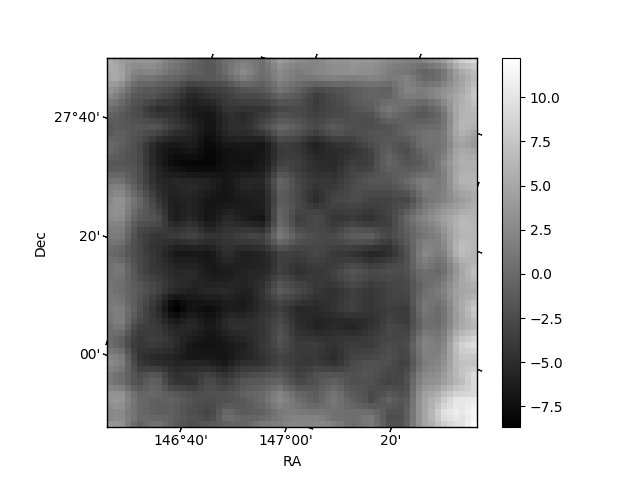
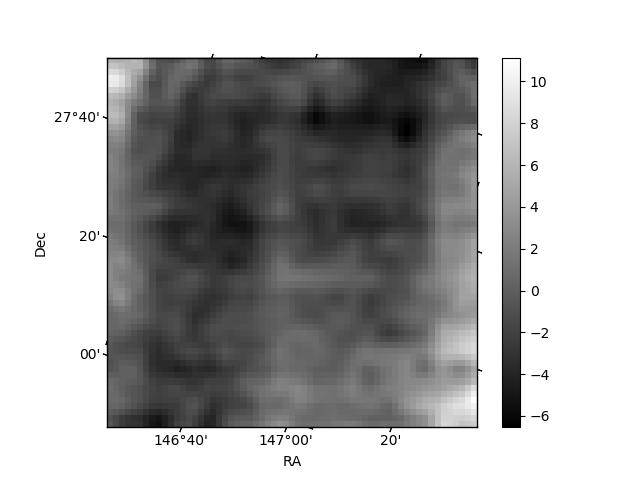
Histogram calculated using DETX and DETY for each event in the final _common_clean file
| Quadrant A | 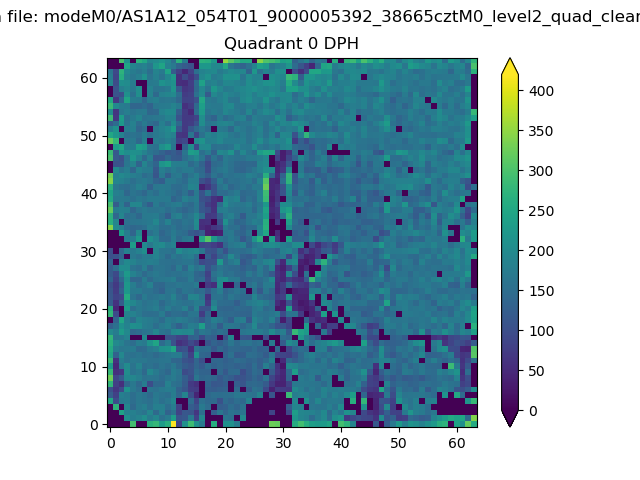 |
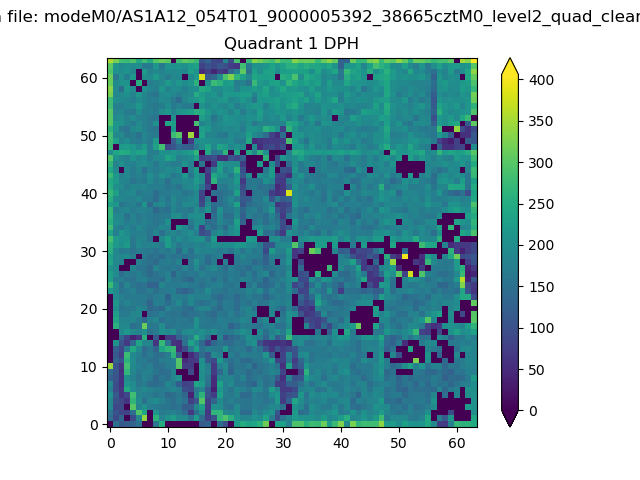 |
Quadrant B |
|---|---|---|---|
| Quadrant D | 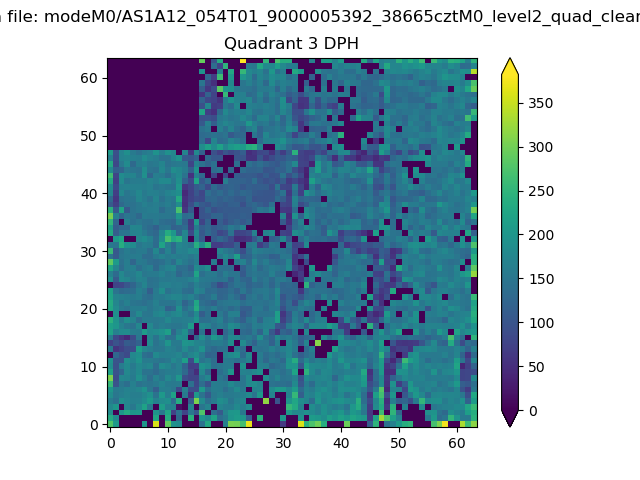 |
 |
Quadrant C |
| Plot type | Count rate plots | Images |
|---|---|---|
| Comparison with Poisson distribution Blue bars denote a histogram of data divided into 1 sec bins. Red curve is a Poisson curve with rate = median count rate of data. |
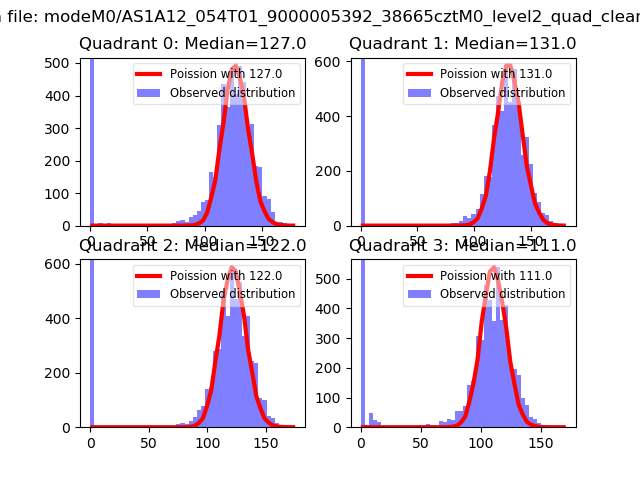 |
 |
| Quadrant-wise count rates Data is divided into 100 sec bins |
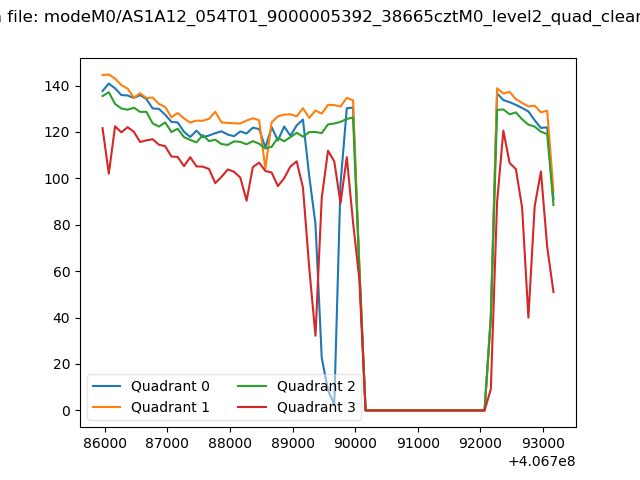 |
|
| Module-wise count rates for Quadrant A Data is divided into 100 sec bins |
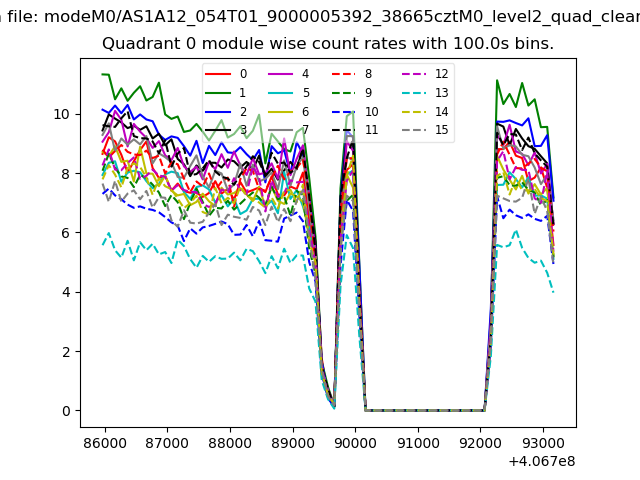 |
 |
| Module-wise count rates for Quadrant B Data is divided into 100 sec bins |
 |
 |
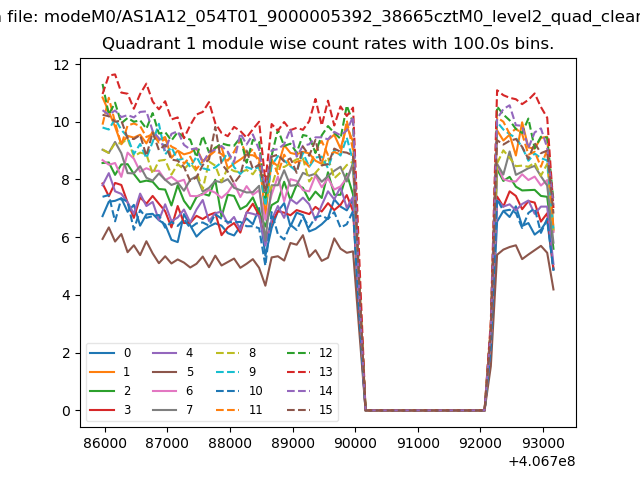
| Module-wise count rates for Quadrant C Data is divided into 100 sec bins |
 |
 |
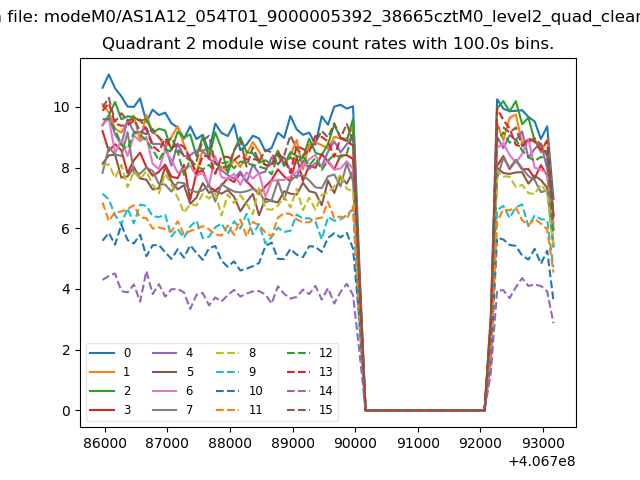
| Module-wise count rates for Quadrant D Data is divided into 100 sec bins |
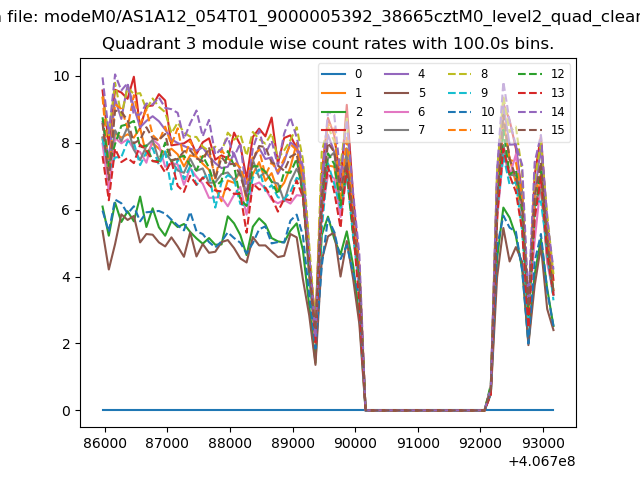 |
 |
| Parameter | Plot |
|---|---|
| CZT HV Monitor | 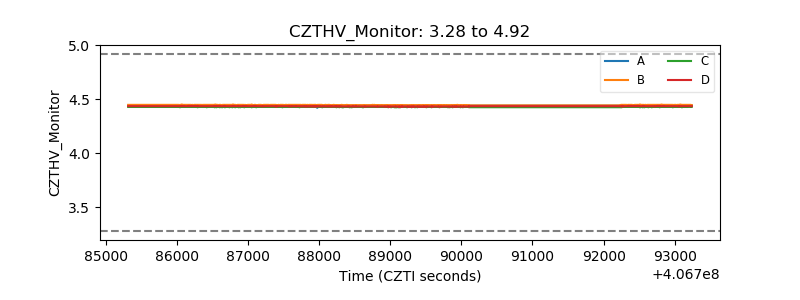 |
| D_VDD | 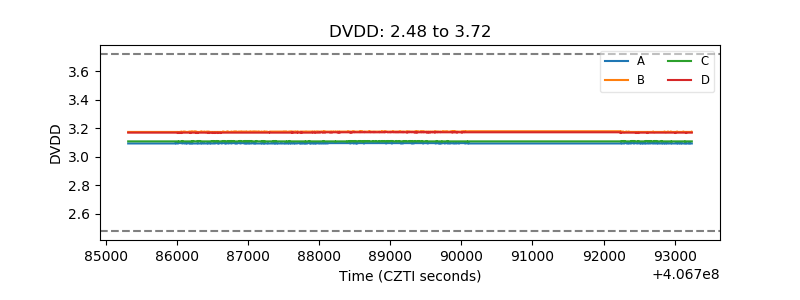 |
| Temperature 1 | 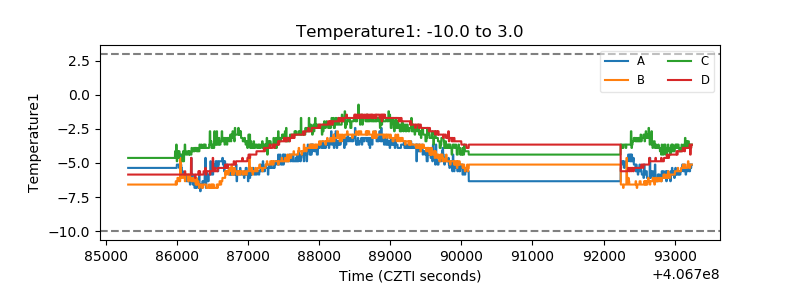 |
| Veto HV Monitor | 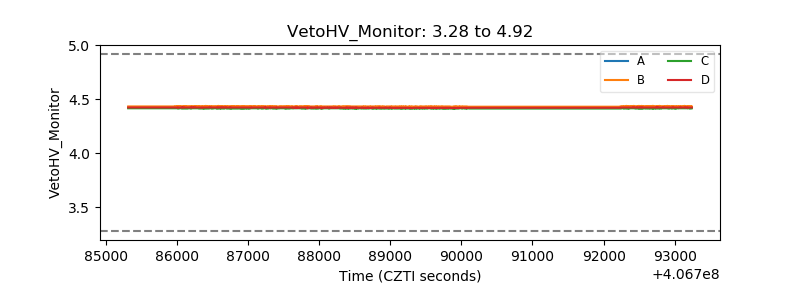 |
| Veto LLD | 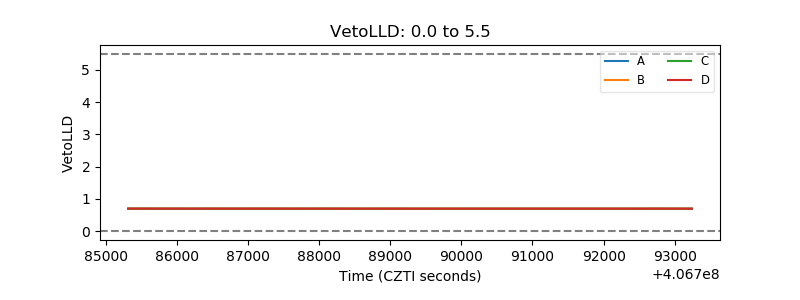 |
| Alpha Counter | 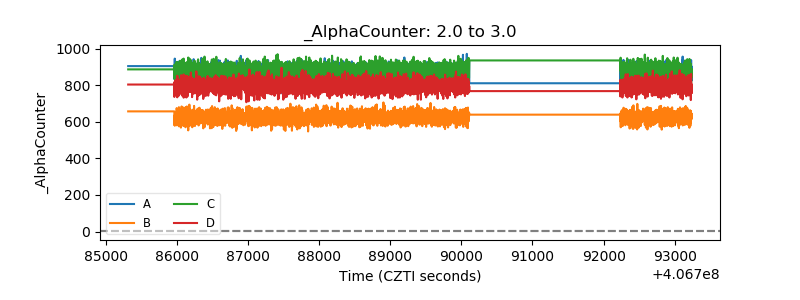 |
| _CPM_Rate | 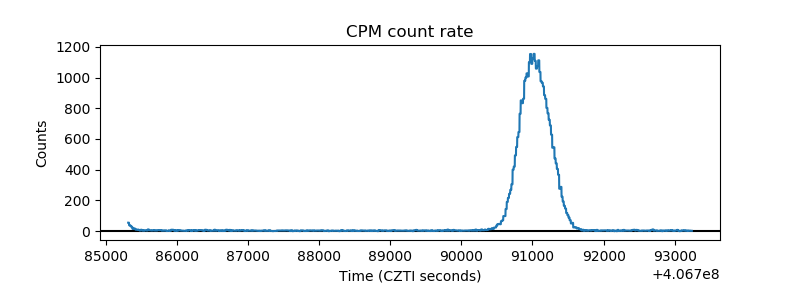 |
| CZT Counter | 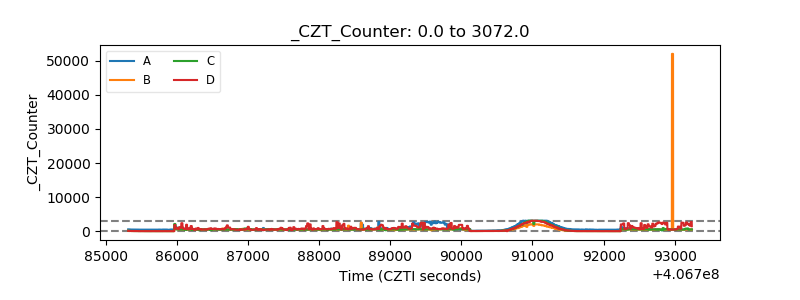 |
| +2.5 Volts monitor | 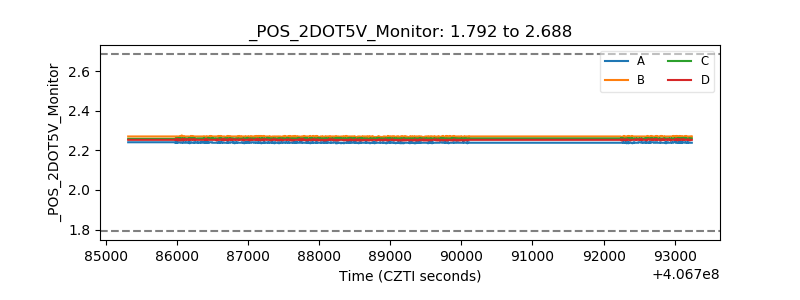 |
| +5 Volts monitor | 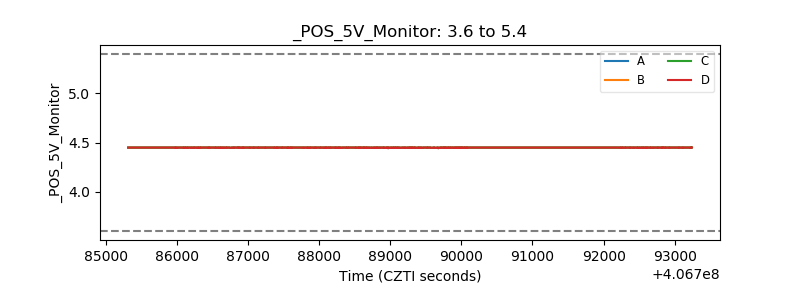 |
| _ROLL_ROT | 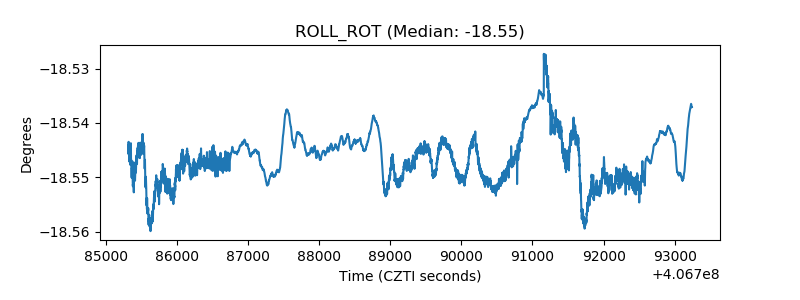 |
| _Roll_DEC | 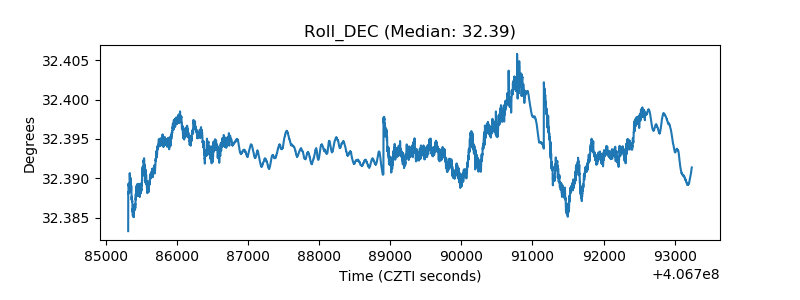 |
| _Roll_RA | 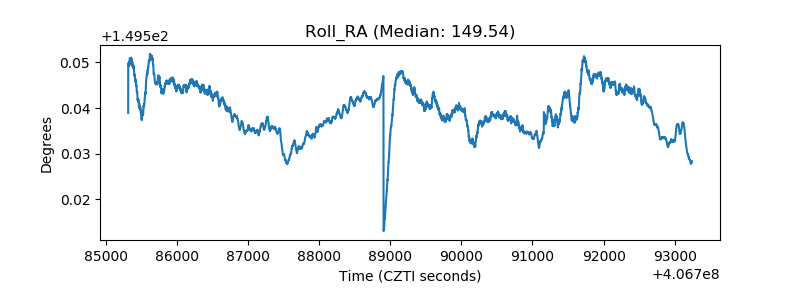 |
| Veto Counter | 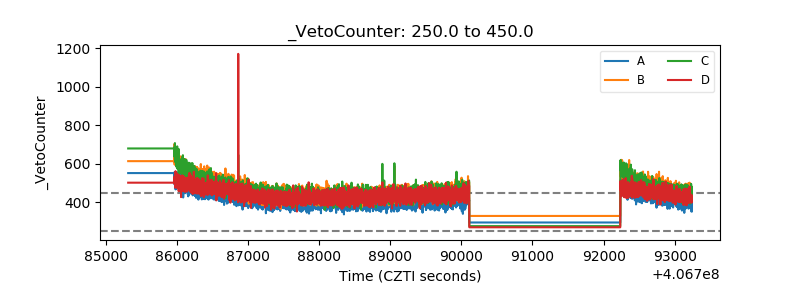 |