| Param | Original file | Final file |
|---|---|---|
| Filename | modeM0/AS1A12_054T01_9000005392_38666cztM0_level2.fits | modeM0/AS1A12_054T01_9000005392_38666cztM0_level2_quad_clean.evt |
| Size (bytes) | 317,286,720 | 83,577,600 |
| Size | 302.6 MB | 79.7 MB |
| Events in quadrant A | 2,632,609 | 576,037 |
| Events in quadrant B | 2,236,166 | 592,797 |
| Events in quadrant C | 2,489,785 | 553,388 |
| Events in quadrant D | 4,018,957 | 477,697 |
| Mode M9 | |||
|---|---|---|---|
| Quadrant | BADHDUFLAG | Total packets | Discarded packets |
| A | 0 | 21 | 0 |
| B | 0 | 21 | 0 |
| C | 0 | 21 | 0 |
| D | 0 | 21 | 0 |
| Mode SS | |||
|---|---|---|---|
| Quadrant | BADHDUFLAG | Total packets | Discarded packets |
| A | 0 | 96 | 0 |
| B | 0 | 96 | 0 |
| C | 0 | 96 | 0 |
| D | 0 | 96 | 0 |
| Mode M0 | |||
|---|---|---|---|
| Quadrant | BADHDUFLAG | Total packets | Discarded packets |
| A | 0 | 10503 | 2 |
| B | 0 | 9674 | 1 |
| C | 0 | 10190 | 1 |
| D | 0 | 15074 | 1 |
| Quadrant | Total seconds | Saturated seconds | Saturation percentage |
|---|---|---|---|
| A | 4714 | 31 | 0.657616% |
| B | 4714 | 4 | 0.084854% |
| C | 4714 | 30 | 0.636402% |
| D | 4714 | 399 | 8.464149% |
Noise dominated data is calculated using 1-second bins in cleaned event files. If a bin has >2000 counts, and if more than 50% of those come from <1% of pixels, then it is considered to be noise-dominated and hence unusable.
| Quadrant | # 1 sec bins | Bins with >0 counts | Bins with >2000 counts | High rate bins dominated by noise | Noise dominated (total time) | Noise dominated (detector-on time) | Marked lightcurve |
|---|---|---|---|---|---|---|---|
| A | 6836 | 4715 | 33 | 33 | 0.48% | 0.70% | 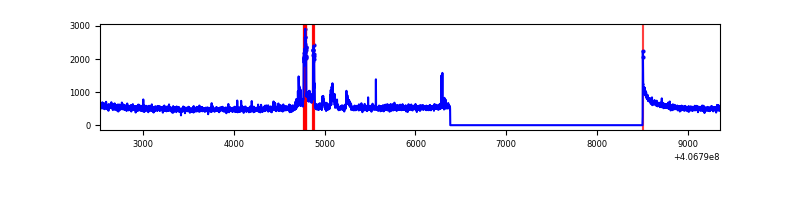 |
| B | 6836 | 4715 | 0 | 0 | 0.00% | 0.00% | 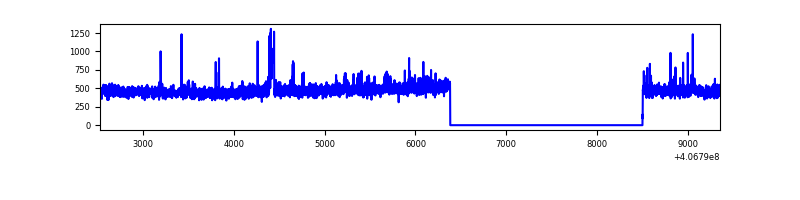 |
| C | 6836 | 4715 | 25 | 25 | 0.37% | 0.53% | 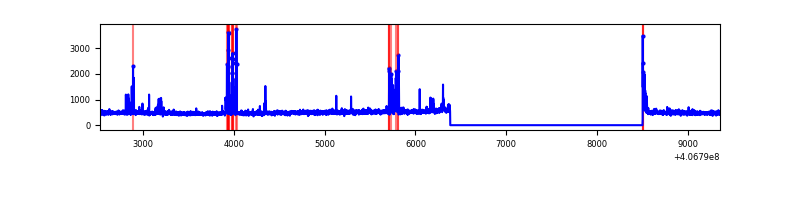 |
| D | 6836 | 4715 | 439 | 439 | 6.42% | 9.31% | 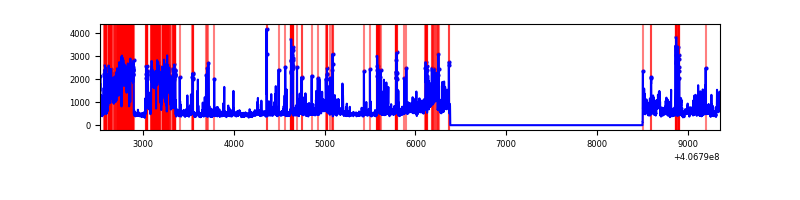 |
Top three noisy pixels from each quadrant. If the there are fewer than three noisy pixels in the level2.evt file, extra rows are filled as -1
| Pixel properties | Quadrant properties | ||||||
|---|---|---|---|---|---|---|---|
| Quadrant | DetID | PixID | Counts | Sigma | Mean | Median | Sigma |
| A | 10 | 83 | 299559 | 2657.08 | 553 | 543 | 112.5 |
| A | 9 | 143 | 172386 | 1527.01 | 553 | 543 | 112.5 |
| A | 13 | 248 | 12338 | 104.81 | 553 | 543 | 112.5 |
| B | 5 | 184 | 34808 | 324.51 | 547 | 532 | 105.6 |
| B | 4 | 251 | 28273 | 262.64 | 547 | 532 | 105.6 |
| B | 12 | 111 | 12913 | 117.22 | 547 | 532 | 105.6 |
| C | 15 | 208 | 202858 | 1626.99 | 534 | 536 | 124.4 |
| C | 15 | 214 | 188241 | 1509.45 | 534 | 536 | 124.4 |
| C | 0 | 10 | 9678 | 73.52 | 534 | 536 | 124.4 |
| D | 13 | 171 | 935843 | 7320.66 | 523 | 509 | 127.8 |
| D | 9 | 49 | 316419 | 2472.56 | 523 | 509 | 127.8 |
| D | 10 | 118 | 164881 | 1286.5 | 523 | 509 | 127.8 |
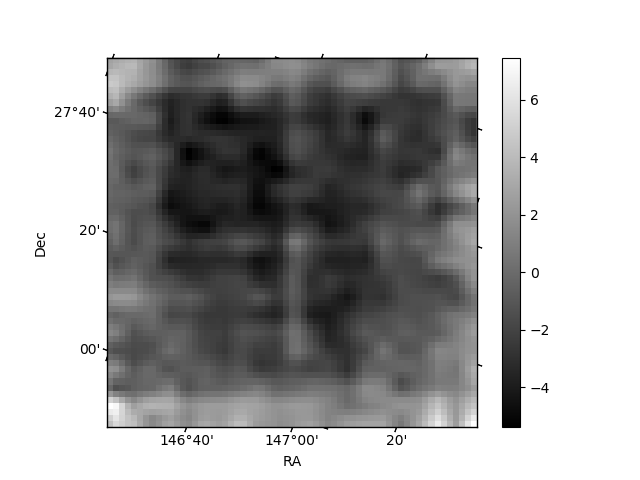
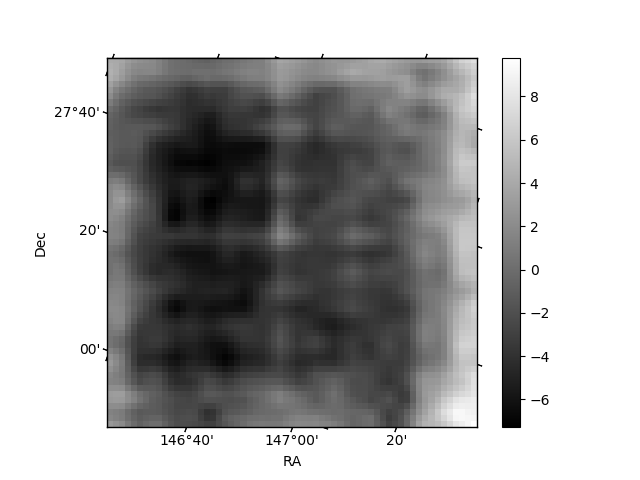
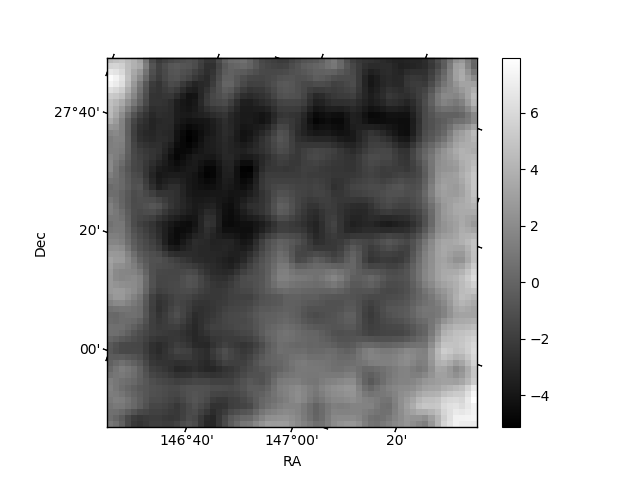
Histogram calculated using DETX and DETY for each event in the final _common_clean file
| Quadrant A | 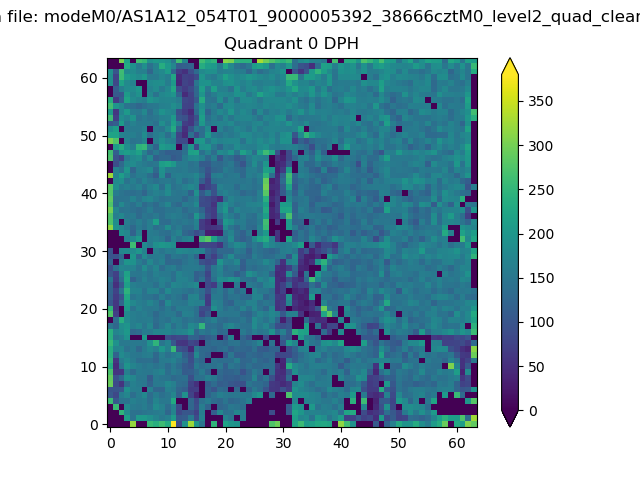 |
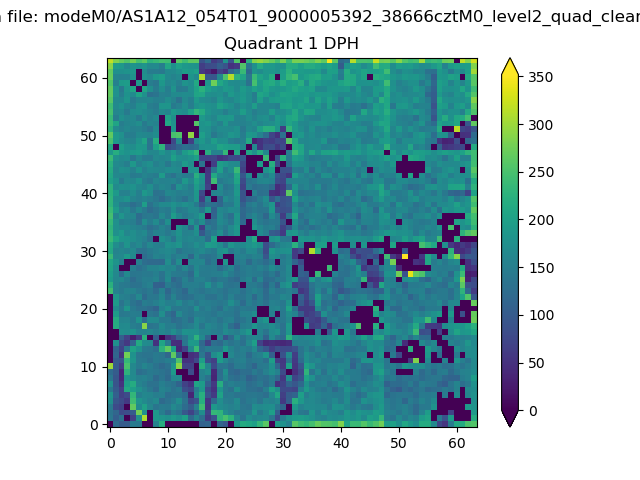 |
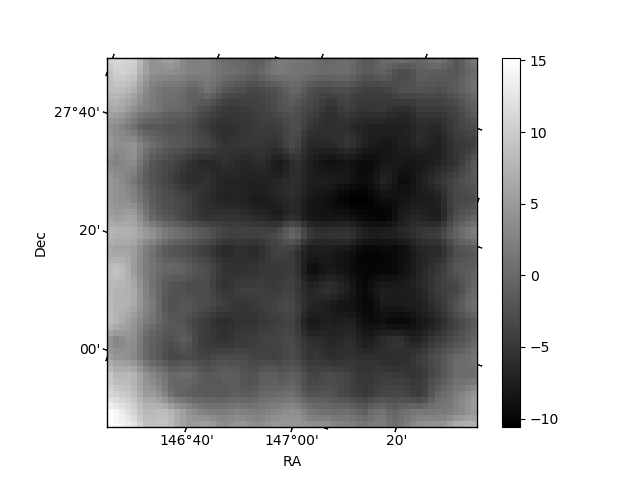
Quadrant B |
|---|---|---|---|
| Quadrant D | 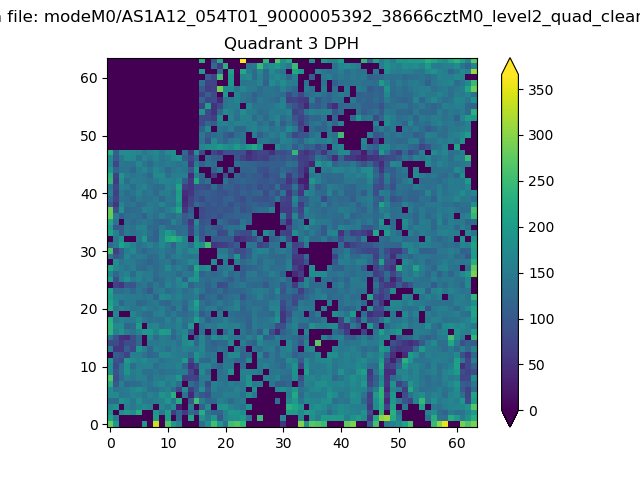 |
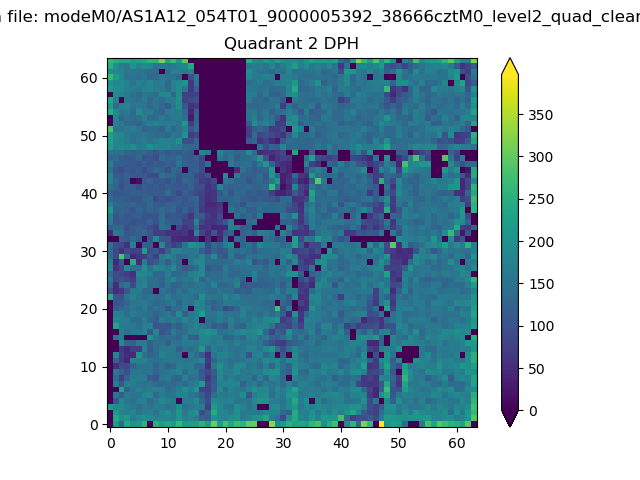 |
Quadrant C |
| Plot type | Count rate plots | Images |
|---|---|---|
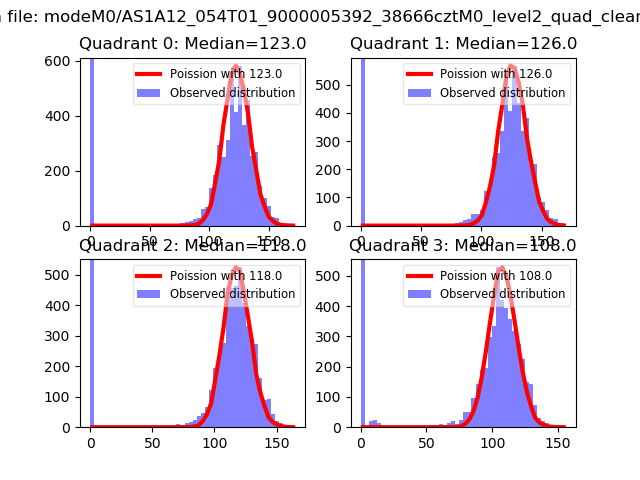
| Comparison with Poisson distribution Blue bars denote a histogram of data divided into 1 sec bins. Red curve is a Poisson curve with rate = median count rate of data. |
 |
 |
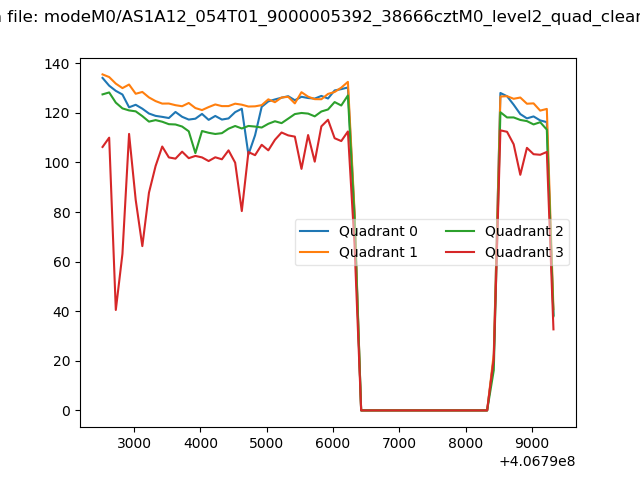
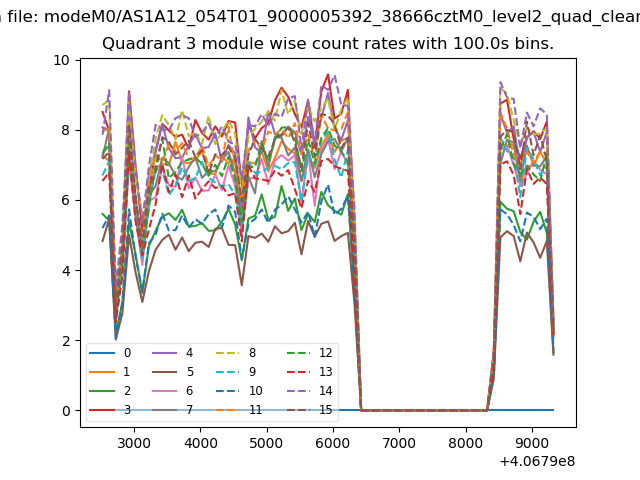
| Quadrant-wise count rates Data is divided into 100 sec bins |
 |
|
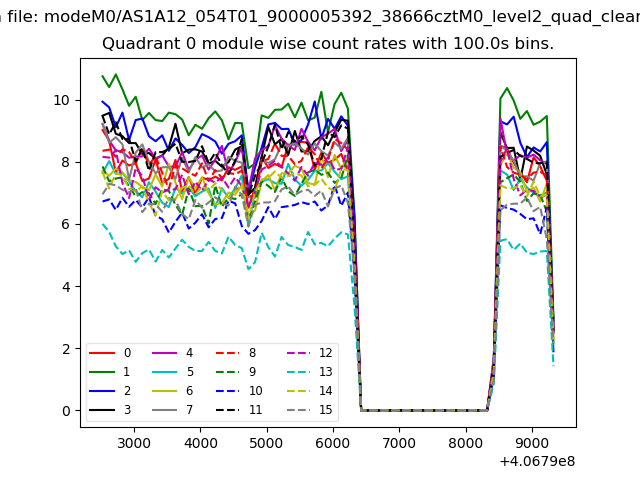
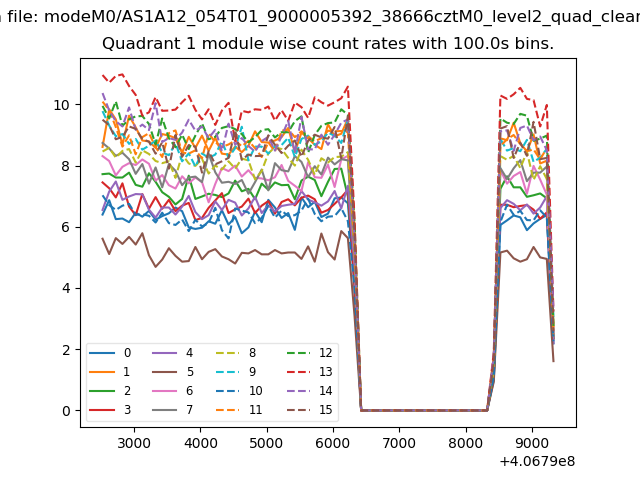
| Module-wise count rates for Quadrant A Data is divided into 100 sec bins |
 |
 |
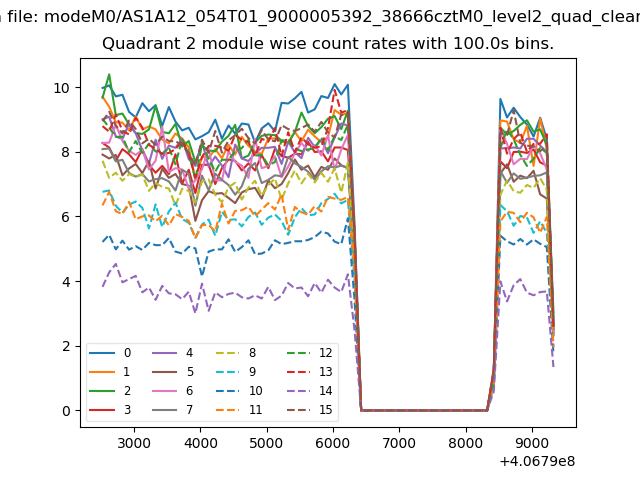
| Module-wise count rates for Quadrant B Data is divided into 100 sec bins |
 |
 |
| Module-wise count rates for Quadrant C Data is divided into 100 sec bins |
 |
 |
| Module-wise count rates for Quadrant D Data is divided into 100 sec bins |
 |
 |
| Parameter | Plot |
|---|---|
| CZT HV Monitor | 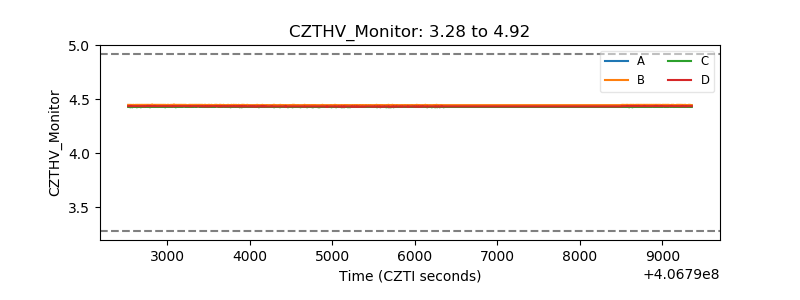 |
| D_VDD | 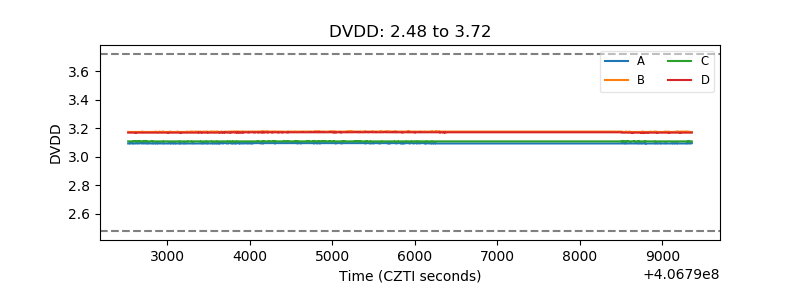 |
| Temperature 1 | 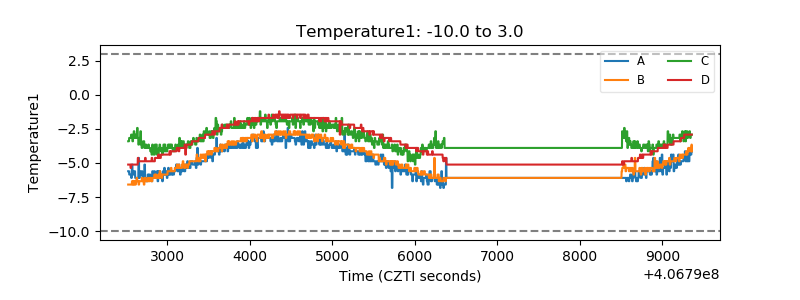 |
| Veto HV Monitor |  |
| Veto LLD | 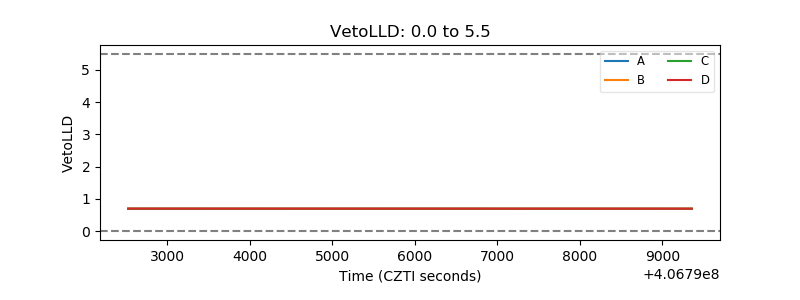 |
| Alpha Counter | 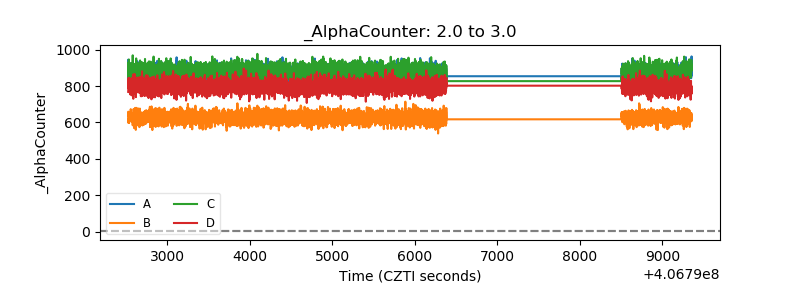 |
| _CPM_Rate | 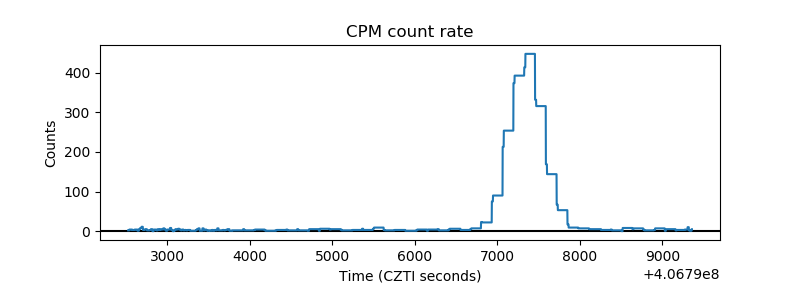 |
| CZT Counter | 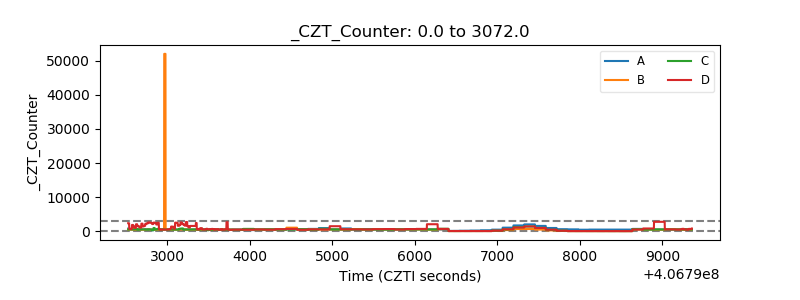 |
| +2.5 Volts monitor | 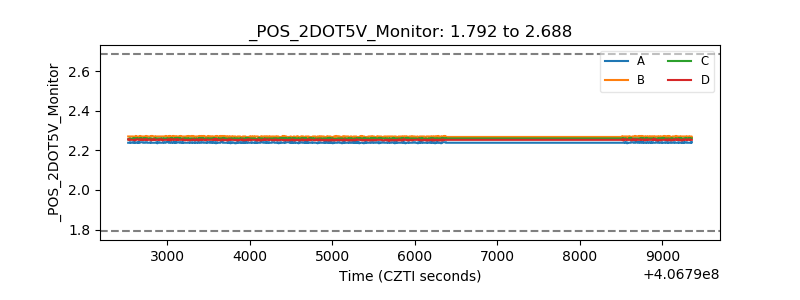 |
| +5 Volts monitor | 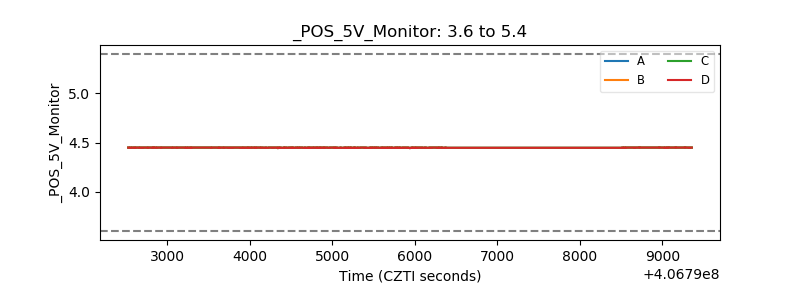 |
| _ROLL_ROT | 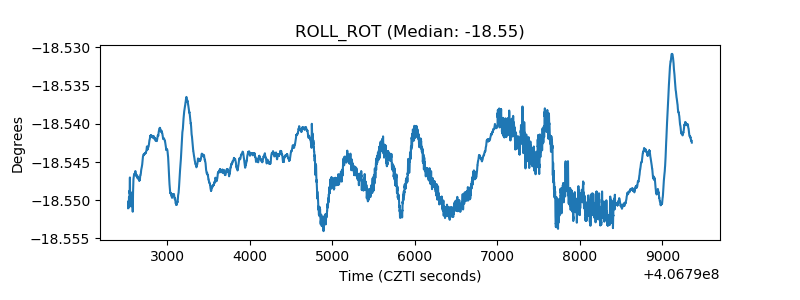 |
| _Roll_DEC | 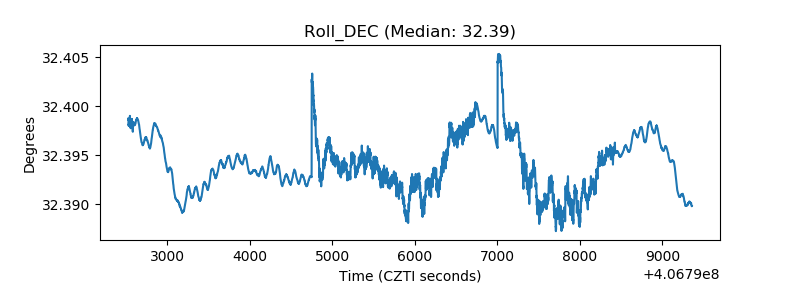 |
| _Roll_RA | 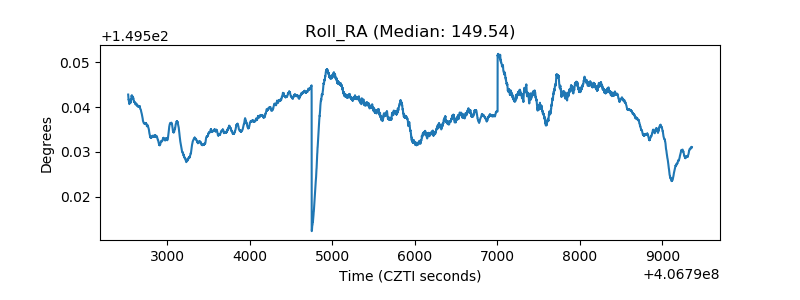 |
| Veto Counter | 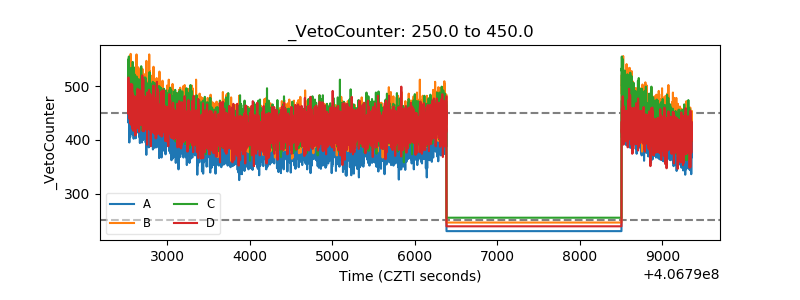 |