| Param | Original file | Final file |
|---|---|---|
| Filename | modeM0/AS1A12_054T01_9000005392_38667cztM0_level2.fits | modeM0/AS1A12_054T01_9000005392_38667cztM0_level2_quad_clean.evt |
| Size (bytes) | 371,638,080 | 86,163,840 |
| Size | 354.4 MB | 82.2 MB |
| Events in quadrant A | 2,881,226 | 596,318 |
| Events in quadrant B | 2,410,360 | 612,141 |
| Events in quadrant C | 2,730,990 | 570,626 |
| Events in quadrant D | 5,338,538 | 473,542 |
| Mode M9 | |||
|---|---|---|---|
| Quadrant | BADHDUFLAG | Total packets | Discarded packets |
| A | 0 | 20 | 0 |
| B | 0 | 20 | 0 |
| C | 0 | 20 | 0 |
| D | 0 | 20 | 0 |
| Mode SS | |||
|---|---|---|---|
| Quadrant | BADHDUFLAG | Total packets | Discarded packets |
| A | 0 | 104 | 0 |
| B | 0 | 104 | 0 |
| C | 0 | 104 | 0 |
| D | 0 | 104 | 0 |
| Mode M0 | |||
|---|---|---|---|
| Quadrant | BADHDUFLAG | Total packets | Discarded packets |
| A | 0 | 11480 | 3 |
| B | 0 | 10448 | 2 |
| C | 0 | 11133 | 2 |
| D | 0 | 19393 | 2 |
| Quadrant | Total seconds | Saturated seconds | Saturation percentage |
|---|---|---|---|
| A | 5082 | 27 | 0.531287% |
| B | 5082 | 12 | 0.236128% |
| C | 5082 | 72 | 1.416765% |
| D | 5083 | 711 | 13.987802% |
Noise dominated data is calculated using 1-second bins in cleaned event files. If a bin has >2000 counts, and if more than 50% of those come from <1% of pixels, then it is considered to be noise-dominated and hence unusable.
| Quadrant | # 1 sec bins | Bins with >0 counts | Bins with >2000 counts | High rate bins dominated by noise | Noise dominated (total time) | Noise dominated (detector-on time) | Marked lightcurve |
|---|---|---|---|---|---|---|---|
| A | 7085 | 5083 | 21 | 21 | 0.30% | 0.41% |  |
| B | 7085 | 5083 | 8 | 8 | 0.11% | 0.16% |  |
| C | 7085 | 5083 | 73 | 73 | 1.03% | 1.44% | 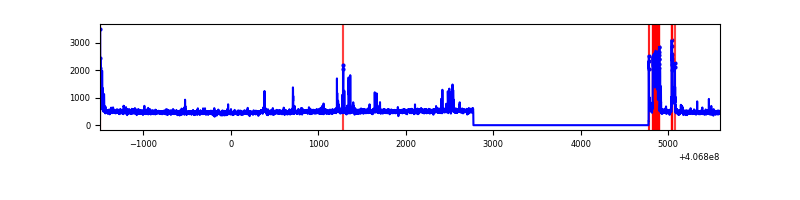 |
| D | 7086 | 5084 | 703 | 703 | 9.92% | 13.83% | 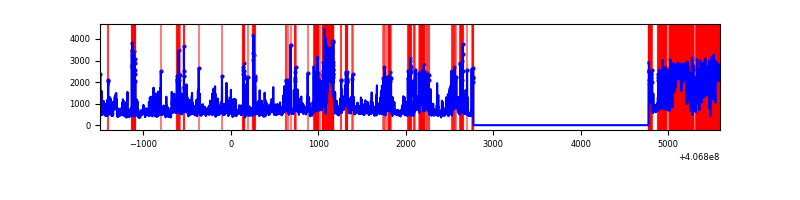 |
Top three noisy pixels from each quadrant. If the there are fewer than three noisy pixels in the level2.evt file, extra rows are filled as -1
| Pixel properties | Quadrant properties | ||||||
|---|---|---|---|---|---|---|---|
| Quadrant | DetID | PixID | Counts | Sigma | Mean | Median | Sigma |
| A | 10 | 83 | 383819 | 3192.75 | 588 | 576 | 120.0 |
| A | 13 | 248 | 207588 | 1724.59 | 588 | 576 | 120.0 |
| A | 9 | 143 | 8842 | 68.86 | 588 | 576 | 120.0 |
| B | 5 | 200 | 32461 | 284.61 | 580 | 565 | 112.1 |
| B | 5 | 184 | 28551 | 249.73 | 580 | 565 | 112.1 |
| B | 5 | 172 | 21701 | 188.6 | 580 | 565 | 112.1 |
| C | 15 | 214 | 206274 | 1564.67 | 565 | 569 | 131.5 |
| C | 15 | 208 | 133353 | 1010.01 | 565 | 569 | 131.5 |
| C | 5 | 250 | 133000 | 1007.32 | 565 | 569 | 131.5 |
| D | 9 | 49 | 1856662 | 14054.47 | 540 | 524 | 132.1 |
| D | 12 | 227 | 442676 | 3347.92 | 540 | 524 | 132.1 |
| D | 10 | 118 | 220594 | 1666.35 | 540 | 524 | 132.1 |
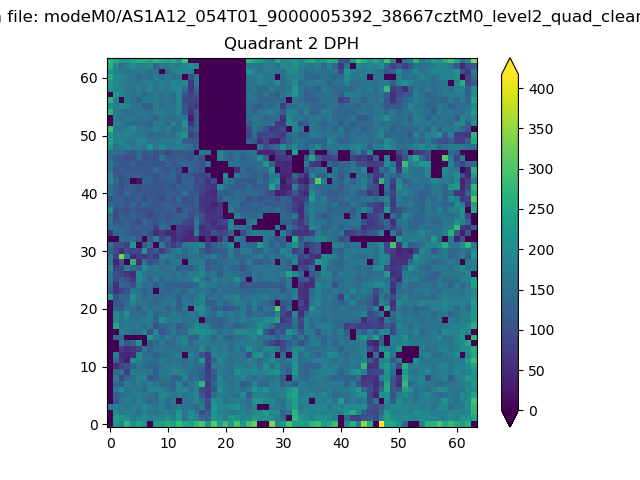
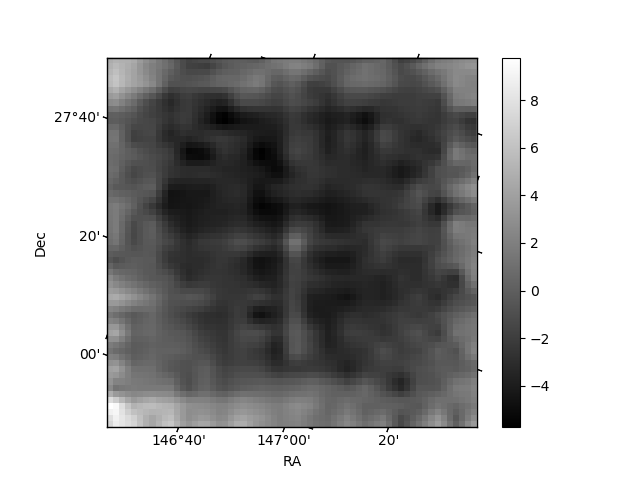
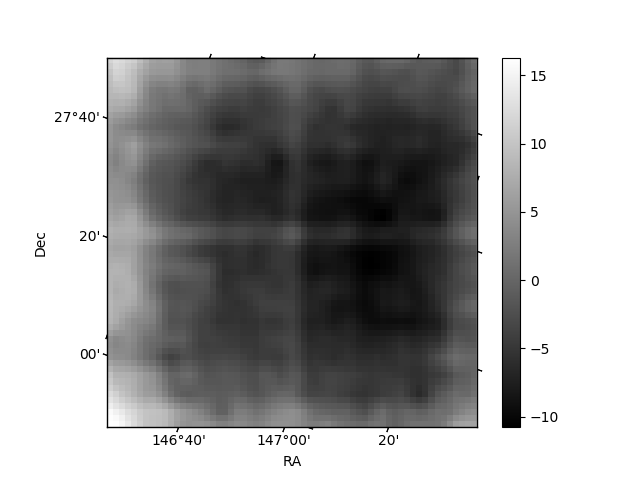
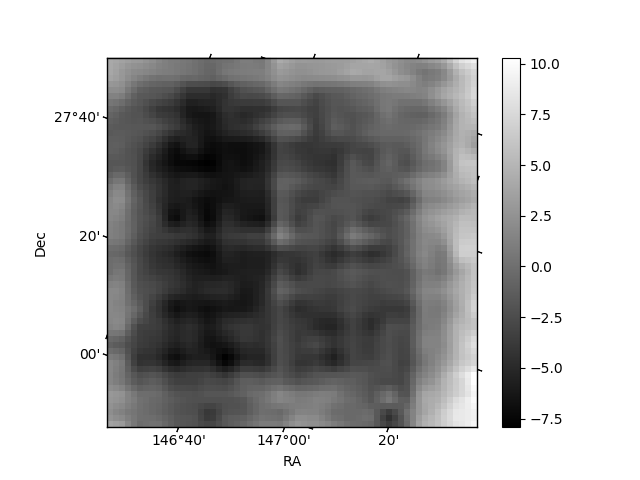
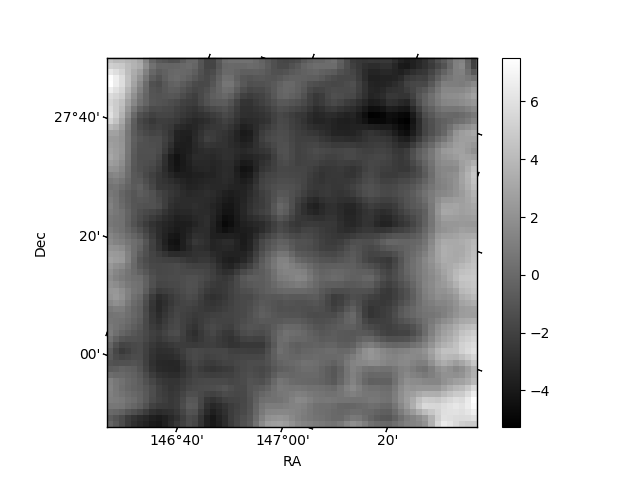
Histogram calculated using DETX and DETY for each event in the final _common_clean file
| Quadrant A | 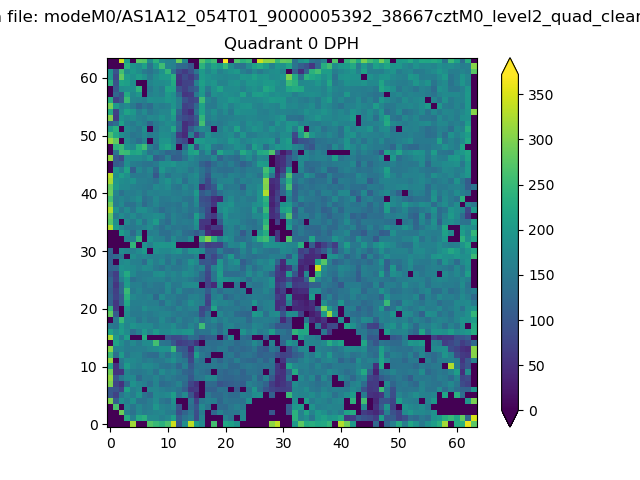 |
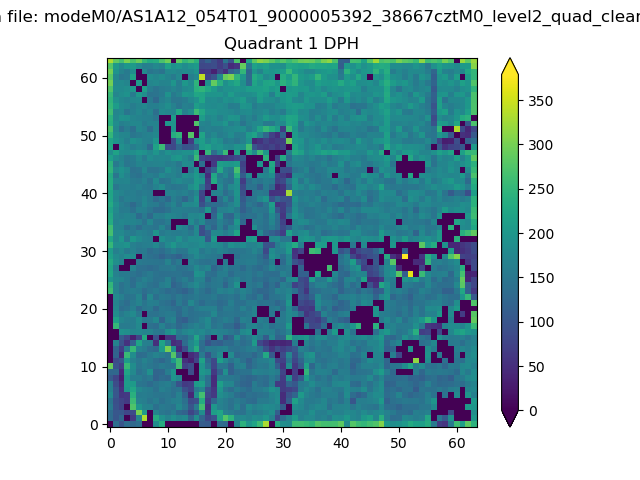 |
Quadrant B |
|---|---|---|---|
| Quadrant D | 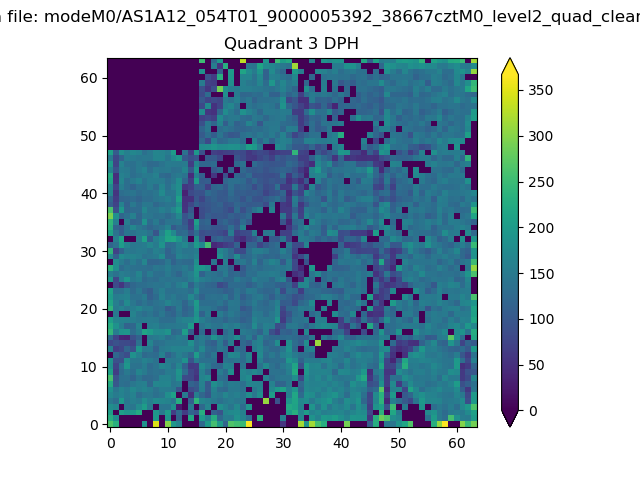 |
 |
Quadrant C |
| Plot type | Count rate plots | Images |
|---|---|---|
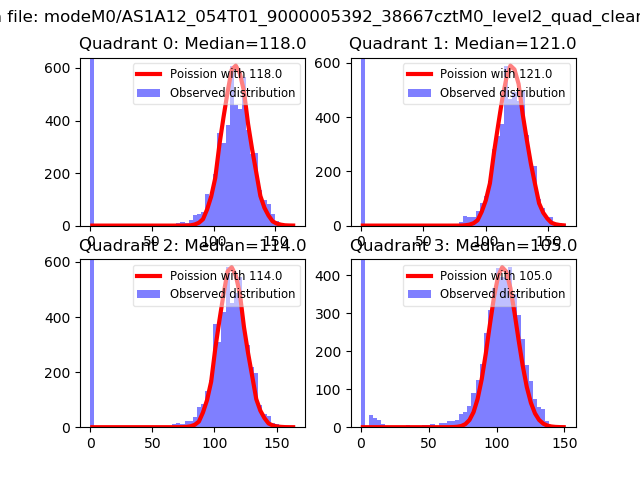
| Comparison with Poisson distribution Blue bars denote a histogram of data divided into 1 sec bins. Red curve is a Poisson curve with rate = median count rate of data. |
 |
 |
| Quadrant-wise count rates Data is divided into 100 sec bins |
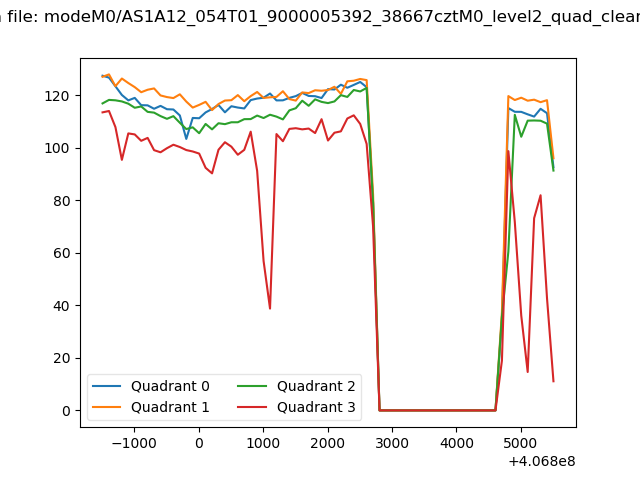 |
|
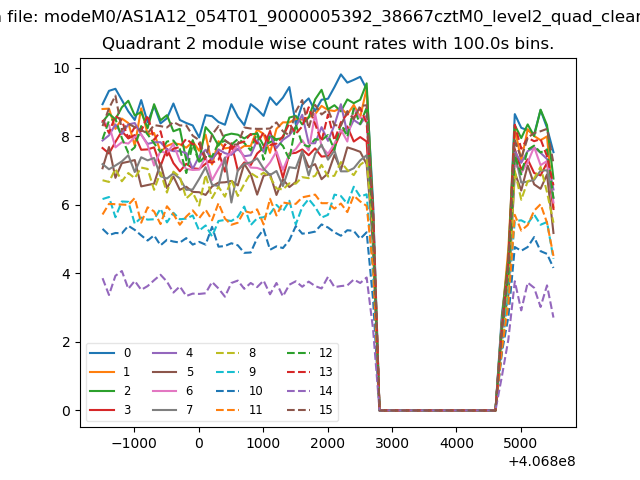
| Module-wise count rates for Quadrant A Data is divided into 100 sec bins |
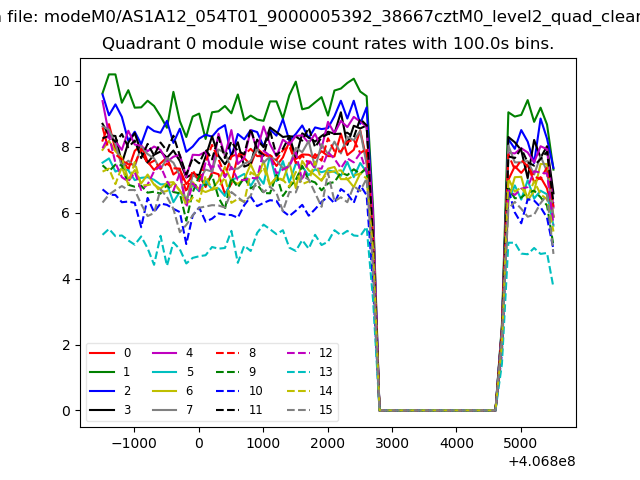 |
 |
| Module-wise count rates for Quadrant B Data is divided into 100 sec bins |
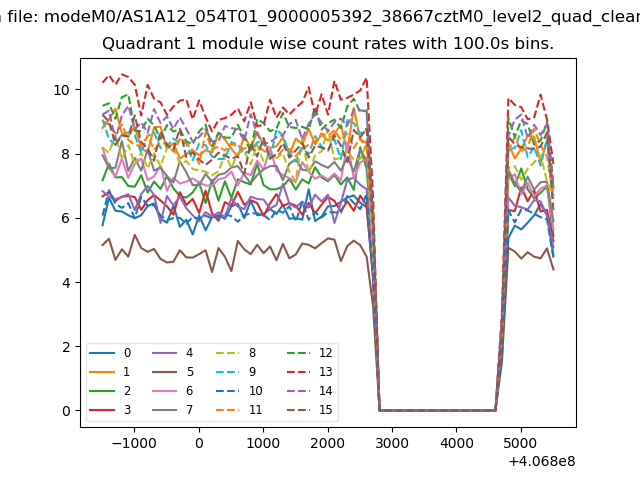 |
 |
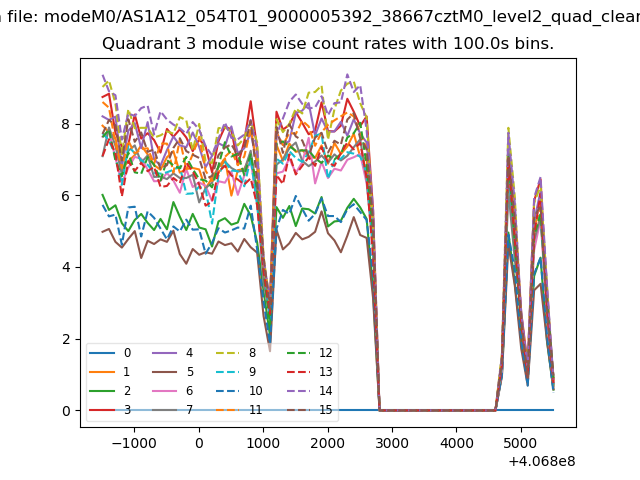
| Module-wise count rates for Quadrant C Data is divided into 100 sec bins |
 |
 |
| Module-wise count rates for Quadrant D Data is divided into 100 sec bins |
 |
 |
| Parameter | Plot |
|---|---|
| CZT HV Monitor | 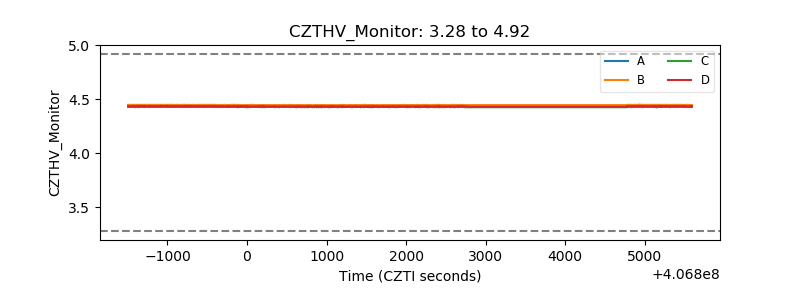 |
| D_VDD | 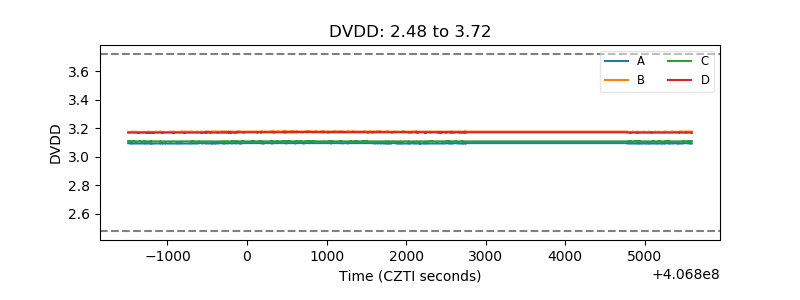 |
| Temperature 1 | 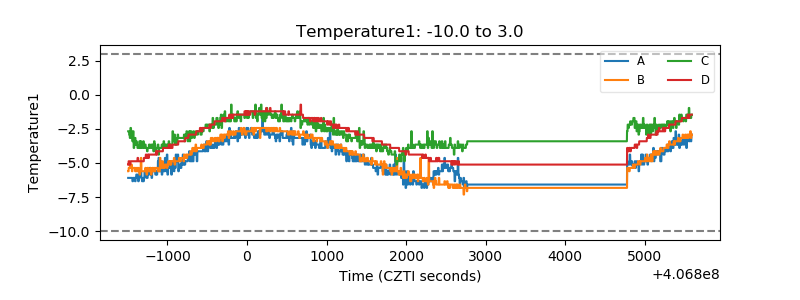 |
| Veto HV Monitor | 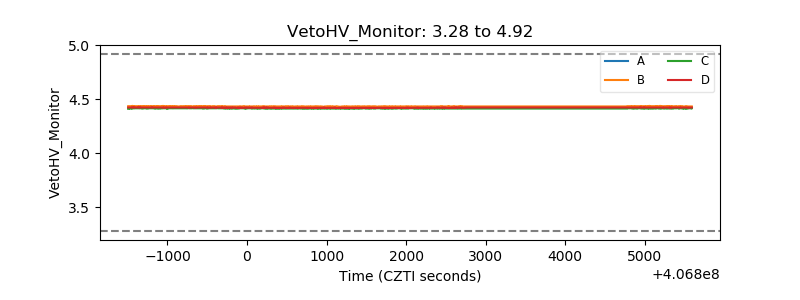 |
| Veto LLD | 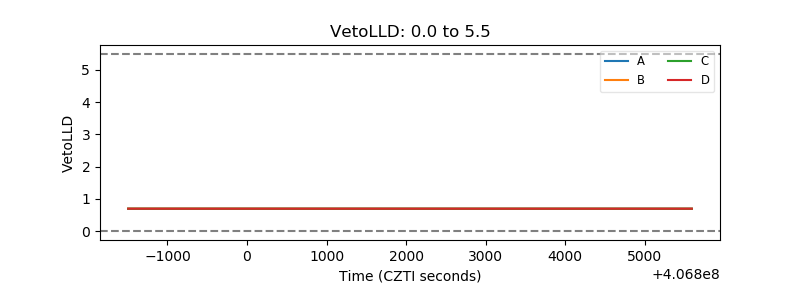 |
| Alpha Counter | 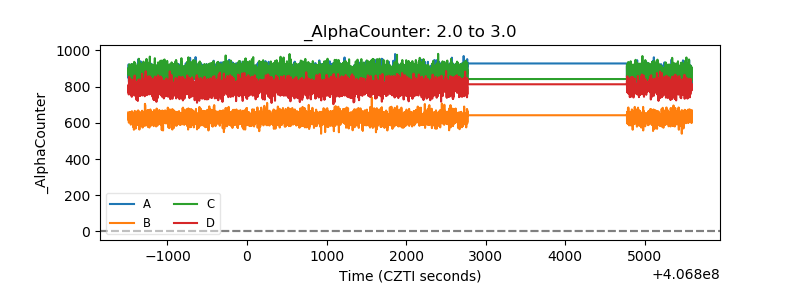 |
| _CPM_Rate | 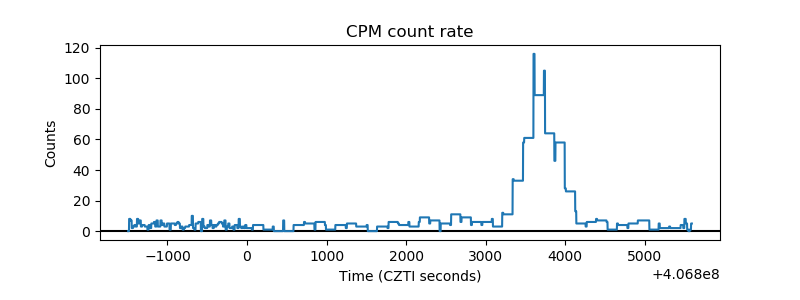 |
| CZT Counter | 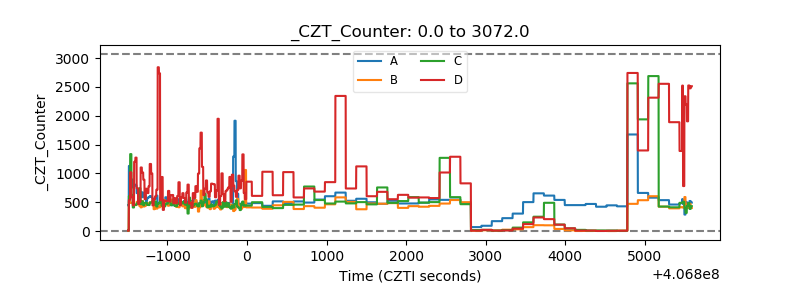 |
| +2.5 Volts monitor | 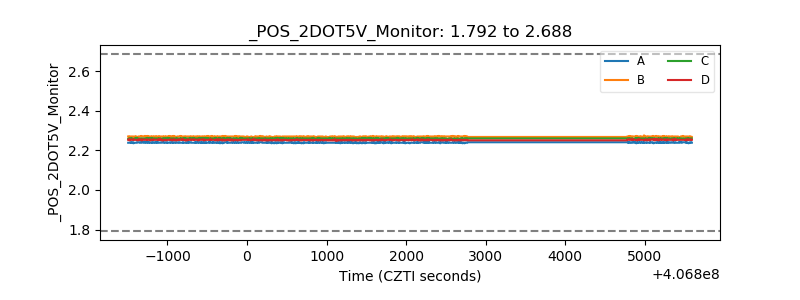 |
| +5 Volts monitor | 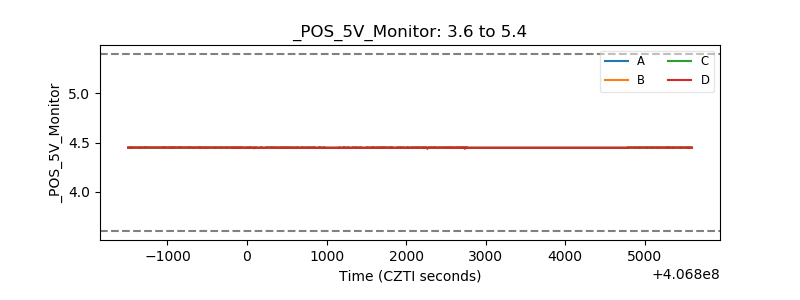 |
| _ROLL_ROT | 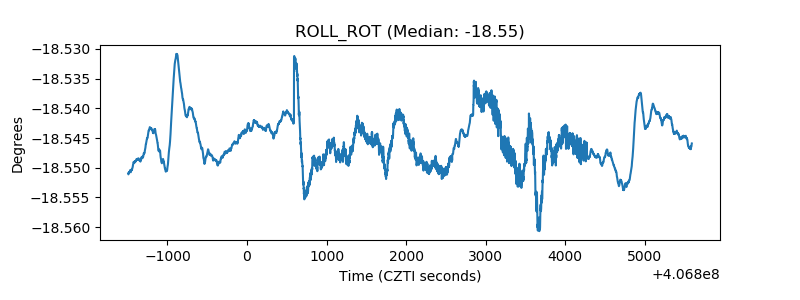 |
| _Roll_DEC | 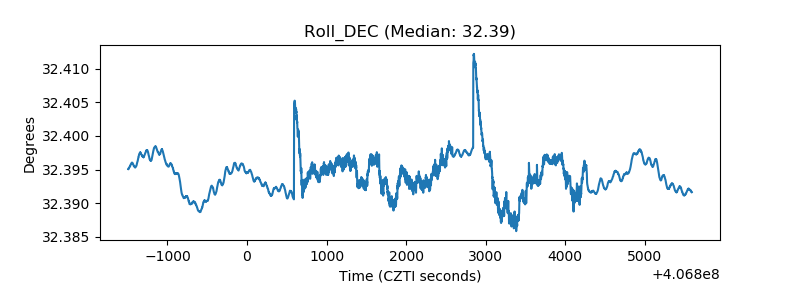 |
| _Roll_RA | 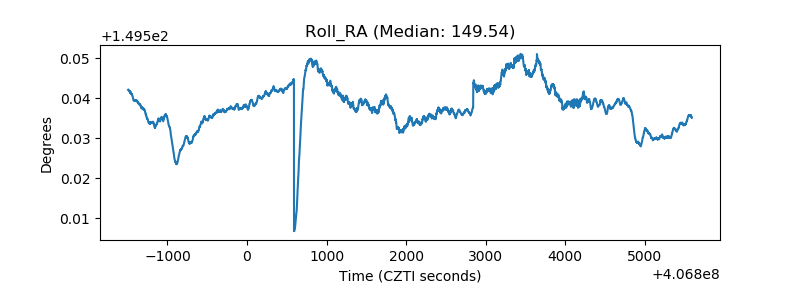 |
| Veto Counter | 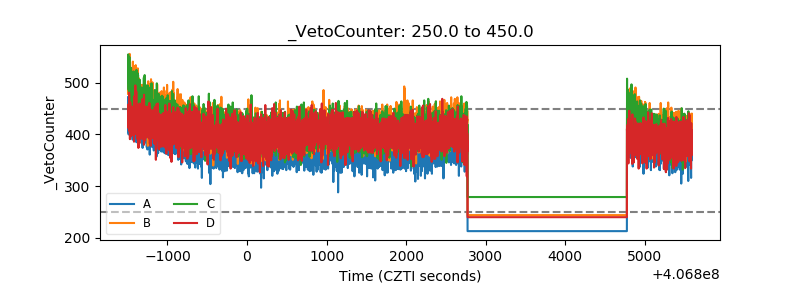 |