| Param | Original file | Final file |
|---|---|---|
| Filename | modeM0/AS1A12_054T01_9000005392_38668cztM0_level2.fits | modeM0/AS1A12_054T01_9000005392_38668cztM0_level2_quad_clean.evt |
| Size (bytes) | 443,183,040 | 86,437,440 |
| Size | 422.7 MB | 82.4 MB |
| Events in quadrant A | 2,869,023 | 622,293 |
| Events in quadrant B | 2,579,256 | 631,557 |
| Events in quadrant C | 2,863,216 | 590,433 |
| Events in quadrant D | 7,670,171 | 391,839 |
| Mode M9 | |||
|---|---|---|---|
| Quadrant | BADHDUFLAG | Total packets | Discarded packets |
| A | 0 | 18 | 0 |
| B | 0 | 18 | 0 |
| C | 0 | 18 | 0 |
| D | 0 | 19 | 0 |
| Mode SS | |||
|---|---|---|---|
| Quadrant | BADHDUFLAG | Total packets | Discarded packets |
| A | 0 | 112 | 0 |
| B | 0 | 112 | 0 |
| C | 0 | 112 | 0 |
| D | 0 | 112 | 0 |
| Mode M0 | |||
|---|---|---|---|
| Quadrant | BADHDUFLAG | Total packets | Discarded packets |
| A | 0 | 11633 | 3 |
| B | 0 | 11255 | 2 |
| C | 0 | 11780 | 2 |
| D | 0 | 26495 | 2 |
| Quadrant | Total seconds | Saturated seconds | Saturation percentage |
|---|---|---|---|
| A | 5441 | 7 | 0.128653% |
| B | 5441 | 19 | 0.349201% |
| C | 5441 | 71 | 1.304907% |
| D | 5441 | 1847 | 33.945966% |
Noise dominated data is calculated using 1-second bins in cleaned event files. If a bin has >2000 counts, and if more than 50% of those come from <1% of pixels, then it is considered to be noise-dominated and hence unusable.
| Quadrant | # 1 sec bins | Bins with >0 counts | Bins with >2000 counts | High rate bins dominated by noise | Noise dominated (total time) | Noise dominated (detector-on time) | Marked lightcurve |
|---|---|---|---|---|---|---|---|
| A | 7144 | 5442 | 3 | 3 | 0.04% | 0.06% | 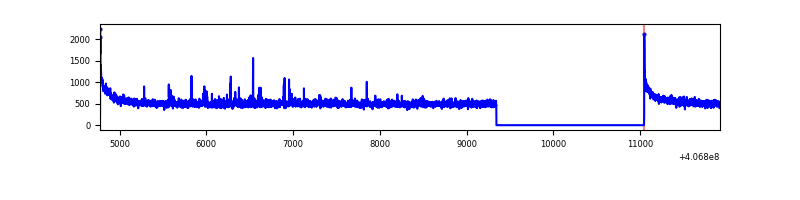 |
| B | 7144 | 5442 | 7 | 7 | 0.10% | 0.13% | 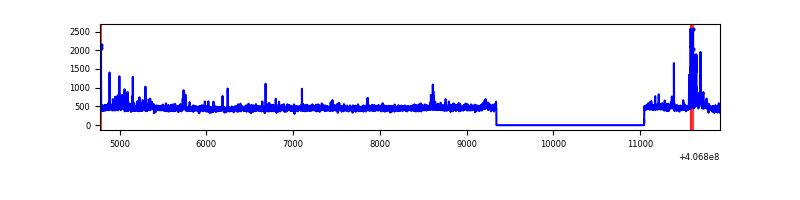 |
| C | 7144 | 5442 | 71 | 71 | 0.99% | 1.30% | 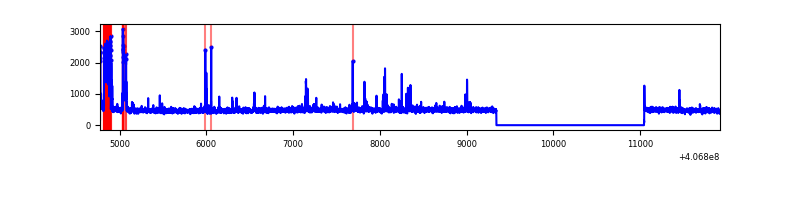 |
| D | 7144 | 5442 | 1865 | 1865 | 26.11% | 34.27% | 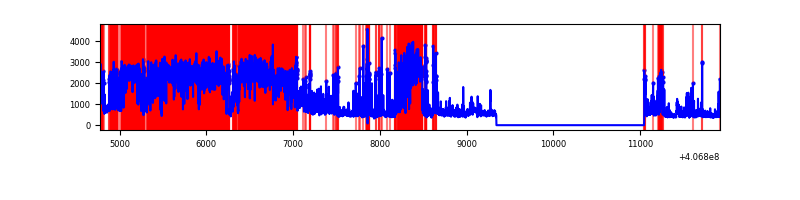 |
Top three noisy pixels from each quadrant. If the there are fewer than three noisy pixels in the level2.evt file, extra rows are filled as -1
| Pixel properties | Quadrant properties | ||||||
|---|---|---|---|---|---|---|---|
| Quadrant | DetID | PixID | Counts | Sigma | Mean | Median | Sigma |
| A | 10 | 83 | 409386 | 3237.56 | 618 | 605 | 126.3 |
| A | 13 | 248 | 45659 | 356.83 | 618 | 605 | 126.3 |
| A | 9 | 143 | 10450 | 77.97 | 618 | 605 | 126.3 |
| B | 0 | 189 | 90701 | 758.18 | 611 | 595 | 118.8 |
| B | 5 | 200 | 43151 | 358.08 | 611 | 595 | 118.8 |
| B | 12 | 111 | 14995 | 121.17 | 611 | 595 | 118.8 |
| C | 15 | 214 | 221393 | 1573.81 | 598 | 601 | 140.3 |
| C | 5 | 250 | 135389 | 960.77 | 598 | 601 | 140.3 |
| C | 15 | 208 | 112872 | 800.27 | 598 | 601 | 140.3 |
| D | 9 | 49 | 3669364 | 27934.7 | 525 | 509 | 131.3 |
| D | 12 | 227 | 830116 | 6316.64 | 525 | 509 | 131.3 |
| D | 5 | 222 | 337268 | 2564.09 | 525 | 509 | 131.3 |
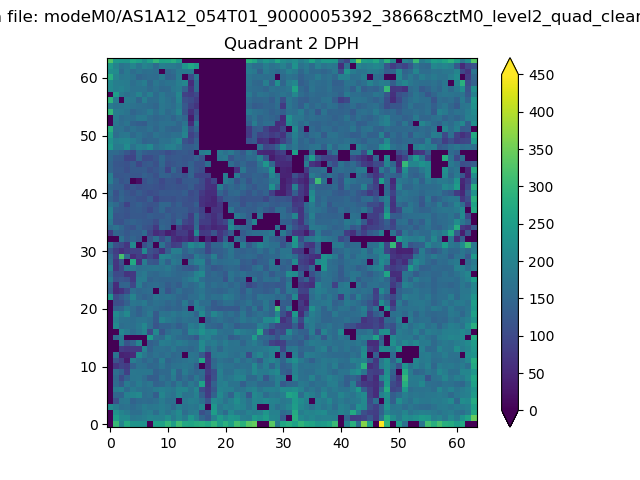
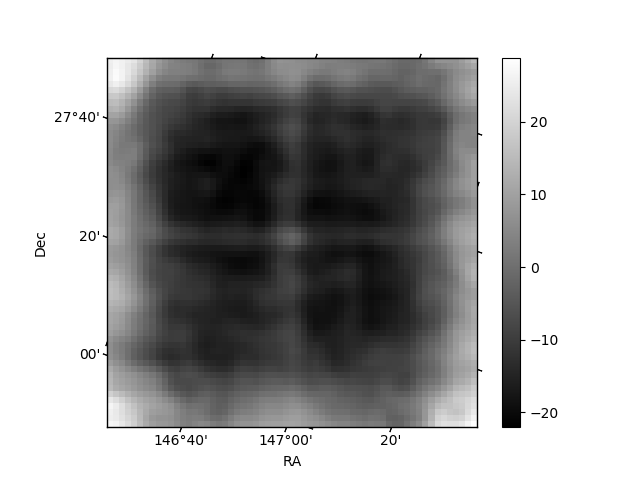
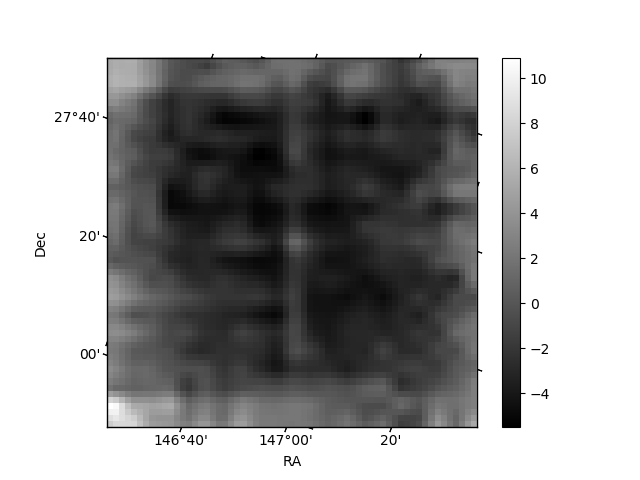
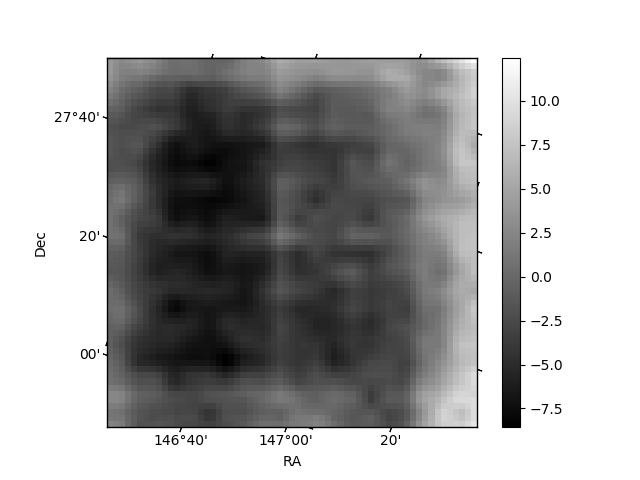
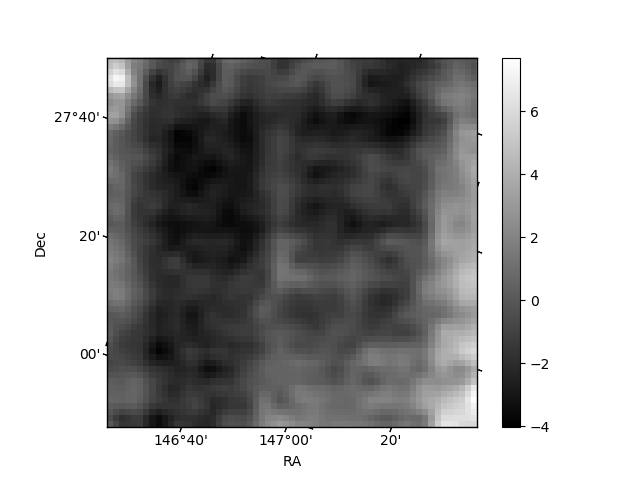
Histogram calculated using DETX and DETY for each event in the final _common_clean file
| Quadrant A | 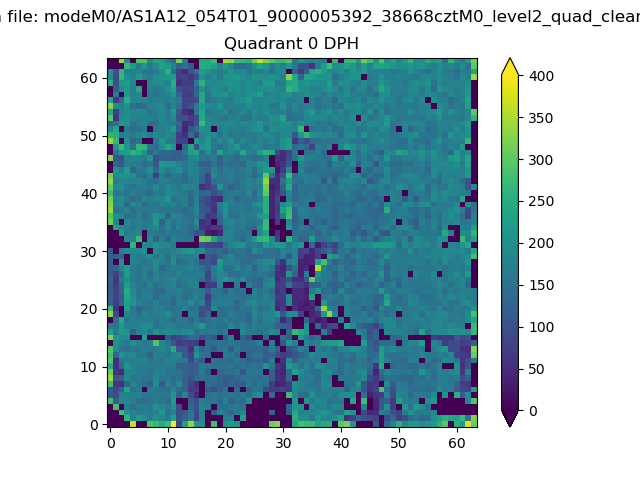 |
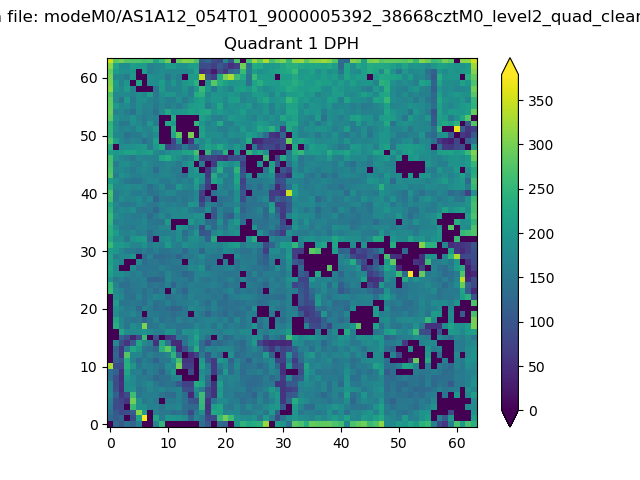 |
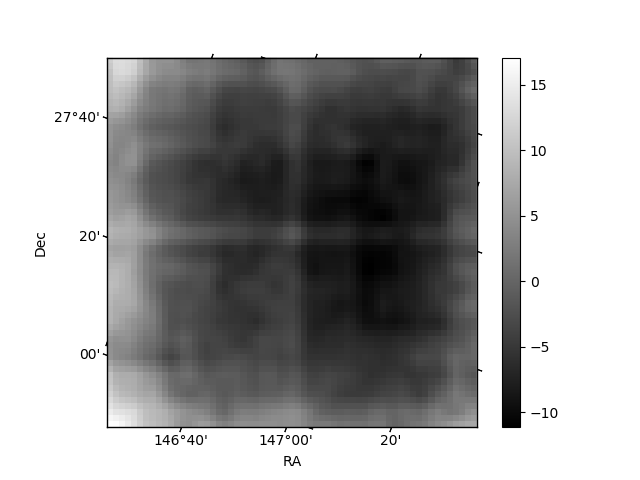
Quadrant B |
|---|---|---|---|
| Quadrant D | 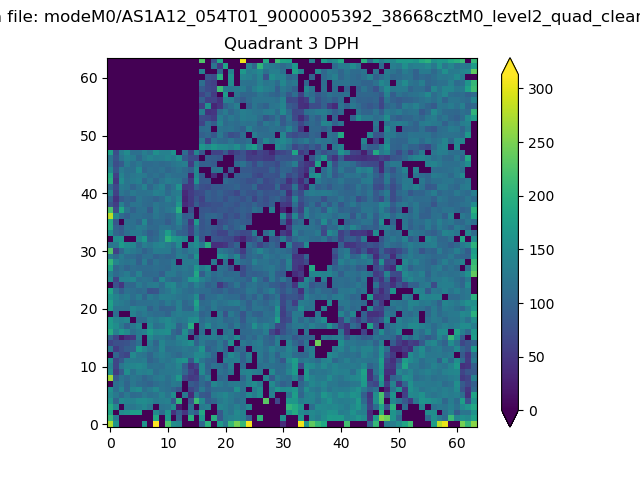 |
 |
Quadrant C |
| Plot type | Count rate plots | Images |
|---|---|---|
| Comparison with Poisson distribution Blue bars denote a histogram of data divided into 1 sec bins. Red curve is a Poisson curve with rate = median count rate of data. |
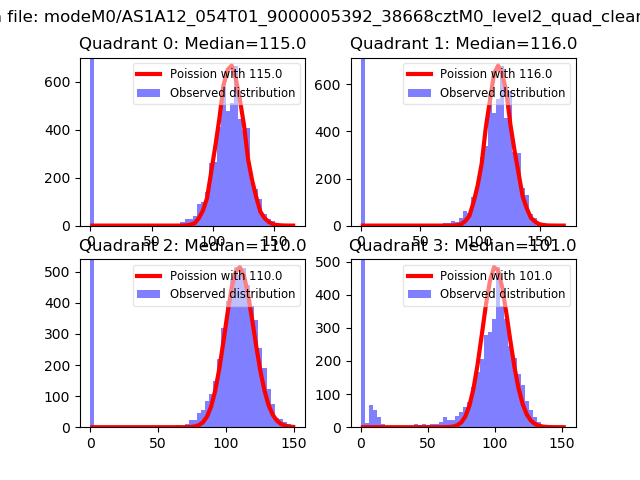 |
 |
| Quadrant-wise count rates Data is divided into 100 sec bins |
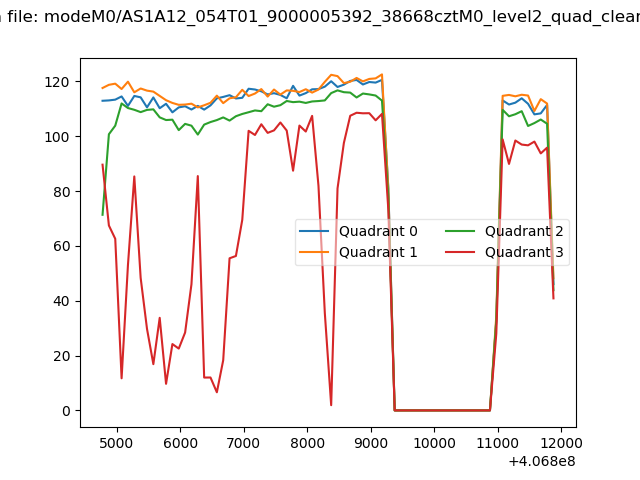 |
|
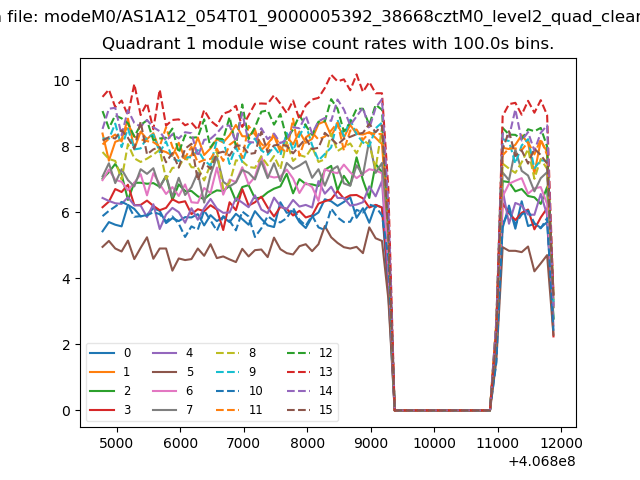
| Module-wise count rates for Quadrant A Data is divided into 100 sec bins |
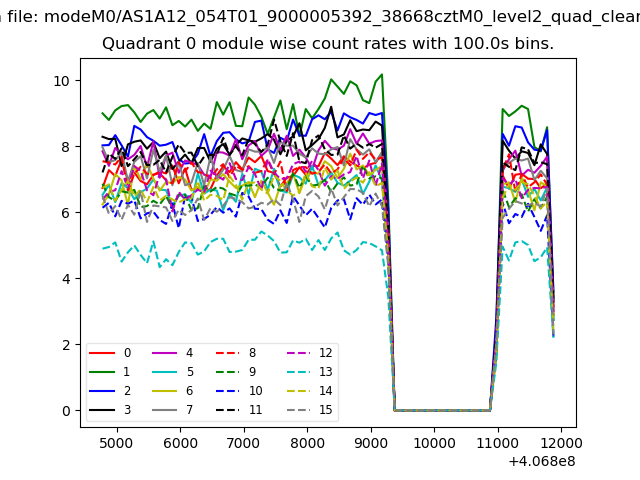 |
 |
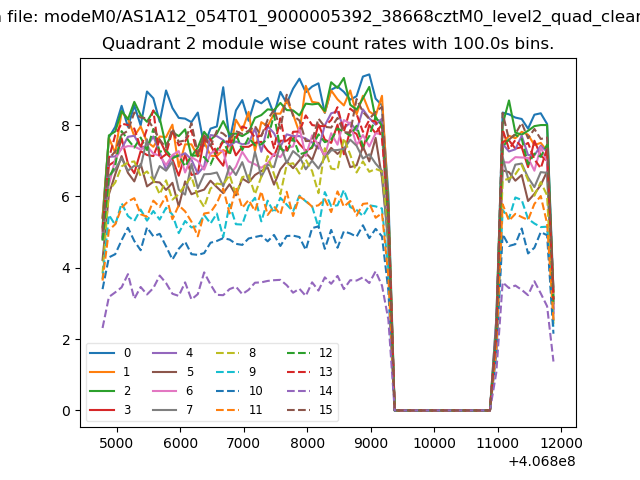
| Module-wise count rates for Quadrant B Data is divided into 100 sec bins |
 |
 |
| Module-wise count rates for Quadrant C Data is divided into 100 sec bins |
 |
 |
| Module-wise count rates for Quadrant D Data is divided into 100 sec bins |
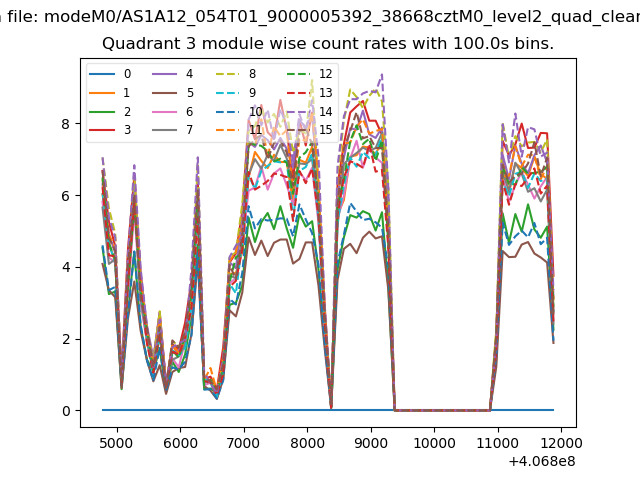 |
 |
| Parameter | Plot |
|---|---|
| CZT HV Monitor | 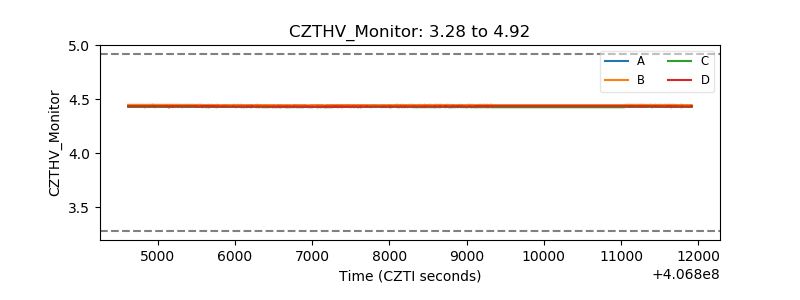 |
| D_VDD | 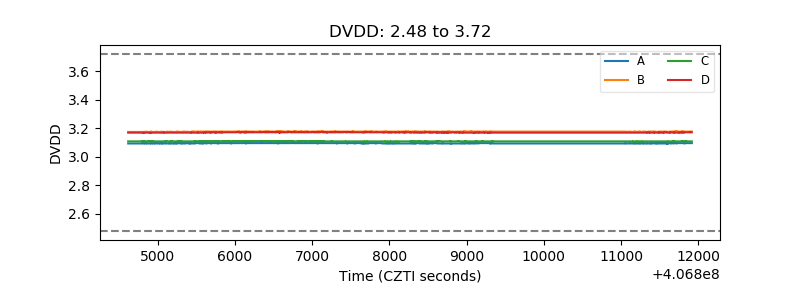 |
| Temperature 1 | 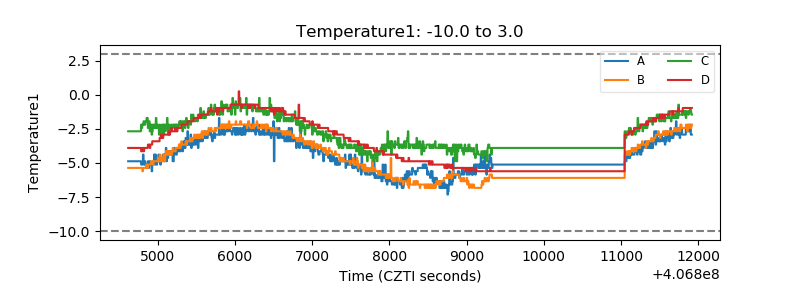 |
| Veto HV Monitor |  |
| Veto LLD | 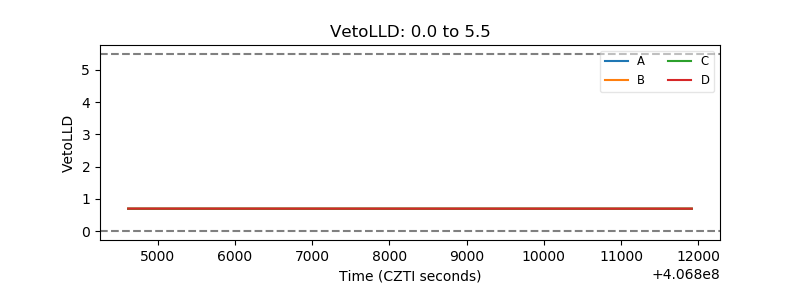 |
| Alpha Counter | 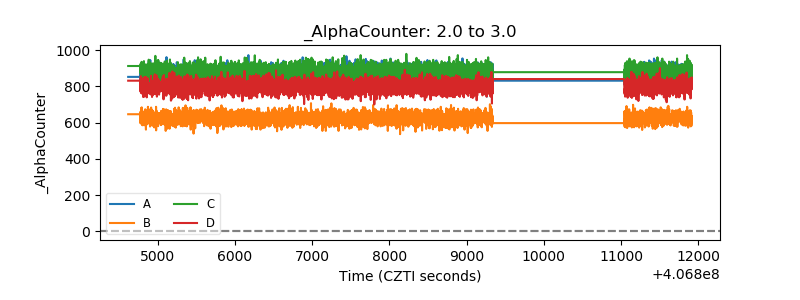 |
| _CPM_Rate | 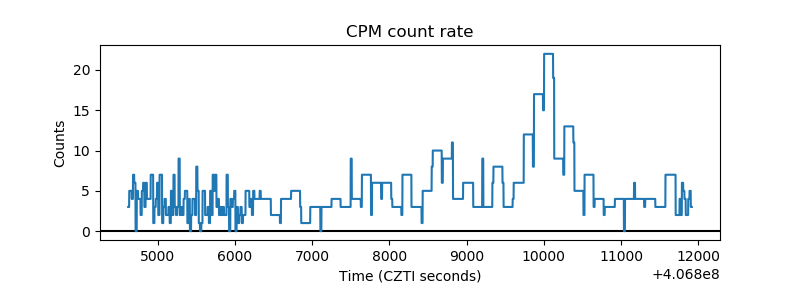 |
| CZT Counter | 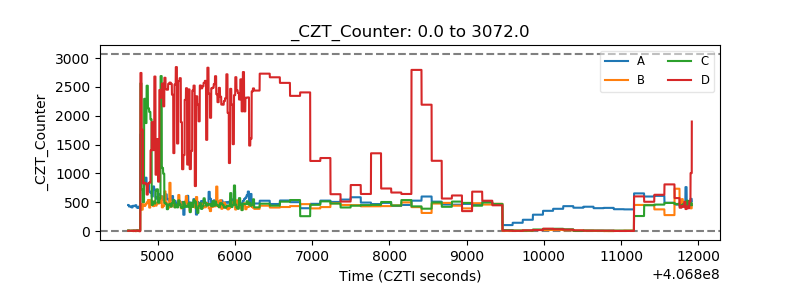 |
| +2.5 Volts monitor | 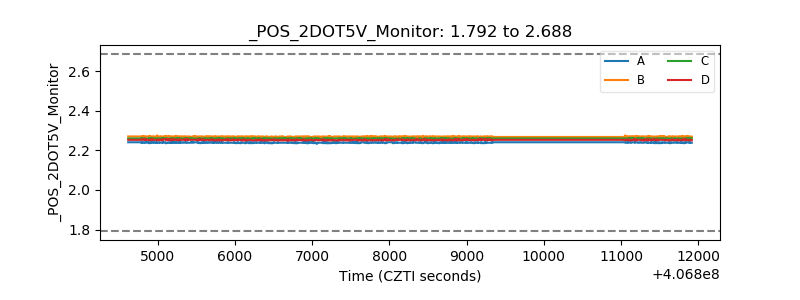 |
| +5 Volts monitor | 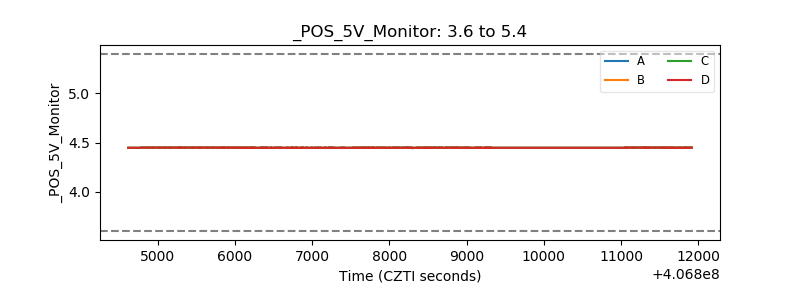 |
| _ROLL_ROT | 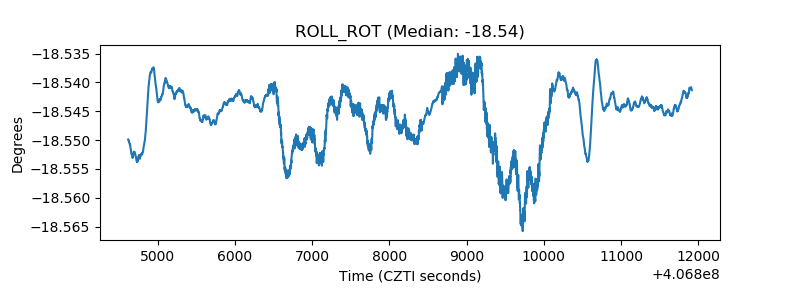 |
| _Roll_DEC | 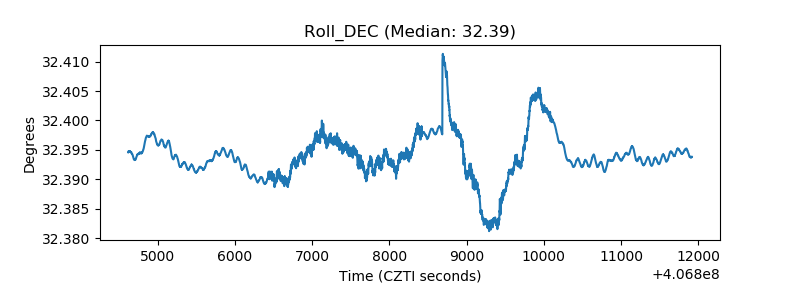 |
| _Roll_RA | 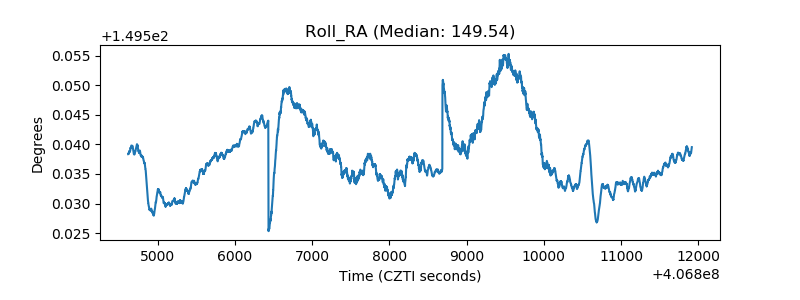 |
| Veto Counter | 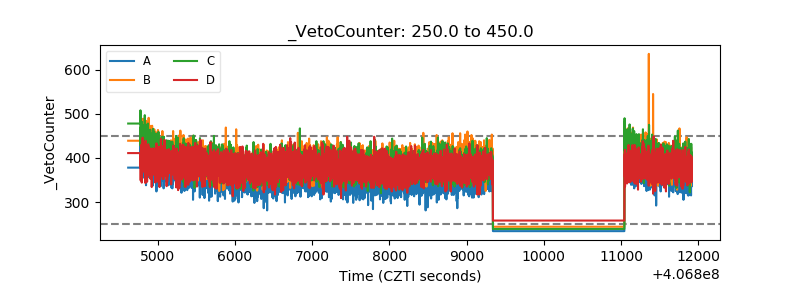 |