| Param | Original file | Final file |
|---|---|---|
| Filename | modeM0/AS1A12_054T01_9000005392_38670cztM0_level2.fits | modeM0/AS1A12_054T01_9000005392_38670cztM0_level2_quad_clean.evt |
| Size (bytes) | 390,744,000 | 96,318,720 |
| Size | 372.6 MB | 91.9 MB |
| Events in quadrant A | 3,186,754 | 662,886 |
| Events in quadrant B | 2,945,204 | 668,126 |
| Events in quadrant C | 3,101,981 | 632,069 |
| Events in quadrant D | 4,771,610 | 541,687 |
| Mode M9 | |||
|---|---|---|---|
| Quadrant | BADHDUFLAG | Total packets | Discarded packets |
| A | 0 | 23 | 0 |
| B | 0 | 23 | 0 |
| C | 0 | 23 | 0 |
| D | 0 | 24 | 0 |
| Mode SS | |||
|---|---|---|---|
| Quadrant | BADHDUFLAG | Total packets | Discarded packets |
| A | 0 | 120 | 0 |
| B | 0 | 120 | 0 |
| C | 0 | 120 | 0 |
| D | 0 | 120 | 0 |
| Mode M0 | |||
|---|---|---|---|
| Quadrant | BADHDUFLAG | Total packets | Discarded packets |
| A | 0 | 13017 | 3 |
| B | 0 | 12677 | 2 |
| C | 0 | 12814 | 2 |
| D | 0 | 18197 | 2 |
| Quadrant | Total seconds | Saturated seconds | Saturation percentage |
|---|---|---|---|
| A | 5891 | 49 | 0.831777% |
| B | 5891 | 59 | 1.001528% |
| C | 5891 | 52 | 0.882702% |
| D | 5891 | 622 | 10.558479% |
Noise dominated data is calculated using 1-second bins in cleaned event files. If a bin has >2000 counts, and if more than 50% of those come from <1% of pixels, then it is considered to be noise-dominated and hence unusable.
| Quadrant | # 1 sec bins | Bins with >0 counts | Bins with >2000 counts | High rate bins dominated by noise | Noise dominated (total time) | Noise dominated (detector-on time) | Marked lightcurve |
|---|---|---|---|---|---|---|---|
| A | 7173 | 5892 | 36 | 36 | 0.50% | 0.61% | 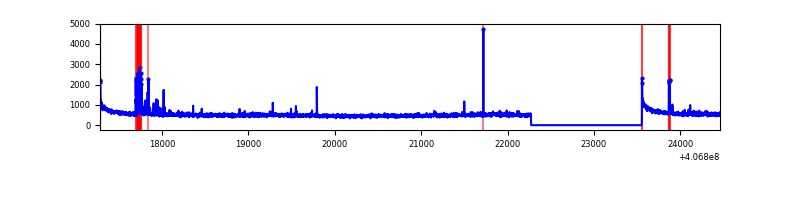 |
| B | 7173 | 5892 | 37 | 37 | 0.52% | 0.63% | 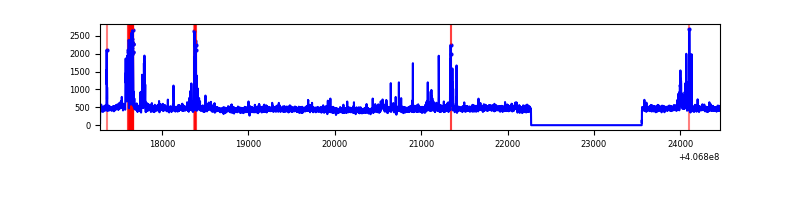 |
| C | 7173 | 5892 | 36 | 36 | 0.50% | 0.61% | 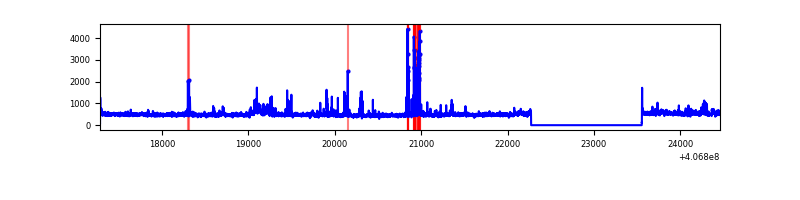 |
| D | 7173 | 5892 | 540 | 540 | 7.53% | 9.16% | 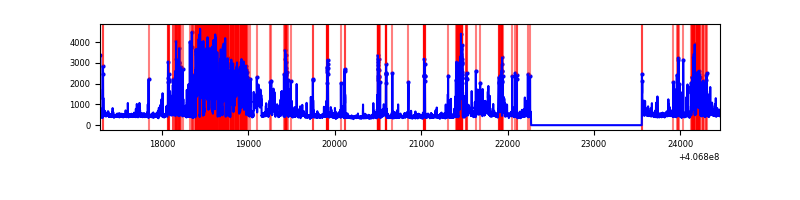 |
Top three noisy pixels from each quadrant. If the there are fewer than three noisy pixels in the level2.evt file, extra rows are filled as -1
| Pixel properties | Quadrant properties | ||||||
|---|---|---|---|---|---|---|---|
| Quadrant | DetID | PixID | Counts | Sigma | Mean | Median | Sigma |
| A | 10 | 83 | 436414 | 3184.02 | 667 | 652 | 136.9 |
| A | 13 | 248 | 125976 | 915.72 | 667 | 652 | 136.9 |
| A | 9 | 143 | 22718 | 161.23 | 667 | 652 | 136.9 |
| B | 5 | 200 | 208783 | 1617.13 | 658 | 640 | 128.7 |
| B | 4 | 170 | 53304 | 409.16 | 658 | 640 | 128.7 |
| B | 15 | 85 | 42283 | 323.54 | 658 | 640 | 128.7 |
| C | 14 | 254 | 275174 | 1801.59 | 645 | 648 | 152.4 |
| C | 15 | 214 | 237380 | 1553.57 | 645 | 648 | 152.4 |
| C | 2 | 16 | 57707 | 374.45 | 645 | 648 | 152.4 |
| D | 12 | 227 | 1638758 | 10736.71 | 616 | 597 | 152.6 |
| D | 10 | 118 | 346616 | 2267.85 | 616 | 597 | 152.6 |
| D | 13 | 249 | 126461 | 824.93 | 616 | 597 | 152.6 |
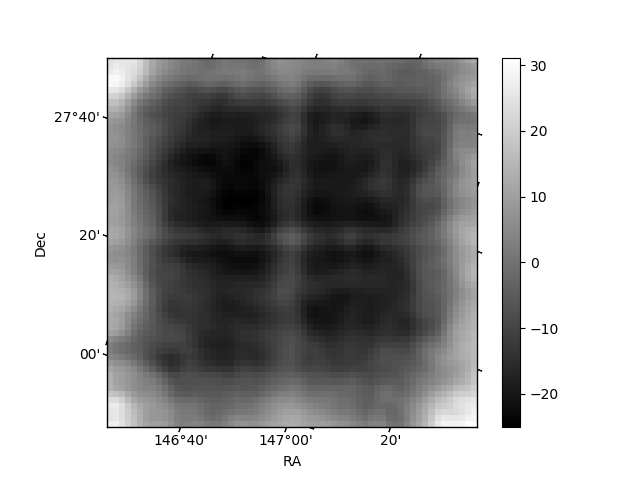
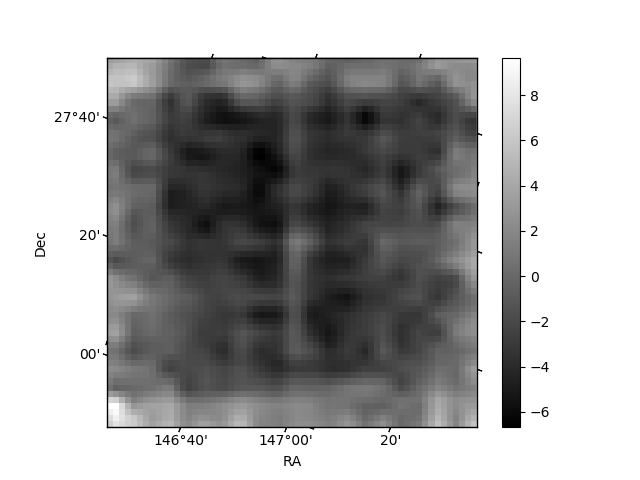
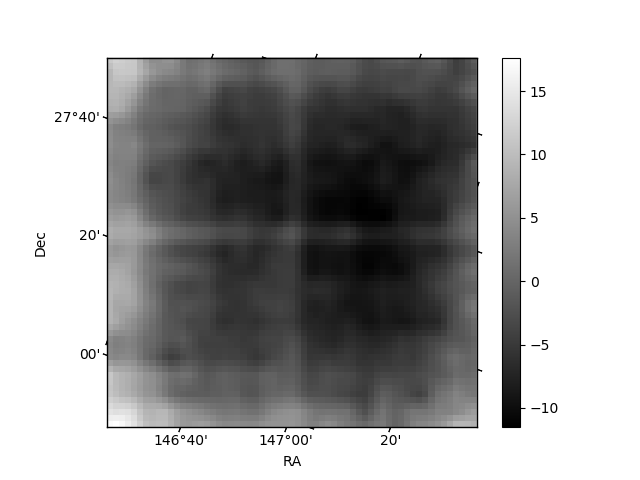
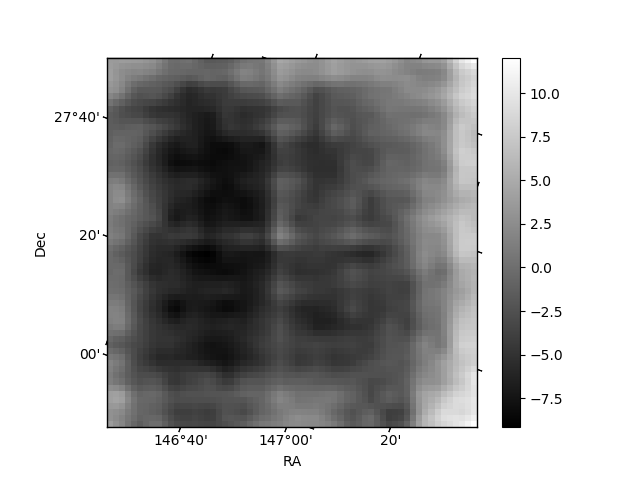
Histogram calculated using DETX and DETY for each event in the final _common_clean file
| Quadrant A | 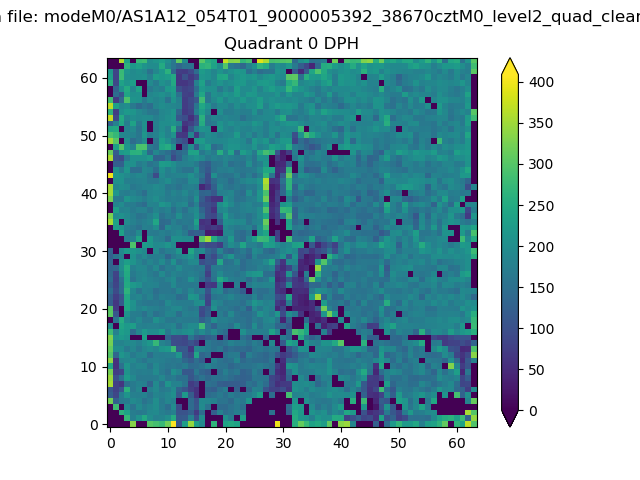 |
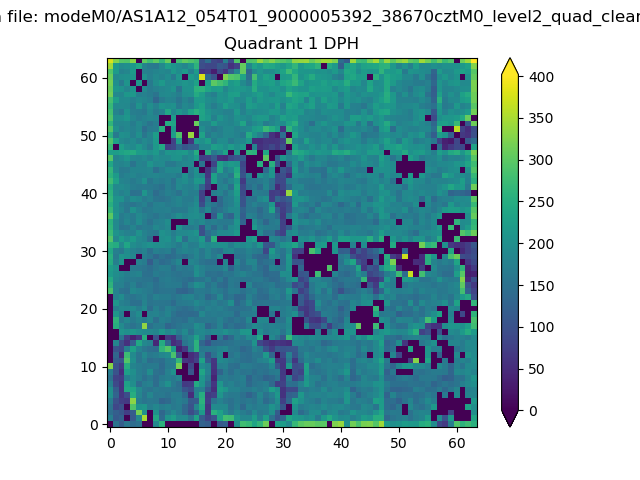 |
Quadrant B |
|---|---|---|---|
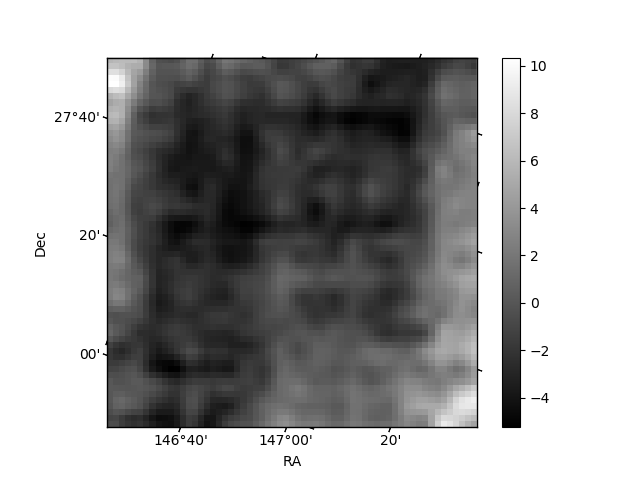
| Quadrant D | 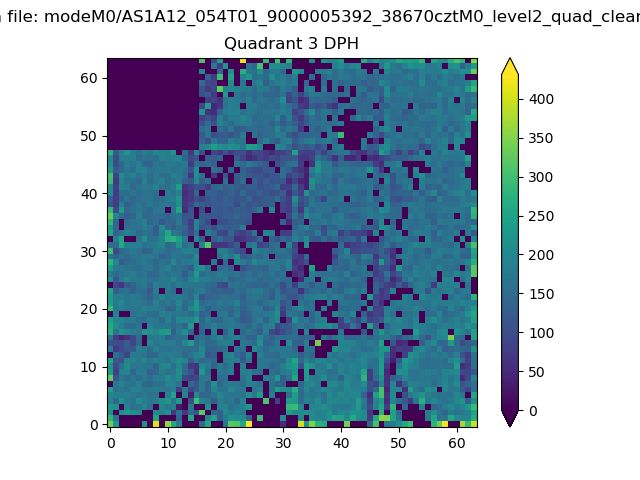 |
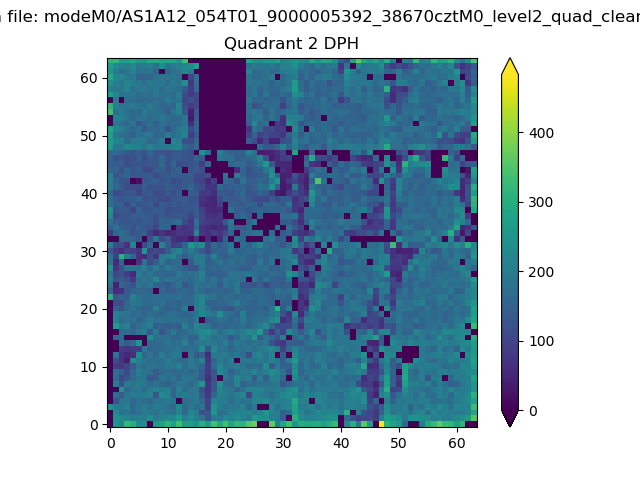 |
Quadrant C |
| Plot type | Count rate plots | Images |
|---|---|---|
| Comparison with Poisson distribution Blue bars denote a histogram of data divided into 1 sec bins. Red curve is a Poisson curve with rate = median count rate of data. |
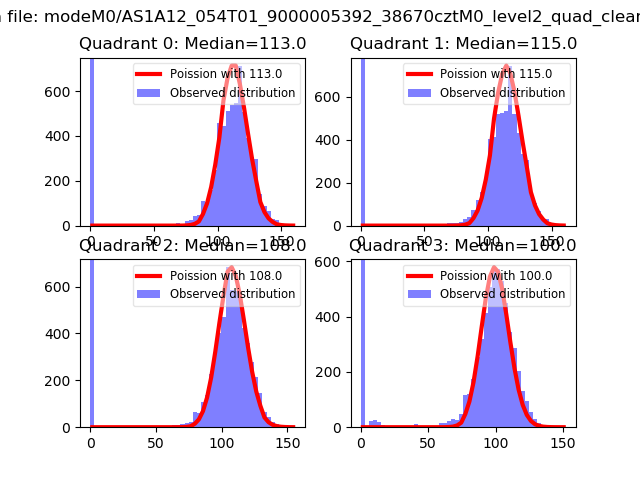 |
 |
| Quadrant-wise count rates Data is divided into 100 sec bins |
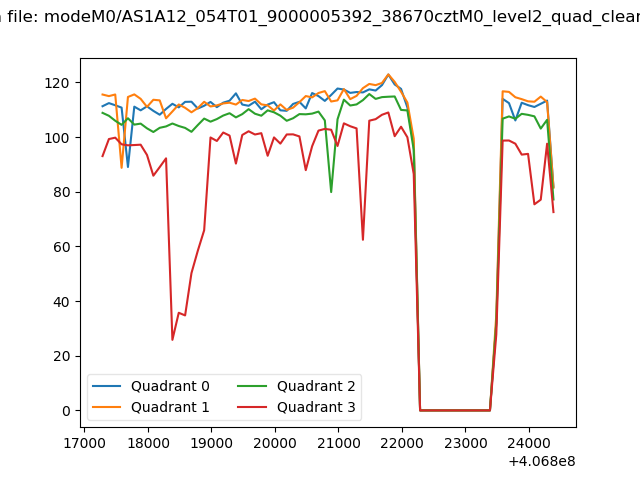 |
|
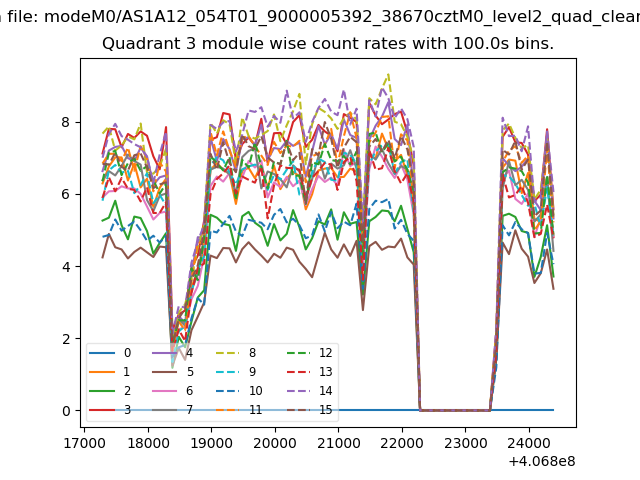
| Module-wise count rates for Quadrant A Data is divided into 100 sec bins |
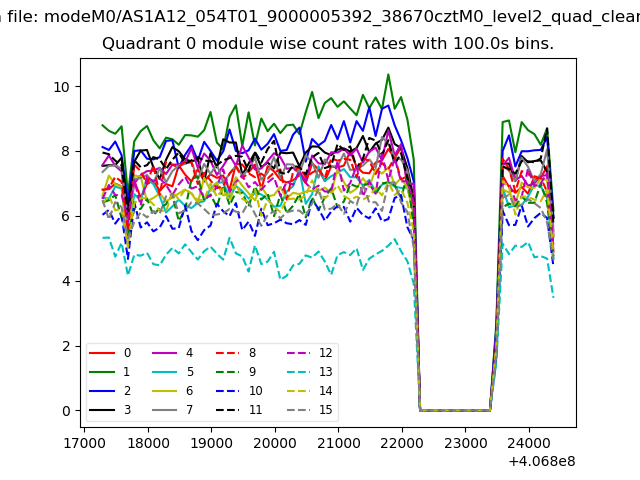 |
 |
| Module-wise count rates for Quadrant B Data is divided into 100 sec bins |
 |
 |
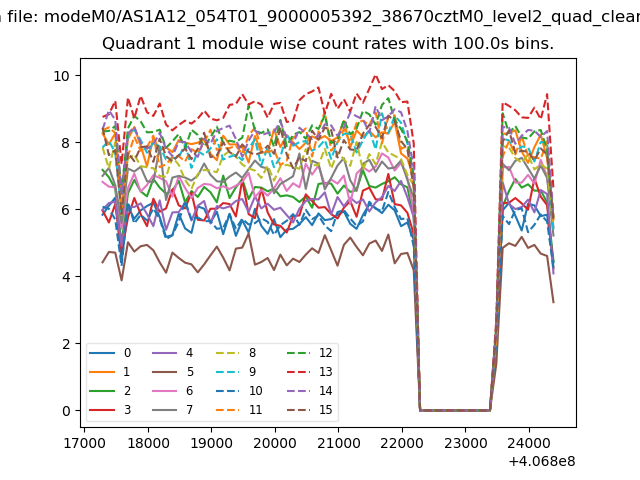
| Module-wise count rates for Quadrant C Data is divided into 100 sec bins |
 |
 |
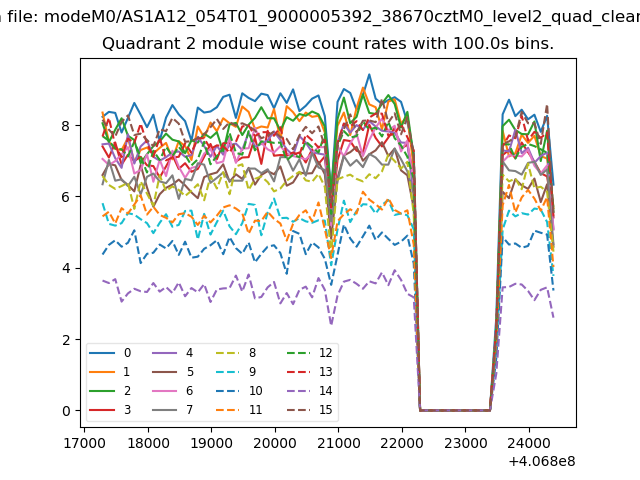
| Module-wise count rates for Quadrant D Data is divided into 100 sec bins |
 |
 |
| Parameter | Plot |
|---|---|
| CZT HV Monitor | 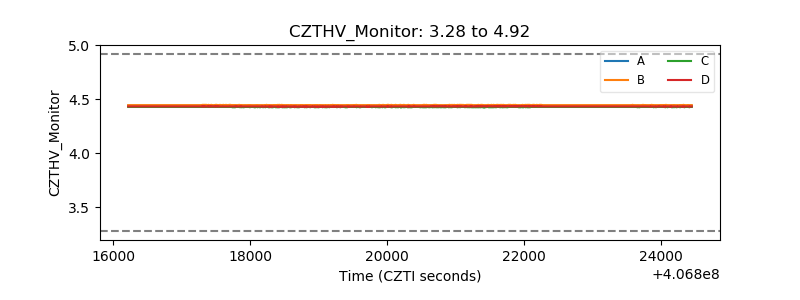 |
| D_VDD | 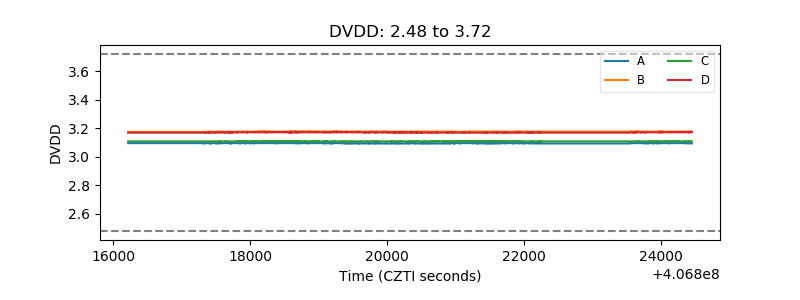 |
| Temperature 1 | 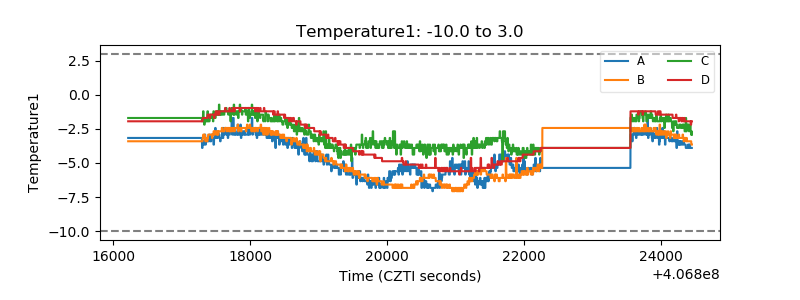 |
| Veto HV Monitor | 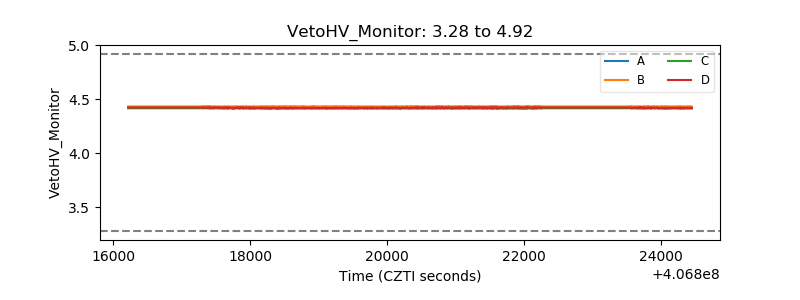 |
| Veto LLD | 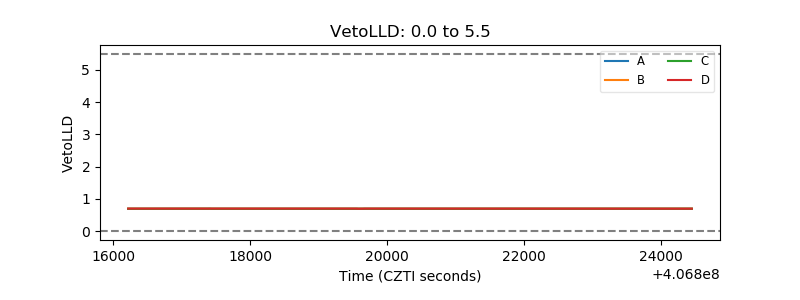 |
| Alpha Counter | 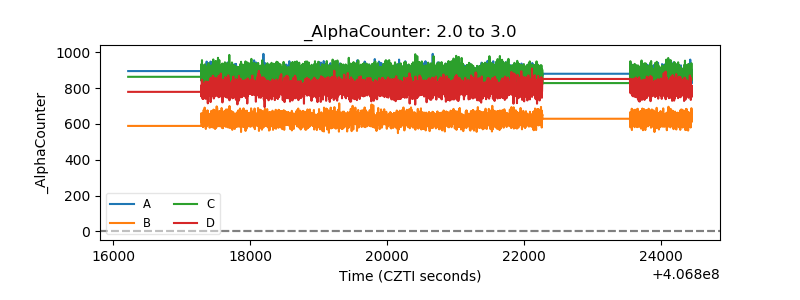 |
| _CPM_Rate |  |
| CZT Counter | 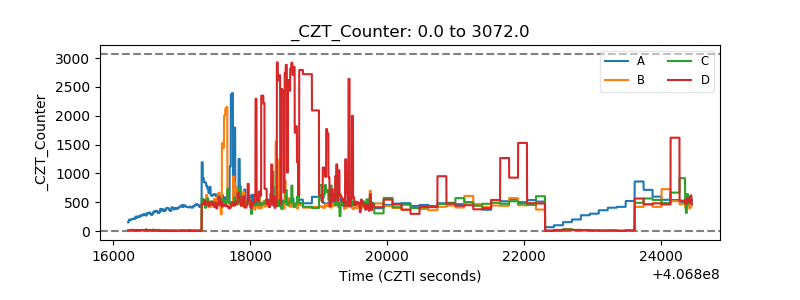 |
| +2.5 Volts monitor | 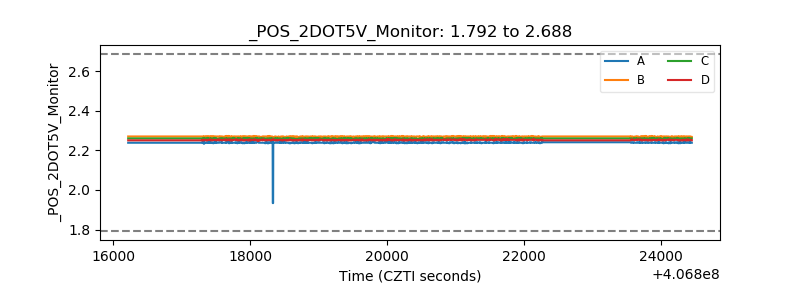 |
| +5 Volts monitor | 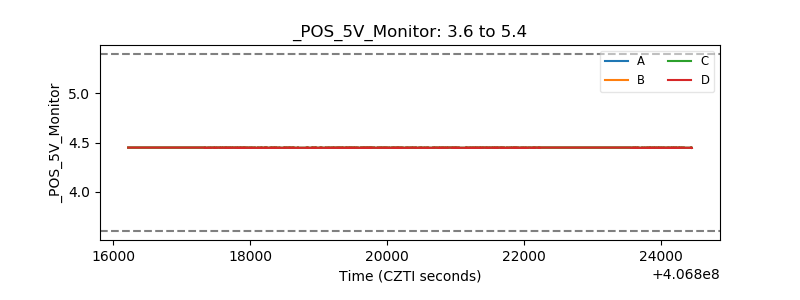 |
| _ROLL_ROT | 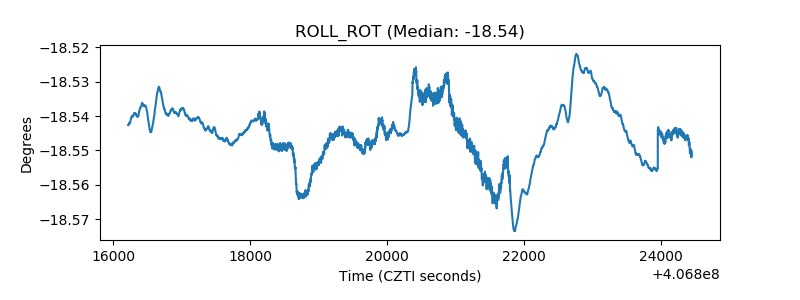 |
| _Roll_DEC | 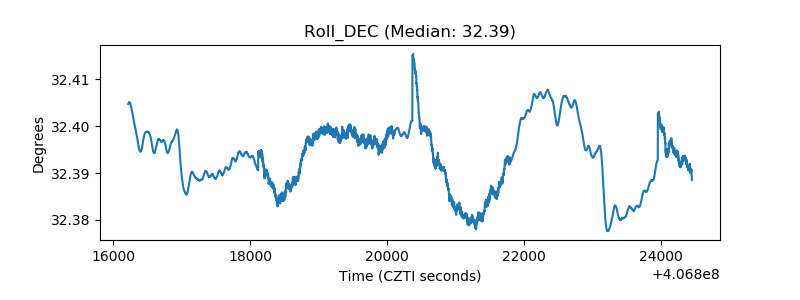 |
| _Roll_RA | 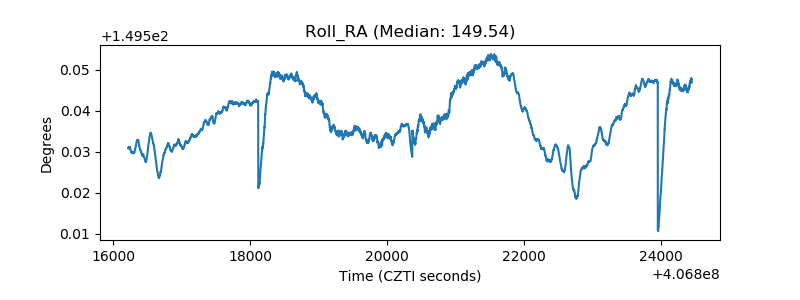 |
| Veto Counter | 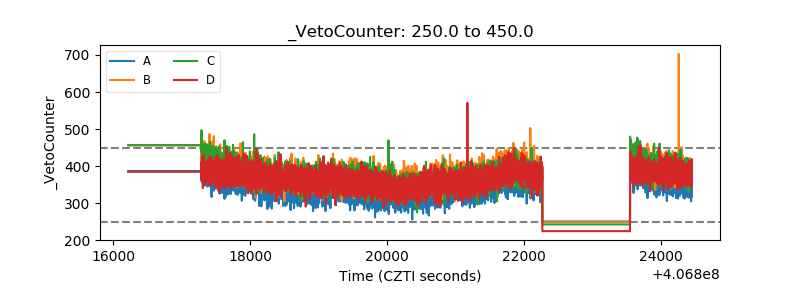 |