| Param | Original file | Final file |
|---|---|---|
| Filename | modeM0/AS1A12_054T01_9000005392_38673cztM0_level2.fits | modeM0/AS1A12_054T01_9000005392_38673cztM0_level2_quad_clean.evt |
| Size (bytes) | 950,368,320 | 242,478,720 |
| Size | 906.3 MB | 231.2 MB |
| Events in quadrant A | 7,745,730 | 1,667,563 |
| Events in quadrant B | 7,010,051 | 1,692,803 |
| Events in quadrant C | 7,652,540 | 1,600,317 |
| Events in quadrant D | 11,612,467 | 1,349,384 |
| Mode M9 | |||
|---|---|---|---|
| Quadrant | BADHDUFLAG | Total packets | Discarded packets |
| A | 0 | 47 | 0 |
| B | 0 | 47 | 0 |
| C | 0 | 47 | 0 |
| D | 0 | 48 | 0 |
| Mode SS | |||
|---|---|---|---|
| Quadrant | BADHDUFLAG | Total packets | Discarded packets |
| A | 0 | 304 | 0 |
| B | 0 | 304 | 0 |
| C | 0 | 304 | 0 |
| D | 0 | 304 | 0 |
| Mode M0 | |||
|---|---|---|---|
| Quadrant | BADHDUFLAG | Total packets | Discarded packets |
| A | 0 | 32393 | 5 |
| B | 0 | 30936 | 4 |
| C | 0 | 32156 | 4 |
| D | 0 | 45049 | 4 |
| Quadrant | Total seconds | Saturated seconds | Saturation percentage |
|---|---|---|---|
| A | 14953 | 70 | 0.468133% |
| B | 14953 | 41 | 0.274192% |
| C | 14953 | 106 | 0.708888% |
| D | 14953 | 1419 | 9.489735% |
Noise dominated data is calculated using 1-second bins in cleaned event files. If a bin has >2000 counts, and if more than 50% of those come from <1% of pixels, then it is considered to be noise-dominated and hence unusable.
| Quadrant | # 1 sec bins | Bins with >0 counts | Bins with >2000 counts | High rate bins dominated by noise | Noise dominated (total time) | Noise dominated (detector-on time) | Marked lightcurve |
|---|---|---|---|---|---|---|---|
| A | 19132 | 14956 | 31 | 31 | 0.16% | 0.21% | 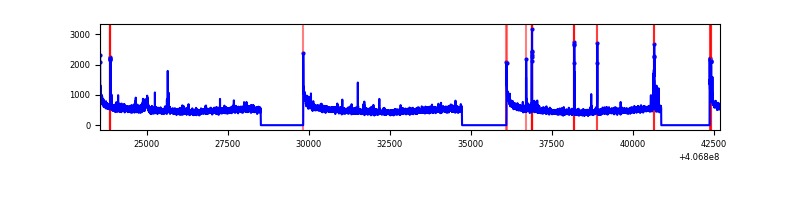 |
| B | 19132 | 14956 | 10 | 10 | 0.05% | 0.07% | 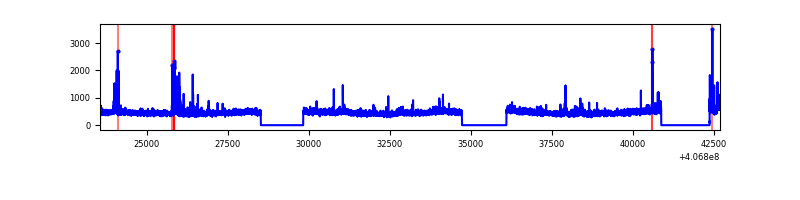 |
| C | 19132 | 14956 | 82 | 82 | 0.43% | 0.55% | 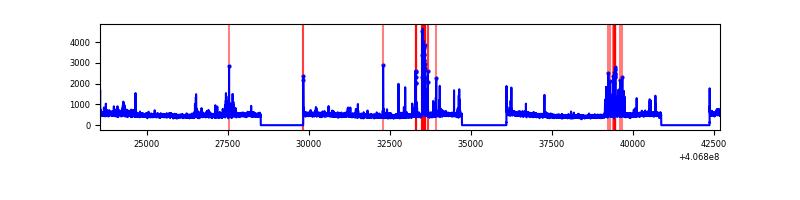 |
| D | 19132 | 14956 | 1315 | 1315 | 6.87% | 8.79% | 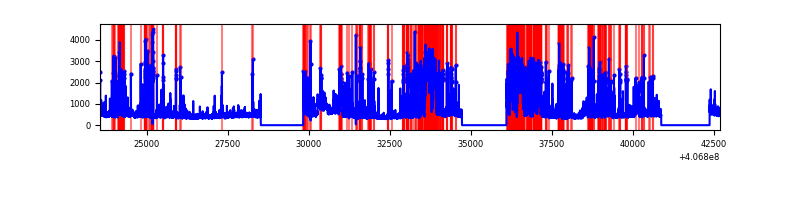 |
Top three noisy pixels from each quadrant. If the there are fewer than three noisy pixels in the level2.evt file, extra rows are filled as -1
| Pixel properties | Quadrant properties | ||||||
|---|---|---|---|---|---|---|---|
| Quadrant | DetID | PixID | Counts | Sigma | Mean | Median | Sigma |
| A | 10 | 83 | 982001 | 2873.31 | 1680 | 1648 | 341.2 |
| A | 13 | 248 | 81543 | 234.16 | 1680 | 1648 | 341.2 |
| A | 15 | 174 | 63326 | 180.77 | 1680 | 1648 | 341.2 |
| B | 5 | 200 | 139553 | 431.81 | 1662 | 1615 | 319.4 |
| B | 4 | 251 | 91275 | 280.68 | 1662 | 1615 | 319.4 |
| B | 0 | 230 | 74412 | 227.89 | 1662 | 1615 | 319.4 |
| C | 15 | 214 | 592273 | 1560.95 | 1626 | 1636 | 378.4 |
| C | 14 | 254 | 582579 | 1535.34 | 1626 | 1636 | 378.4 |
| C | 2 | 16 | 57359 | 147.27 | 1626 | 1636 | 378.4 |
| D | 10 | 118 | 2050914 | 5380.19 | 1559 | 1515 | 380.9 |
| D | 1 | 47 | 1627251 | 4267.97 | 1559 | 1515 | 380.9 |
| D | 13 | 249 | 616541 | 1614.6 | 1559 | 1515 | 380.9 |
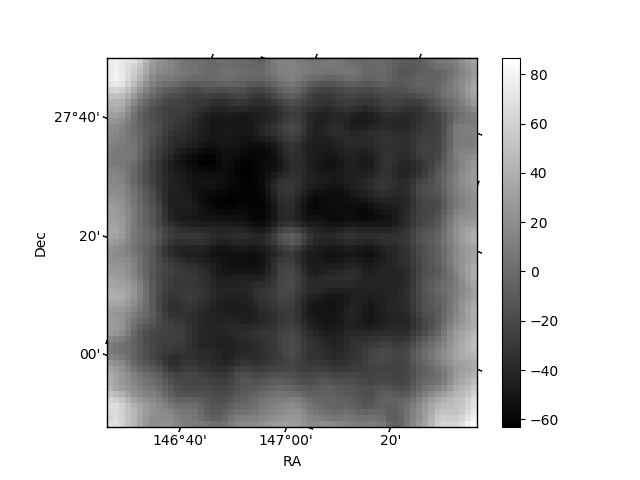
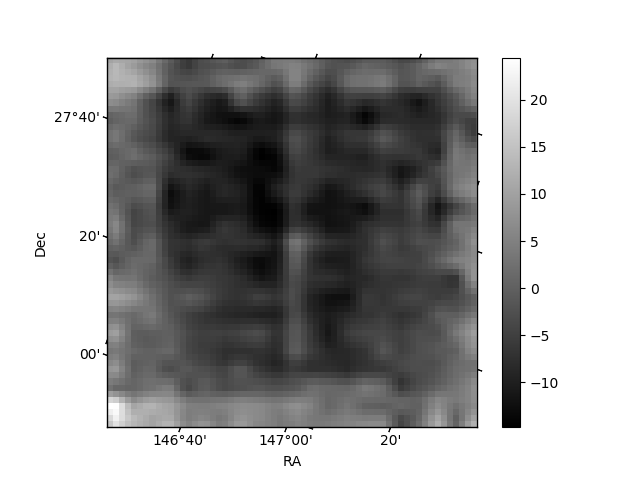
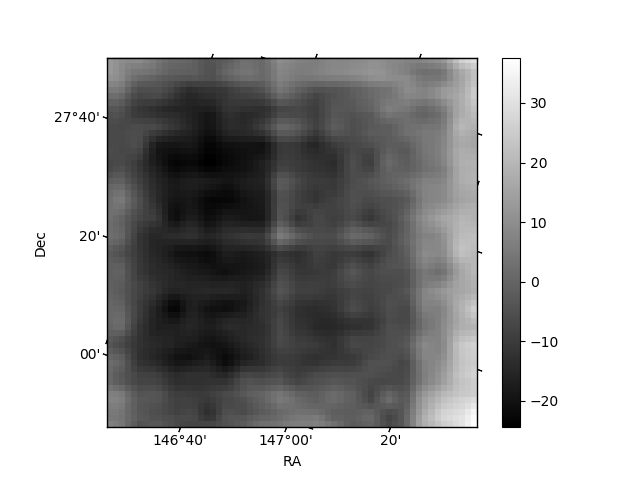
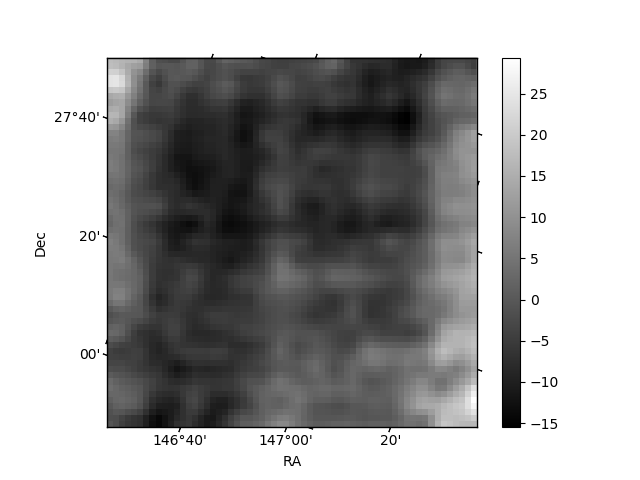
Histogram calculated using DETX and DETY for each event in the final _common_clean file
| Quadrant A | 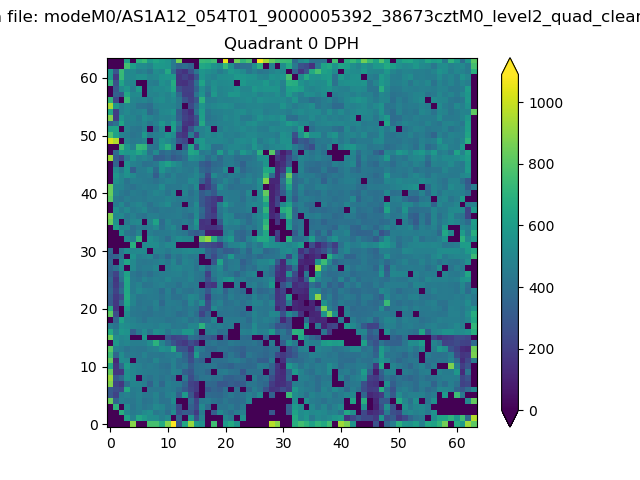 |
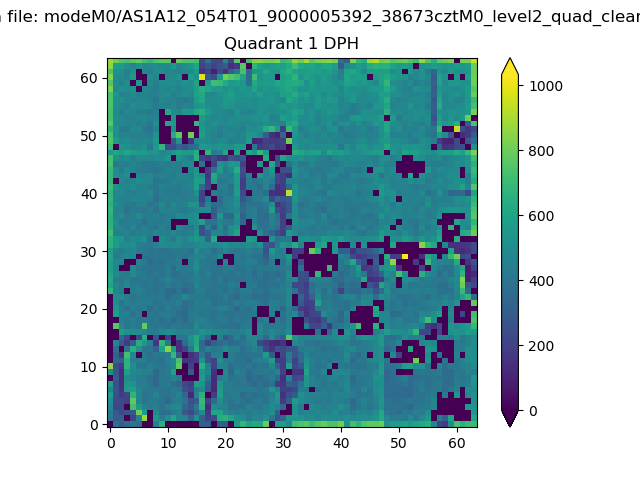 |
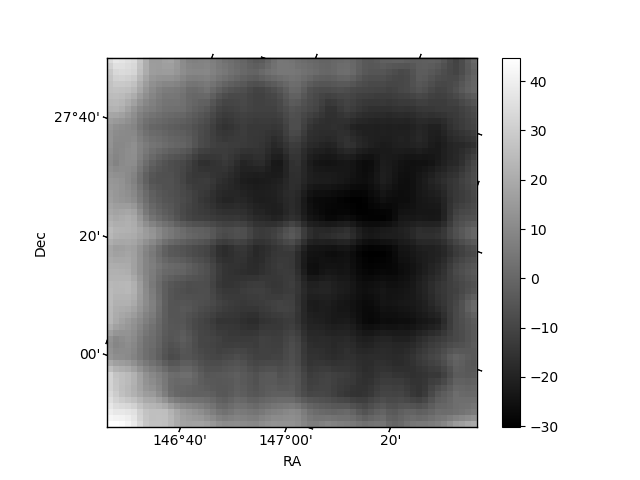
Quadrant B |
|---|---|---|---|
| Quadrant D | 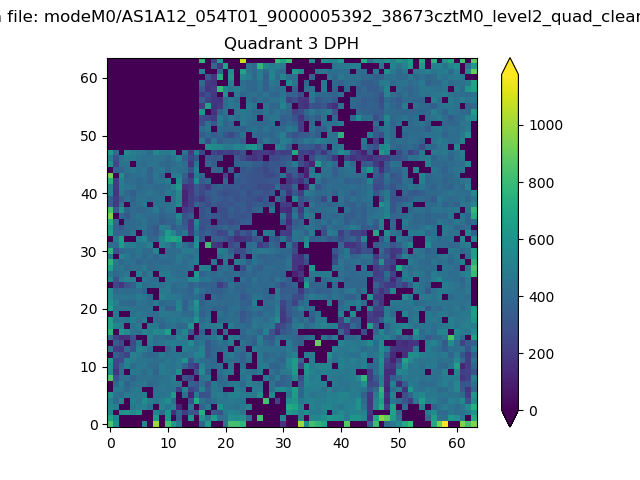 |
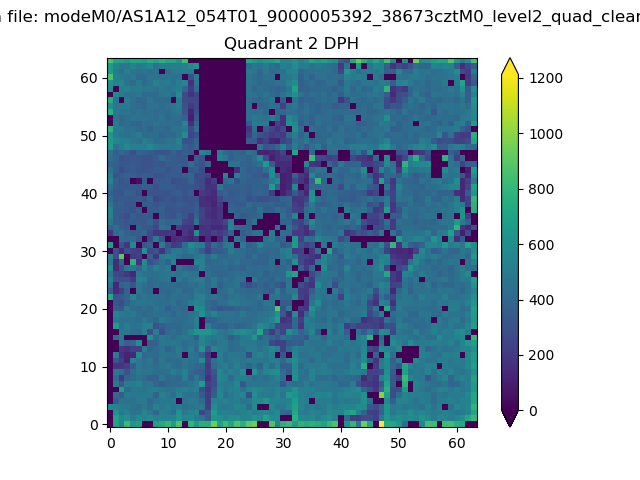 |
Quadrant C |
| Plot type | Count rate plots | Images |
|---|---|---|
| Comparison with Poisson distribution Blue bars denote a histogram of data divided into 1 sec bins. Red curve is a Poisson curve with rate = median count rate of data. |
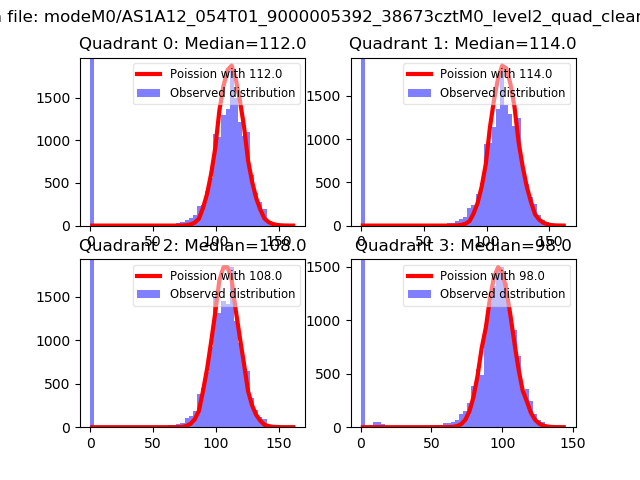 |
 |
| Quadrant-wise count rates Data is divided into 100 sec bins |
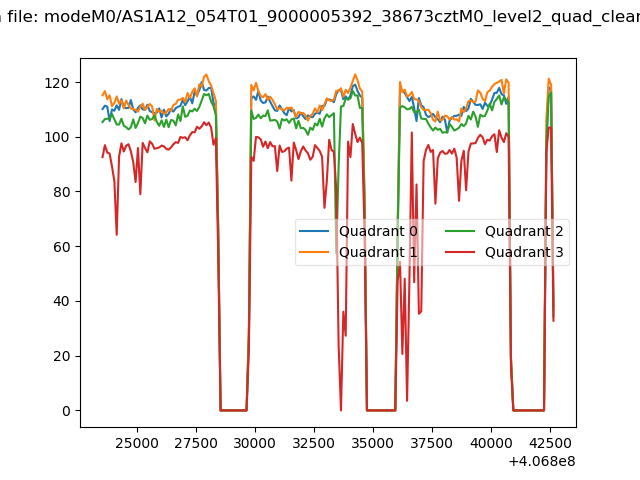 |
|
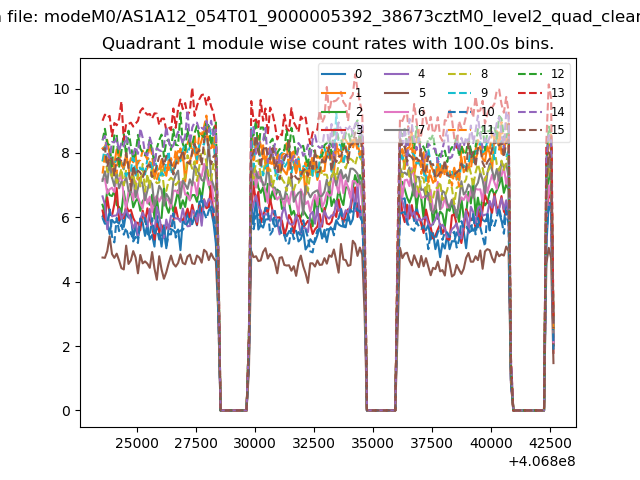
| Module-wise count rates for Quadrant A Data is divided into 100 sec bins |
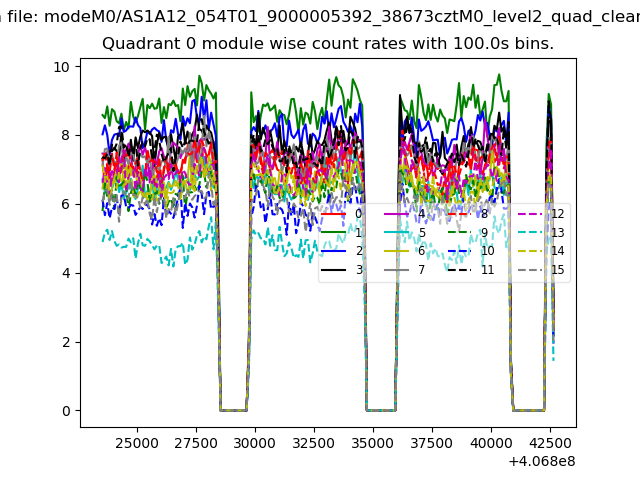 |
 |
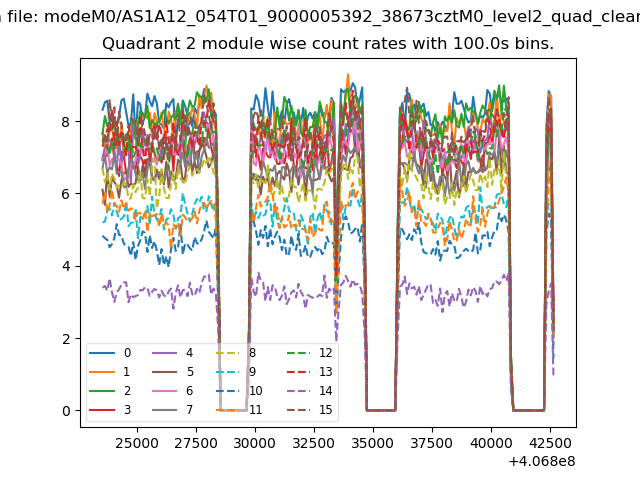
| Module-wise count rates for Quadrant B Data is divided into 100 sec bins |
 |
 |
| Module-wise count rates for Quadrant C Data is divided into 100 sec bins |
 |
 |
| Module-wise count rates for Quadrant D Data is divided into 100 sec bins |
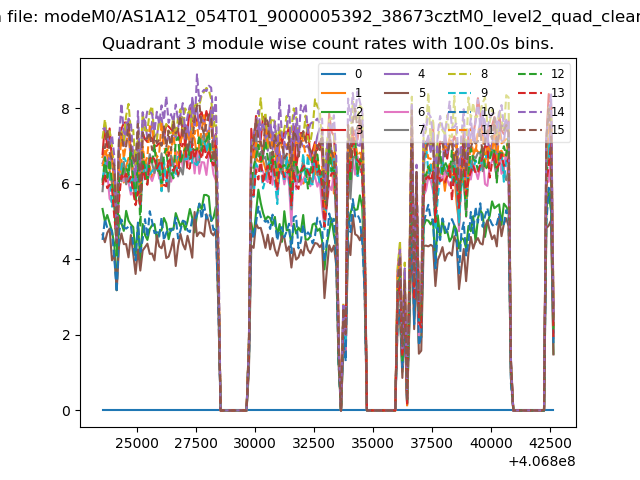 |
 |
| Parameter | Plot |
|---|---|
| CZT HV Monitor | 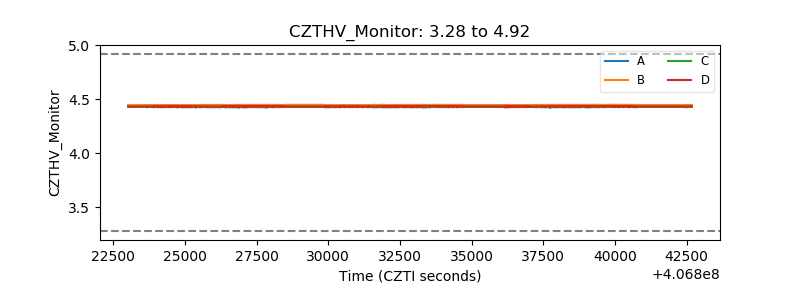 |
| D_VDD | 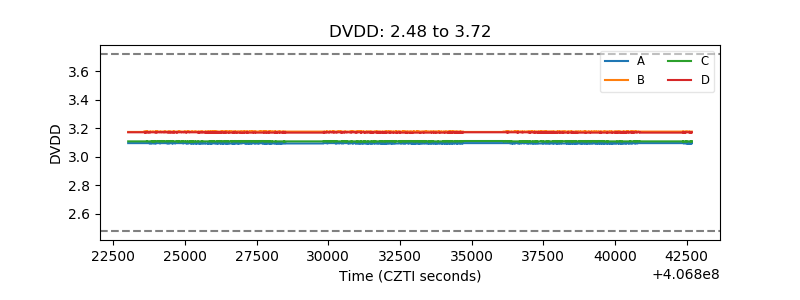 |
| Temperature 1 | 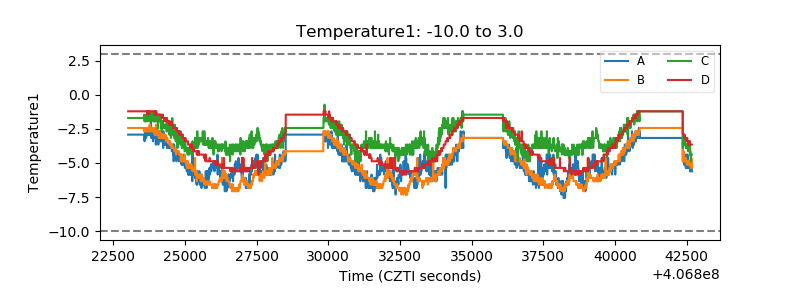 |
| Veto HV Monitor | 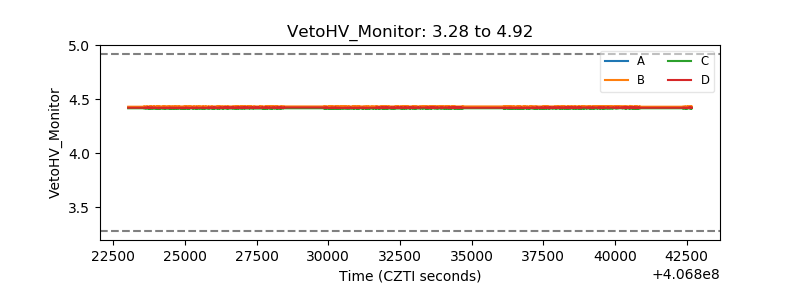 |
| Veto LLD | 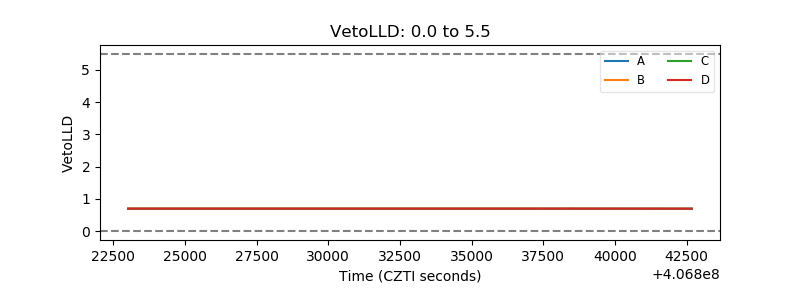 |
| Alpha Counter | 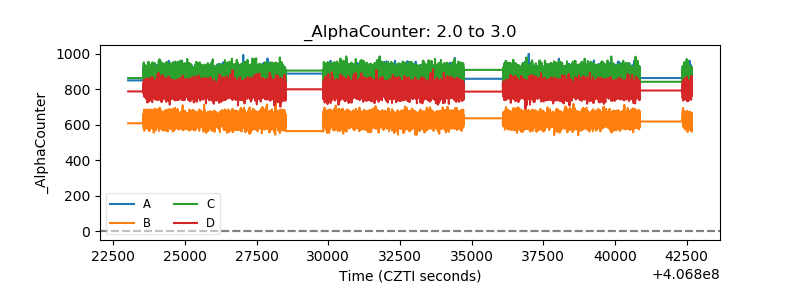 |
| _CPM_Rate | 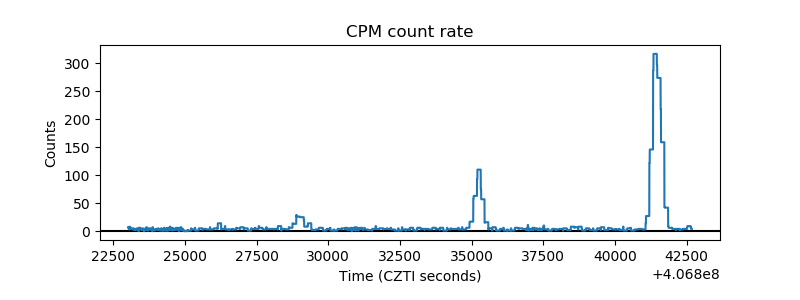 |
| CZT Counter | 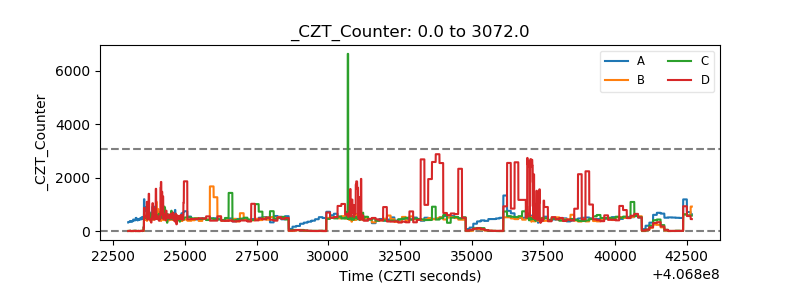 |
| +2.5 Volts monitor |  |
| +5 Volts monitor |  |
| _ROLL_ROT | 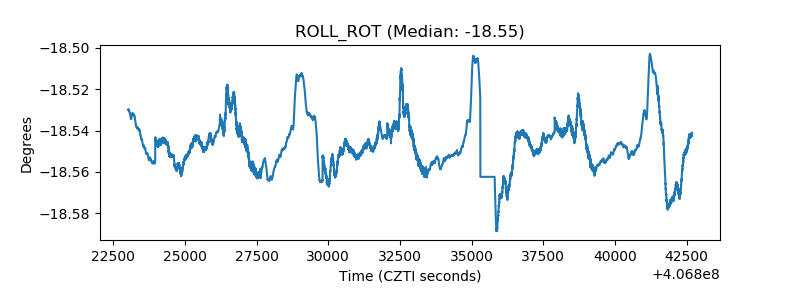 |
| _Roll_DEC | 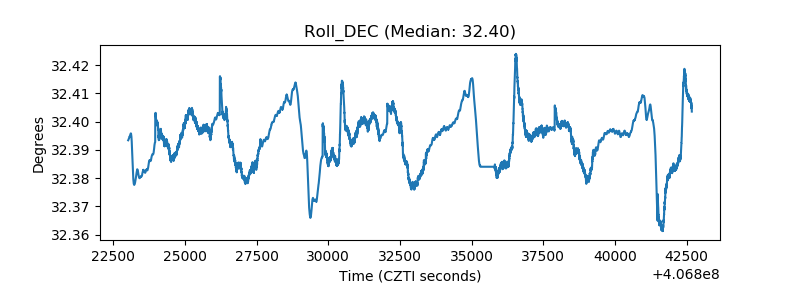 |
| _Roll_RA | 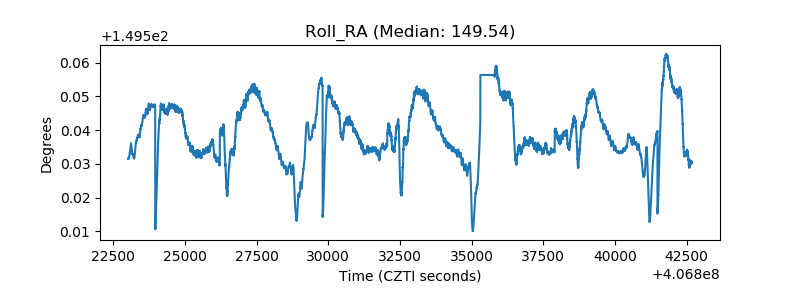 |
| Veto Counter | 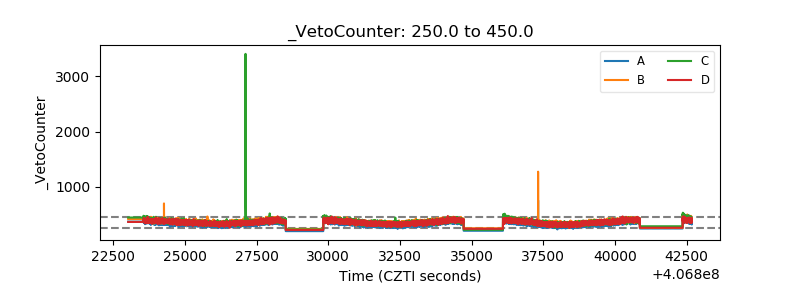 |