| Param | Original file | Final file |
|---|---|---|
| Filename | modeM0/AS1A12_054T01_9000005392_38674cztM0_level2.fits | modeM0/AS1A12_054T01_9000005392_38674cztM0_level2_quad_clean.evt |
| Size (bytes) | 357,909,120 | 94,233,600 |
| Size | 341.3 MB | 89.9 MB |
| Events in quadrant A | 2,916,838 | 637,418 |
| Events in quadrant B | 3,554,790 | 644,760 |
| Events in quadrant C | 2,781,739 | 616,860 |
| Events in quadrant D | 3,557,911 | 561,412 |
| Mode M9 | |||
|---|---|---|---|
| Quadrant | BADHDUFLAG | Total packets | Discarded packets |
| A | 0 | 30 | 0 |
| B | 0 | 30 | 0 |
| C | 0 | 30 | 0 |
| D | 0 | 30 | 0 |
| Mode SS | |||
|---|---|---|---|
| Quadrant | BADHDUFLAG | Total packets | Discarded packets |
| A | 0 | 114 | 0 |
| B | 0 | 114 | 0 |
| C | 0 | 114 | 0 |
| D | 0 | 114 | 0 |
| Mode M0 | |||
|---|---|---|---|
| Quadrant | BADHDUFLAG | Total packets | Discarded packets |
| A | 0 | 12246 | 3 |
| B | 0 | 14216 | 2 |
| C | 0 | 11831 | 2 |
| D | 0 | 14515 | 2 |
| Quadrant | Total seconds | Saturated seconds | Saturation percentage |
|---|---|---|---|
| A | 5619 | 24 | 0.427122% |
| B | 5619 | 71 | 1.263570% |
| C | 5619 | 23 | 0.409326% |
| D | 5619 | 205 | 3.648336% |
Noise dominated data is calculated using 1-second bins in cleaned event files. If a bin has >2000 counts, and if more than 50% of those come from <1% of pixels, then it is considered to be noise-dominated and hence unusable.
| Quadrant | # 1 sec bins | Bins with >0 counts | Bins with >2000 counts | High rate bins dominated by noise | Noise dominated (total time) | Noise dominated (detector-on time) | Marked lightcurve |
|---|---|---|---|---|---|---|---|
| A | 7231 | 5620 | 9 | 9 | 0.12% | 0.16% | 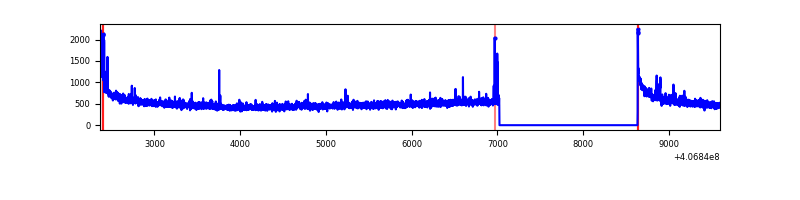 |
| B | 7231 | 5620 | 28 | 28 | 0.39% | 0.50% | 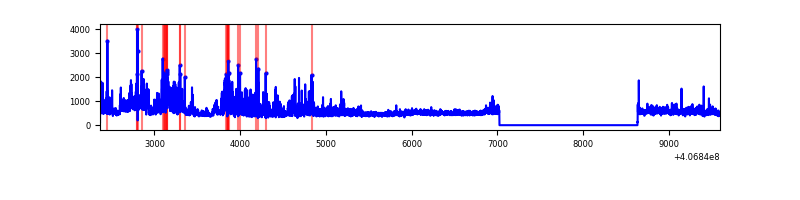 |
| C | 7231 | 5620 | 15 | 15 | 0.21% | 0.27% | 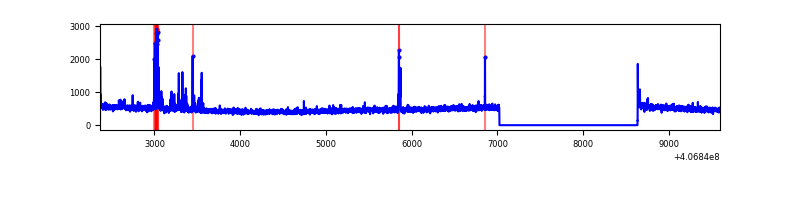 |
| D | 7231 | 5620 | 160 | 160 | 2.21% | 2.85% | 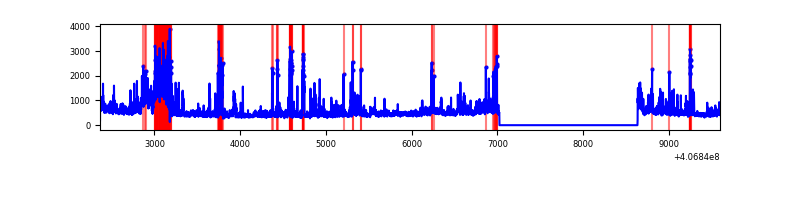 |
Top three noisy pixels from each quadrant. If the there are fewer than three noisy pixels in the level2.evt file, extra rows are filled as -1
| Pixel properties | Quadrant properties | ||||||
|---|---|---|---|---|---|---|---|
| Quadrant | DetID | PixID | Counts | Sigma | Mean | Median | Sigma |
| A | 10 | 83 | 407684 | 3152.85 | 630 | 617 | 129.1 |
| A | 13 | 248 | 48663 | 372.13 | 630 | 617 | 129.1 |
| A | 12 | 189 | 11702 | 85.86 | 630 | 617 | 129.1 |
| B | 4 | 251 | 966341 | 7916.02 | 623 | 608 | 122.0 |
| B | 4 | 171 | 45247 | 365.9 | 623 | 608 | 122.0 |
| B | 0 | 230 | 44692 | 361.35 | 623 | 608 | 122.0 |
| C | 15 | 214 | 228019 | 1571.08 | 614 | 618 | 144.7 |
| C | 15 | 208 | 69724 | 477.44 | 614 | 618 | 144.7 |
| C | 14 | 254 | 38654 | 262.78 | 614 | 618 | 144.7 |
| D | 5 | 222 | 624484 | 4159.07 | 605 | 586 | 150.0 |
| D | 13 | 249 | 222663 | 1480.42 | 605 | 586 | 150.0 |
| D | 10 | 118 | 141678 | 940.56 | 605 | 586 | 150.0 |
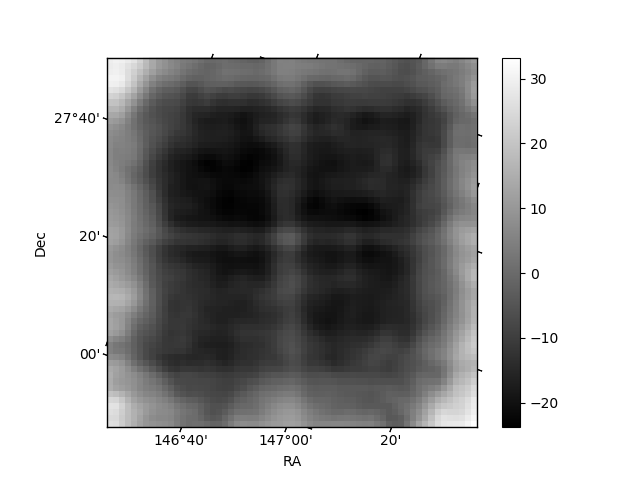
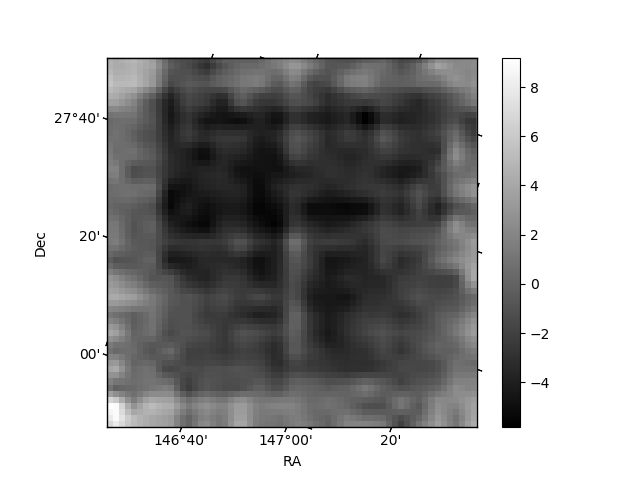
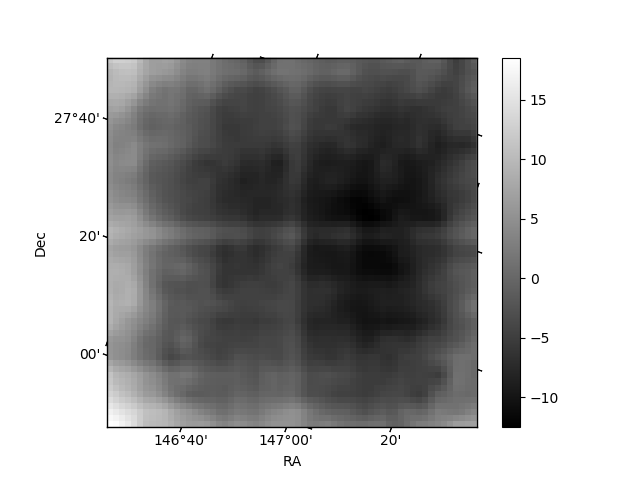
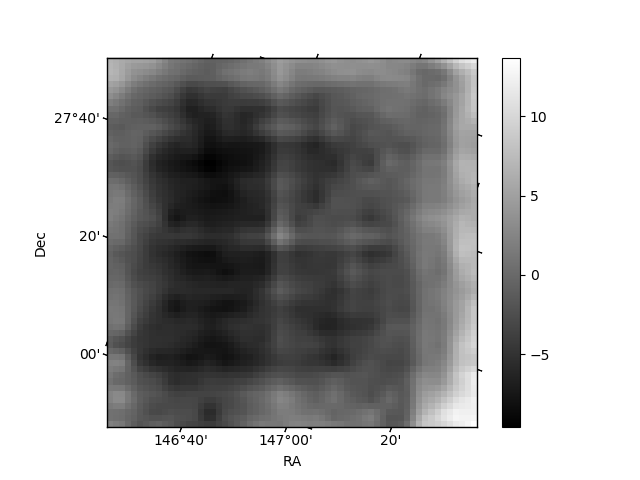
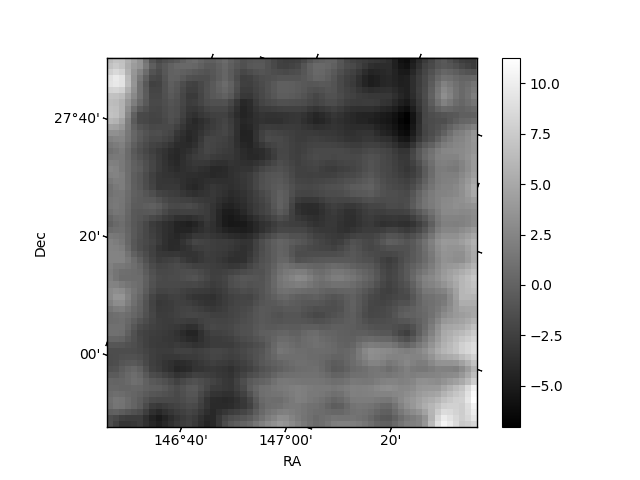
Histogram calculated using DETX and DETY for each event in the final _common_clean file
| Quadrant A | 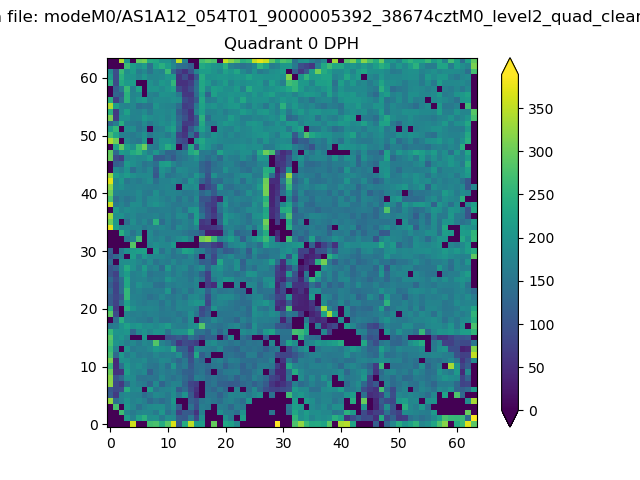 |
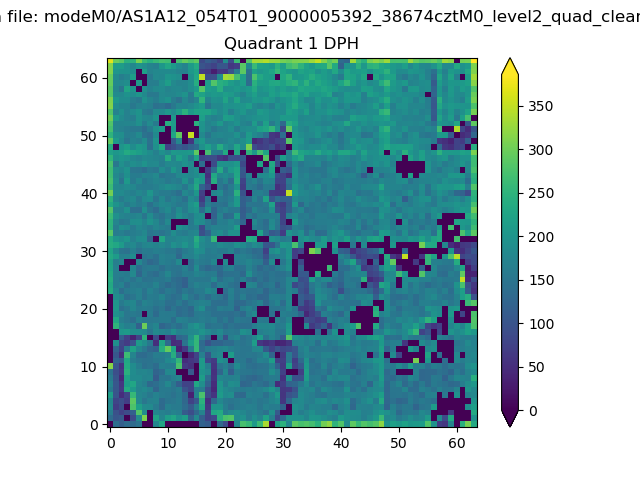 |
Quadrant B |
|---|---|---|---|
| Quadrant D | 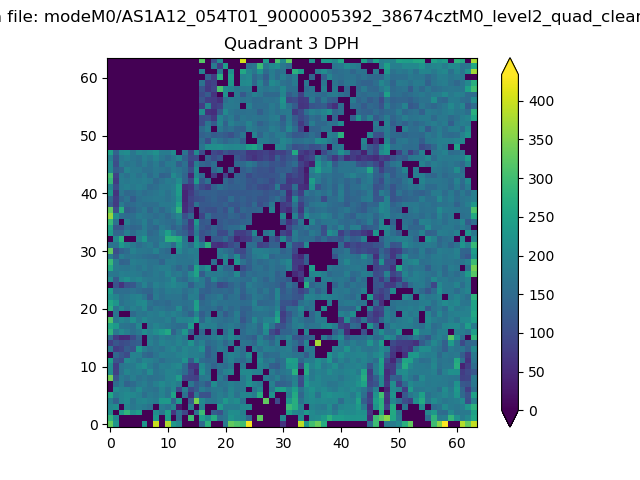 |
 |
Quadrant C |
| Plot type | Count rate plots | Images |
|---|---|---|
| Comparison with Poisson distribution Blue bars denote a histogram of data divided into 1 sec bins. Red curve is a Poisson curve with rate = median count rate of data. |
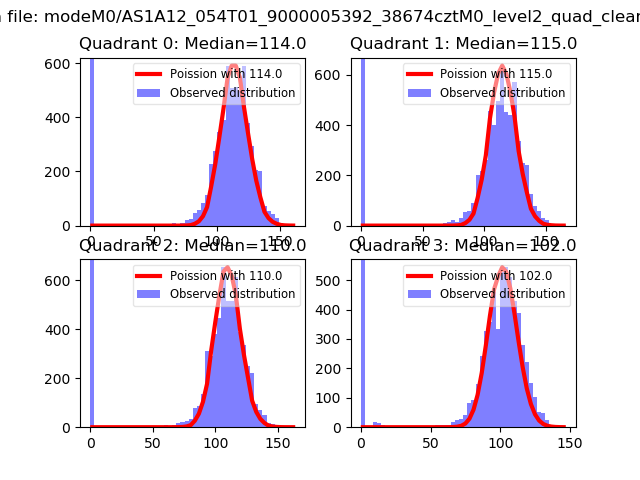 |
 |
| Quadrant-wise count rates Data is divided into 100 sec bins |
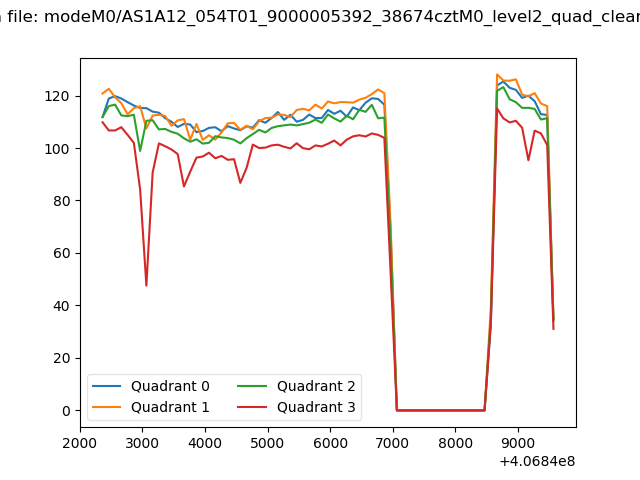 |
|
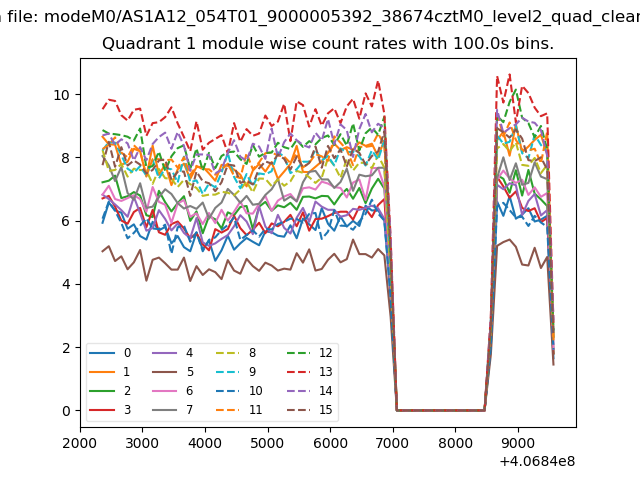
| Module-wise count rates for Quadrant A Data is divided into 100 sec bins |
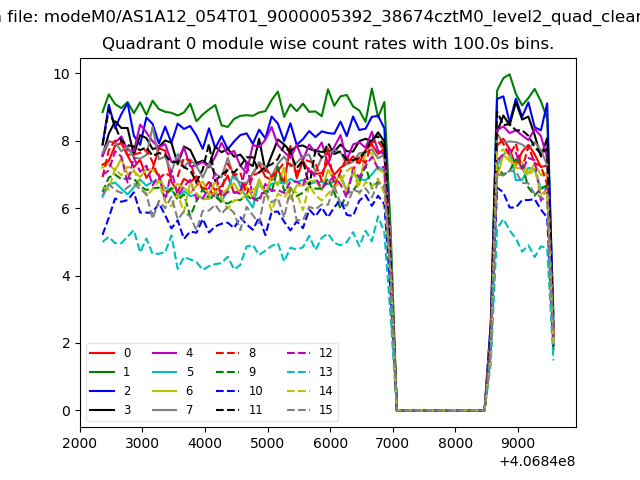 |
 |
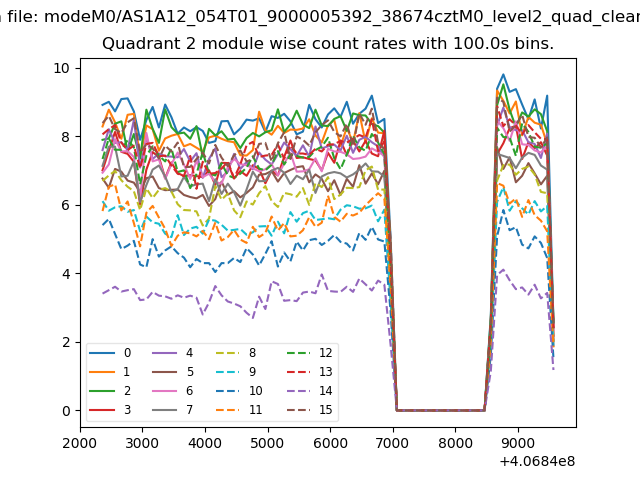
| Module-wise count rates for Quadrant B Data is divided into 100 sec bins |
 |
 |
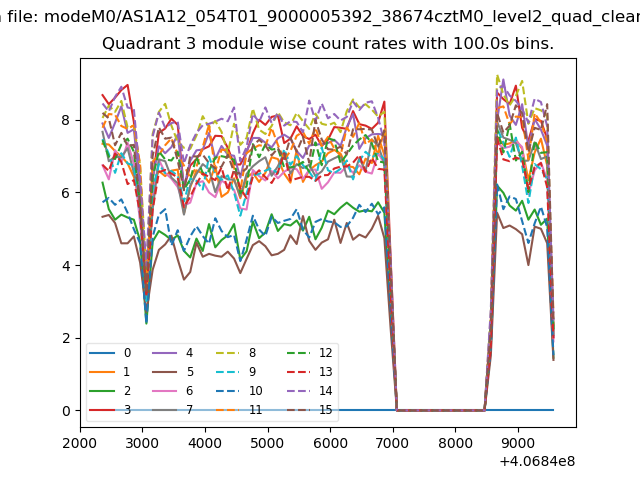
| Module-wise count rates for Quadrant C Data is divided into 100 sec bins |
 |
 |
| Module-wise count rates for Quadrant D Data is divided into 100 sec bins |
 |
 |
| Parameter | Plot |
|---|---|
| CZT HV Monitor | 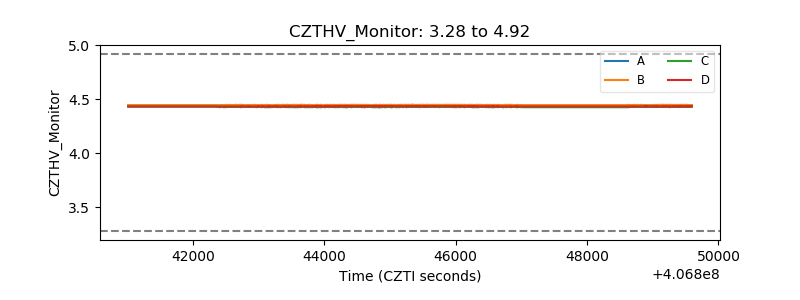 |
| D_VDD | 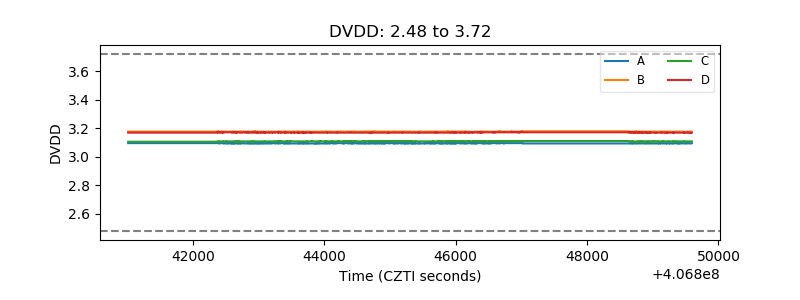 |
| Temperature 1 | 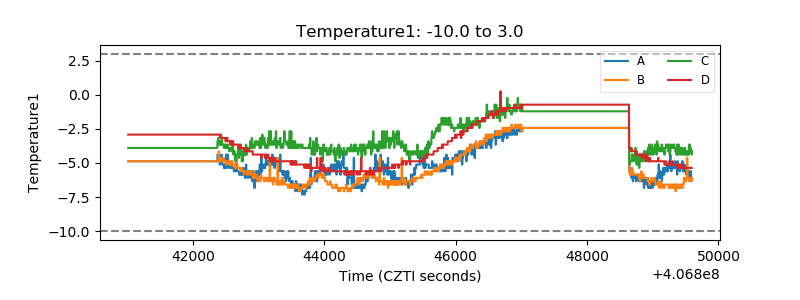 |
| Veto HV Monitor | 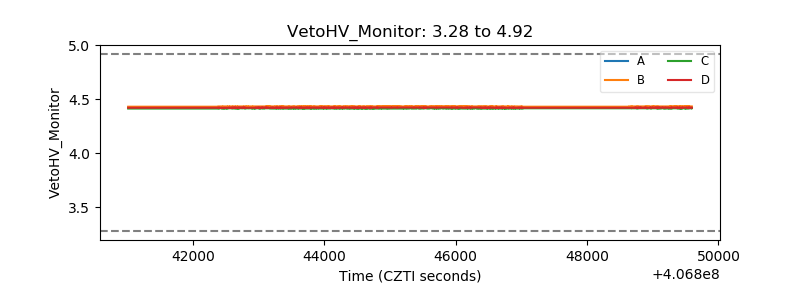 |
| Veto LLD | 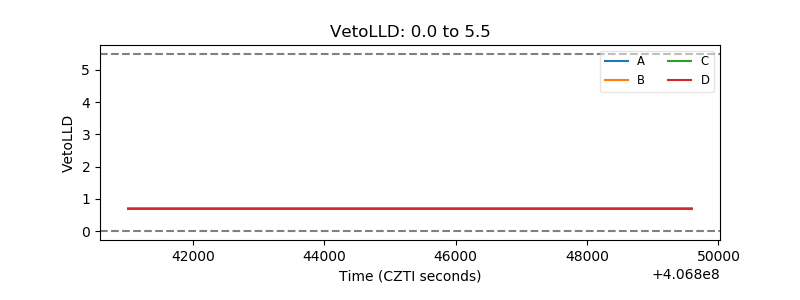 |
| Alpha Counter | 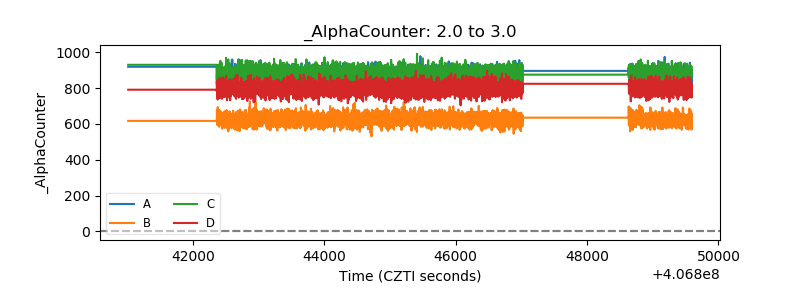 |
| _CPM_Rate |  |
| CZT Counter | 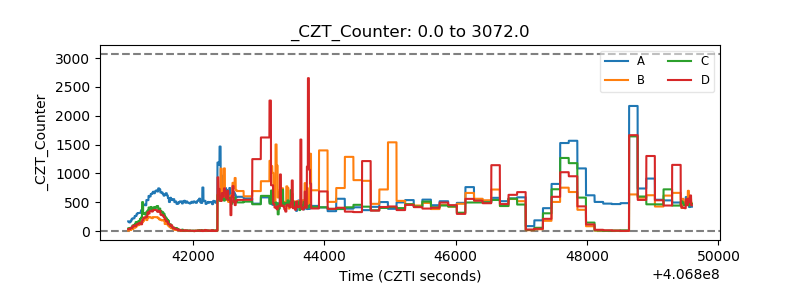 |
| +2.5 Volts monitor | 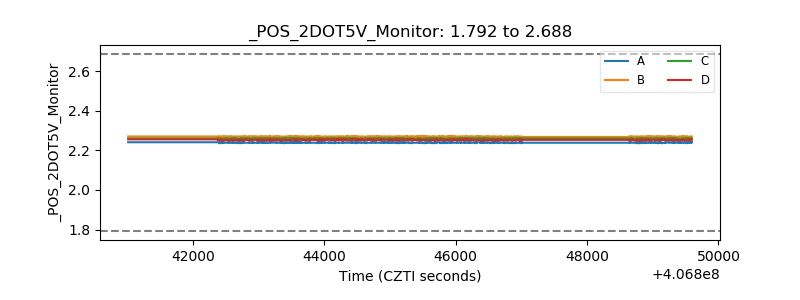 |
| +5 Volts monitor | 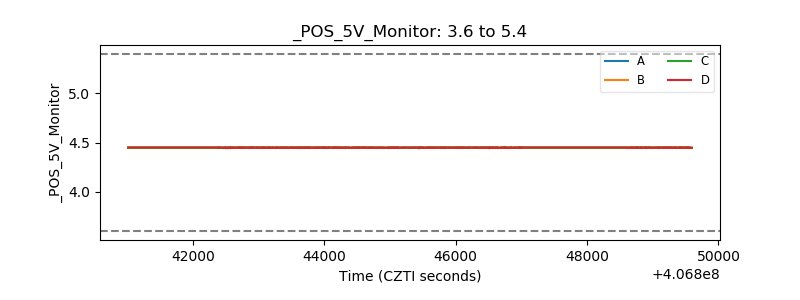 |
| _ROLL_ROT | 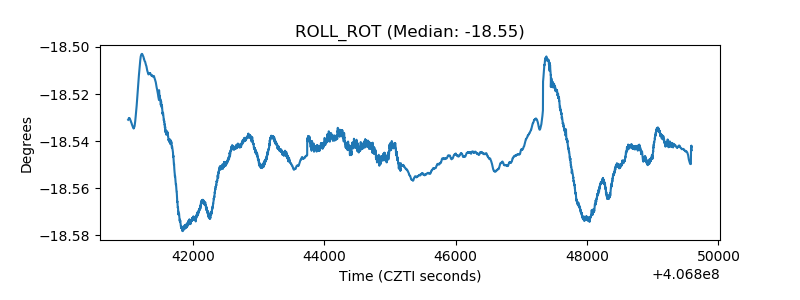 |
| _Roll_DEC | 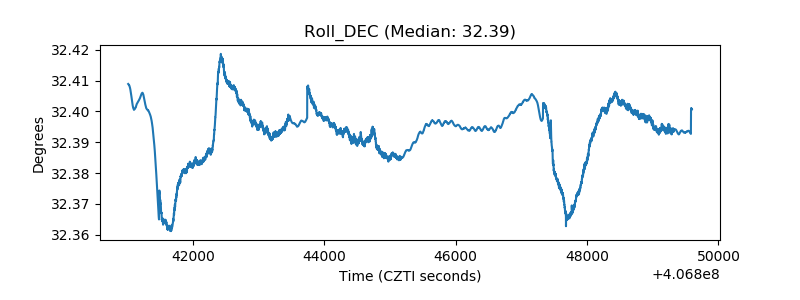 |
| _Roll_RA | 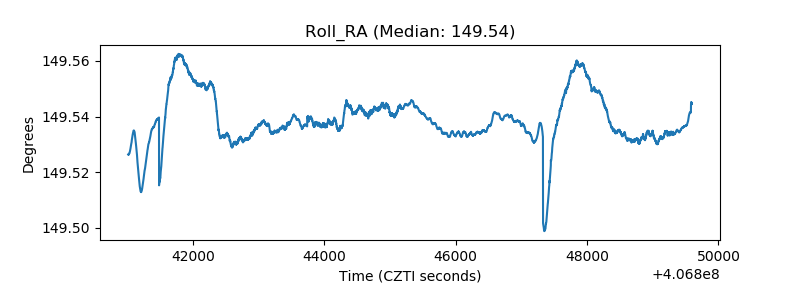 |
| Veto Counter | 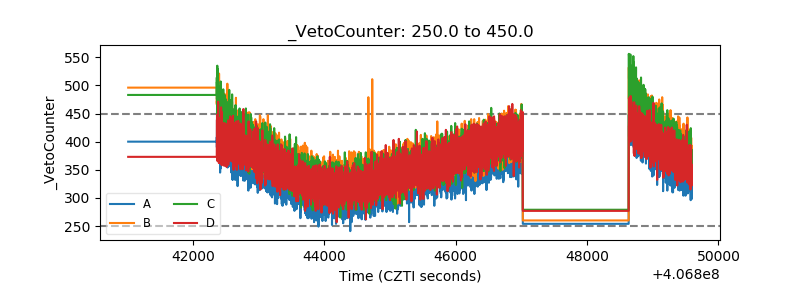 |