| Param | Original file | Final file |
|---|---|---|
| Filename | modeM0/AS1A12_054T01_9000005392_38676cztM0_level2.fits | modeM0/AS1A12_054T01_9000005392_38676cztM0_level2_quad_clean.evt |
| Size (bytes) | 355,861,440 | 89,565,120 |
| Size | 339.4 MB | 85.4 MB |
| Events in quadrant A | 2,748,165 | 611,405 |
| Events in quadrant B | 4,443,323 | 593,984 |
| Events in quadrant C | 2,567,503 | 596,554 |
| Events in quadrant D | 3,001,988 | 539,691 |
| Mode M9 | |||
|---|---|---|---|
| Quadrant | BADHDUFLAG | Total packets | Discarded packets |
| A | 0 | 28 | 0 |
| B | 0 | 28 | 0 |
| C | 0 | 28 | 0 |
| D | 0 | 29 | 0 |
| Mode SS | |||
|---|---|---|---|
| Quadrant | BADHDUFLAG | Total packets | Discarded packets |
| A | 0 | 108 | 0 |
| B | 0 | 108 | 0 |
| C | 0 | 108 | 0 |
| D | 0 | 108 | 0 |
| Mode M0 | |||
|---|---|---|---|
| Quadrant | BADHDUFLAG | Total packets | Discarded packets |
| A | 0 | 11521 | 3 |
| B | 0 | 16804 | 2 |
| C | 0 | 10990 | 2 |
| D | 0 | 12714 | 2 |
| Quadrant | Total seconds | Saturated seconds | Saturation percentage |
|---|---|---|---|
| A | 5287 | 31 | 0.586344% |
| B | 5287 | 440 | 8.322300% |
| C | 5287 | 6 | 0.113486% |
| D | 5287 | 132 | 2.496690% |
Noise dominated data is calculated using 1-second bins in cleaned event files. If a bin has >2000 counts, and if more than 50% of those come from <1% of pixels, then it is considered to be noise-dominated and hence unusable.
| Quadrant | # 1 sec bins | Bins with >0 counts | Bins with >2000 counts | High rate bins dominated by noise | Noise dominated (total time) | Noise dominated (detector-on time) | Marked lightcurve |
|---|---|---|---|---|---|---|---|
| A | 7050 | 5288 | 18 | 18 | 0.26% | 0.34% | 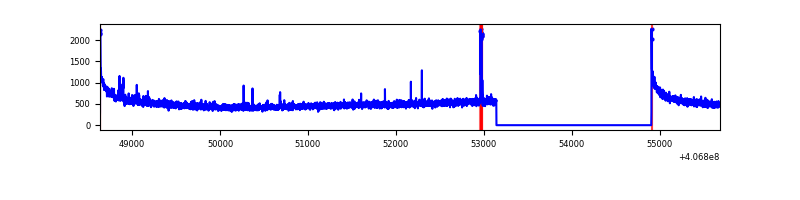 |
| B | 7050 | 5288 | 269 | 269 | 3.82% | 5.09% | 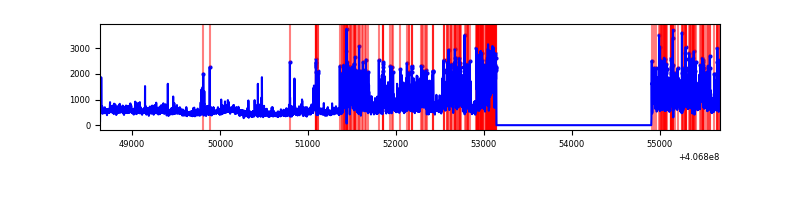 |
| C | 7050 | 5288 | 4 | 4 | 0.06% | 0.08% | 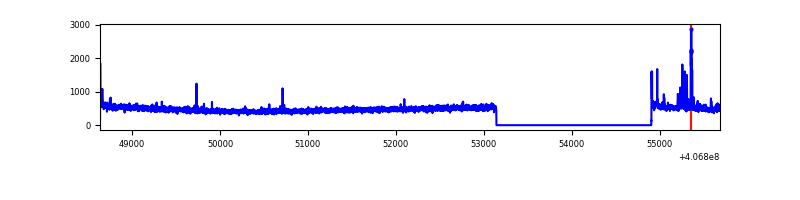 |
| D | 7050 | 5288 | 116 | 116 | 1.65% | 2.19% | 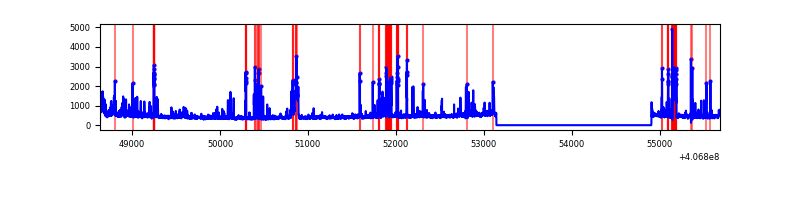 |
Top three noisy pixels from each quadrant. If the there are fewer than three noisy pixels in the level2.evt file, extra rows are filled as -1
| Pixel properties | Quadrant properties | ||||||
|---|---|---|---|---|---|---|---|
| Quadrant | DetID | PixID | Counts | Sigma | Mean | Median | Sigma |
| A | 10 | 83 | 393038 | 3246.23 | 594 | 584 | 120.9 |
| A | 12 | 189 | 29155 | 236.33 | 594 | 584 | 120.9 |
| A | 13 | 248 | 17092 | 136.55 | 594 | 584 | 120.9 |
| B | 4 | 251 | 2047267 | 18167.87 | 577 | 561 | 112.7 |
| B | 12 | 16 | 43367 | 379.97 | 577 | 561 | 112.7 |
| B | 0 | 189 | 25041 | 217.3 | 577 | 561 | 112.7 |
| C | 15 | 214 | 215114 | 1573.41 | 580 | 584 | 136.3 |
| C | 15 | 208 | 56393 | 409.32 | 580 | 584 | 136.3 |
| C | 2 | 16 | 12802 | 89.61 | 580 | 584 | 136.3 |
| D | 10 | 118 | 236924 | 1674.68 | 571 | 554 | 141.1 |
| D | 13 | 249 | 187508 | 1324.57 | 571 | 554 | 141.1 |
| D | 5 | 222 | 156566 | 1105.34 | 571 | 554 | 141.1 |
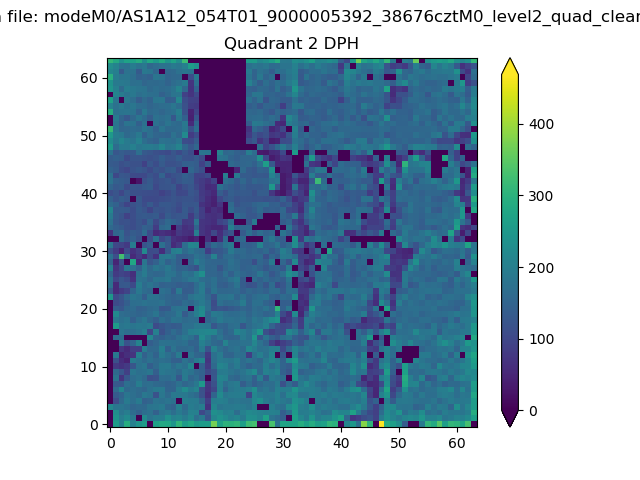
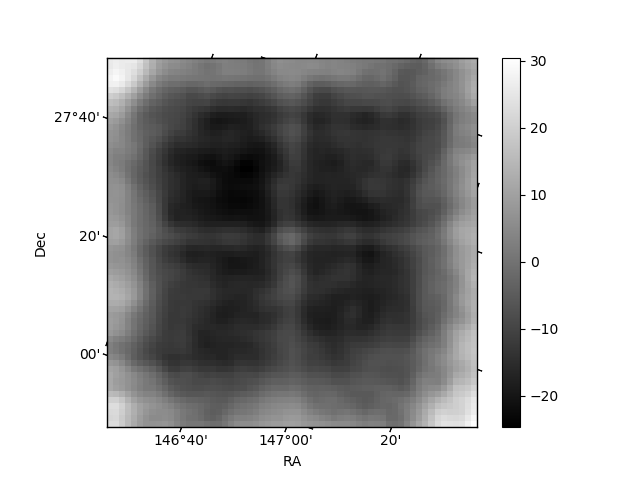
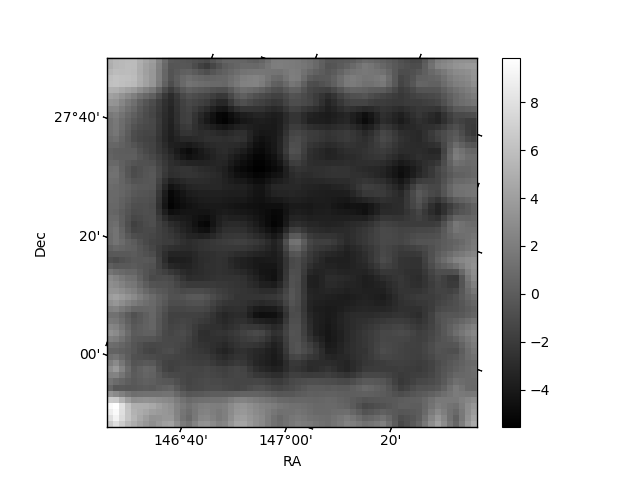
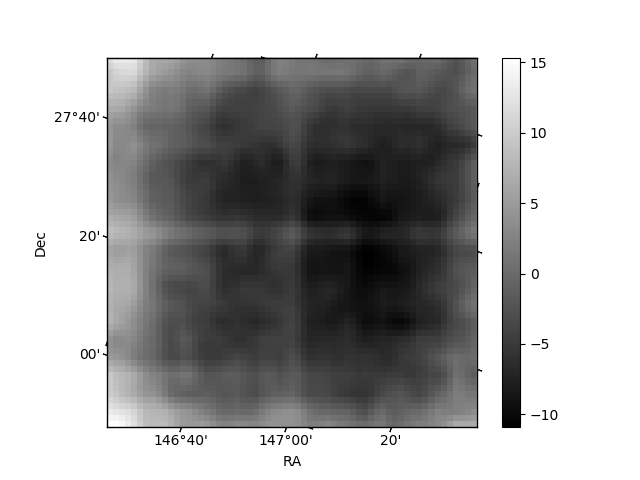
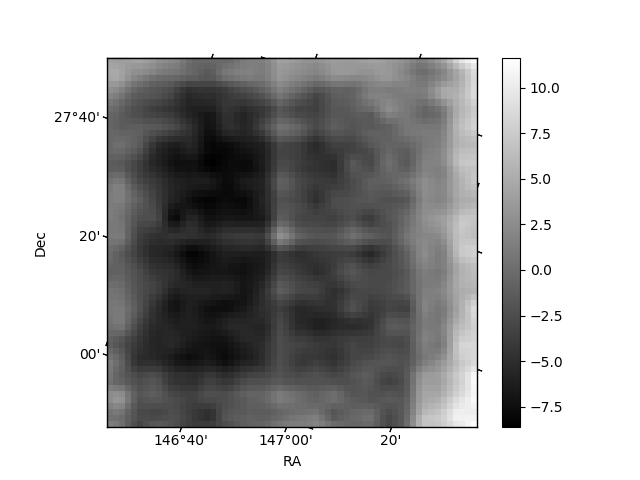
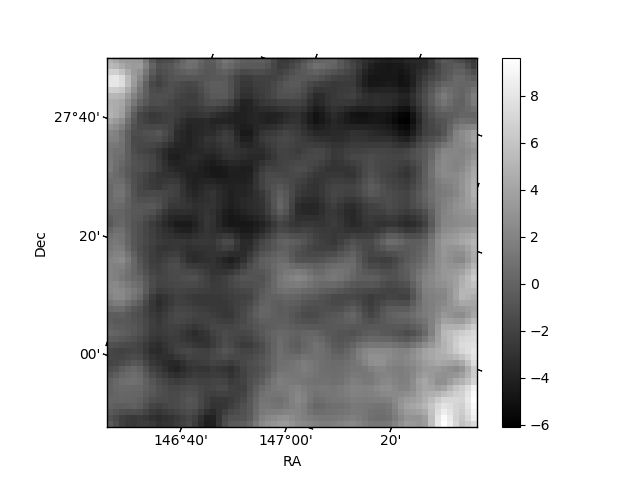
Histogram calculated using DETX and DETY for each event in the final _common_clean file
| Quadrant A | 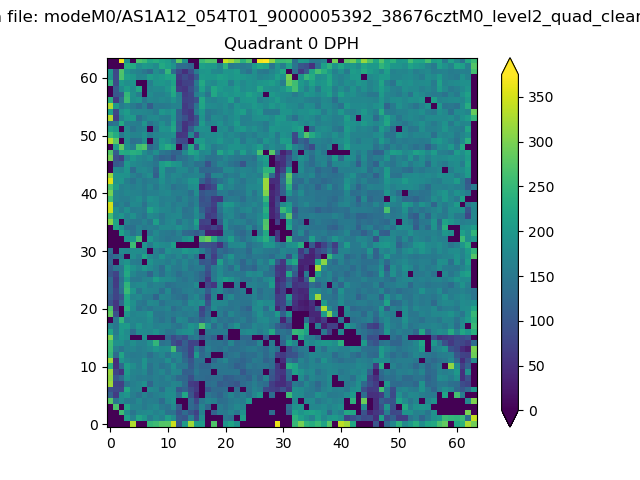 |
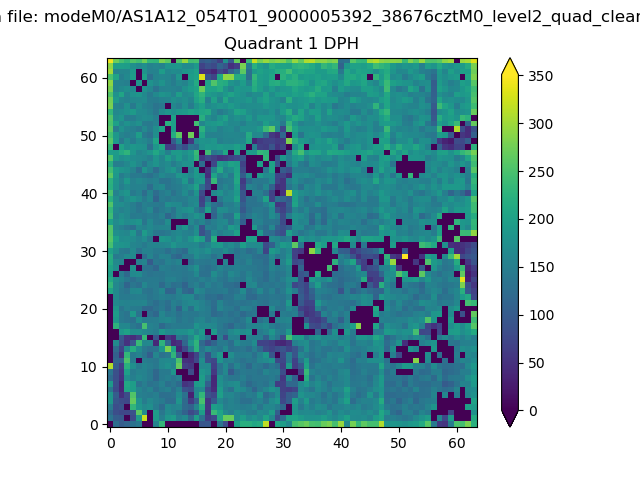 |
Quadrant B |
|---|---|---|---|
| Quadrant D | 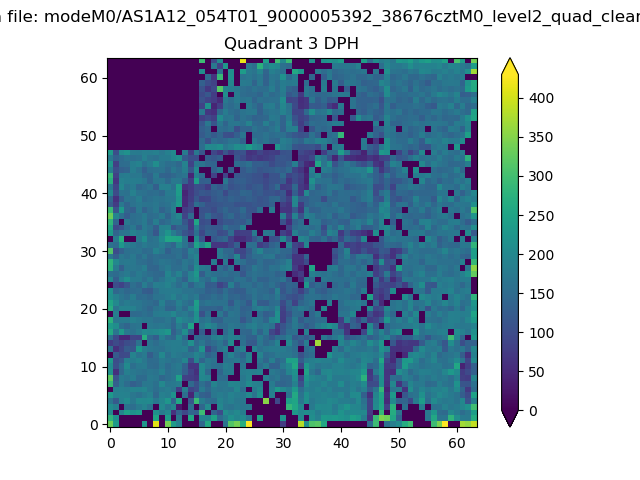 |
 |
Quadrant C |
| Plot type | Count rate plots | Images |
|---|---|---|
| Comparison with Poisson distribution Blue bars denote a histogram of data divided into 1 sec bins. Red curve is a Poisson curve with rate = median count rate of data. |
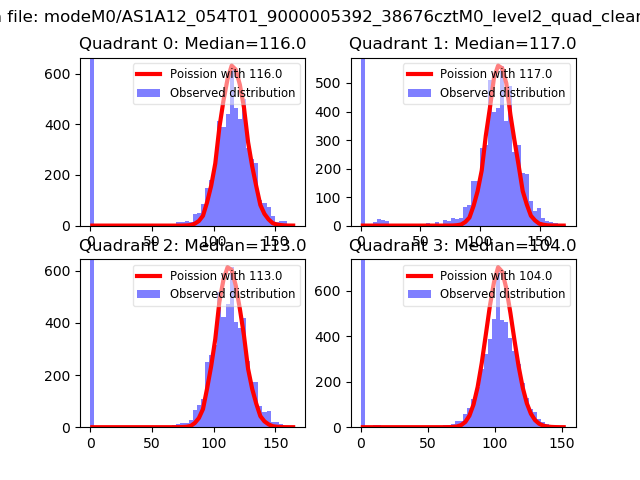 |
 |
| Quadrant-wise count rates Data is divided into 100 sec bins |
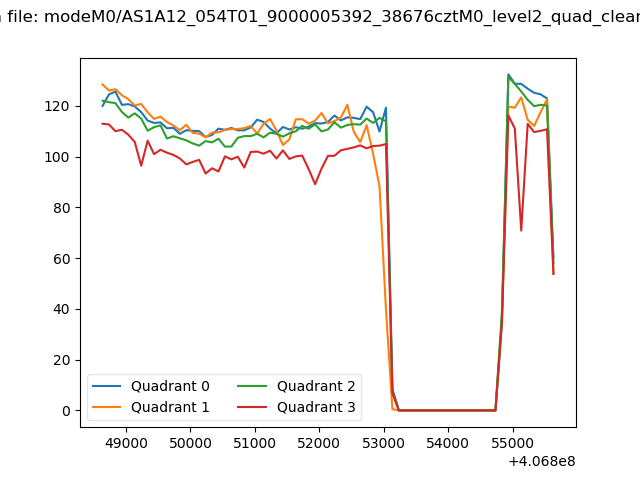 |
|
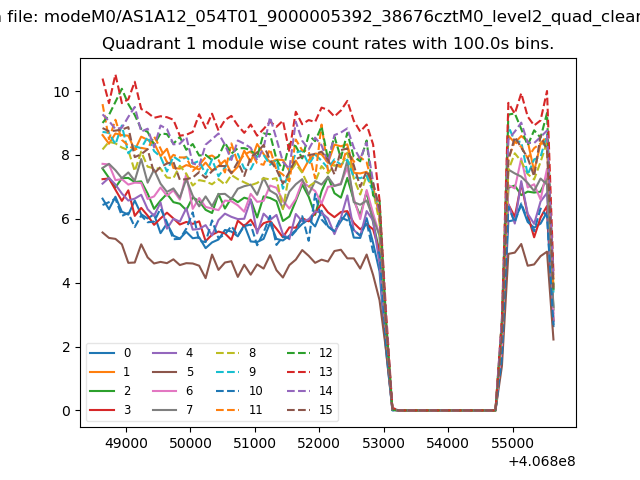
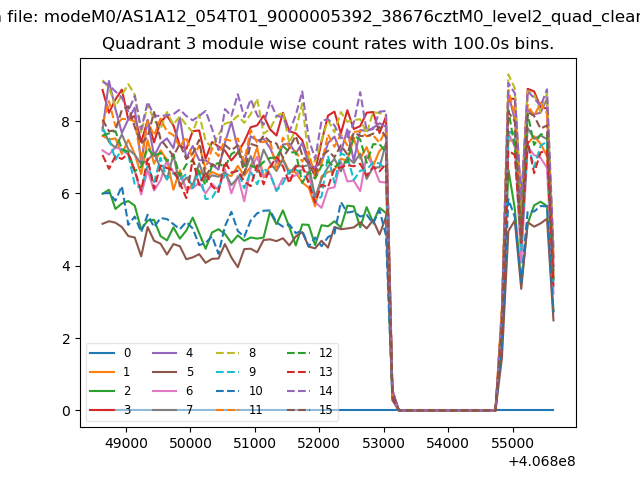
| Module-wise count rates for Quadrant A Data is divided into 100 sec bins |
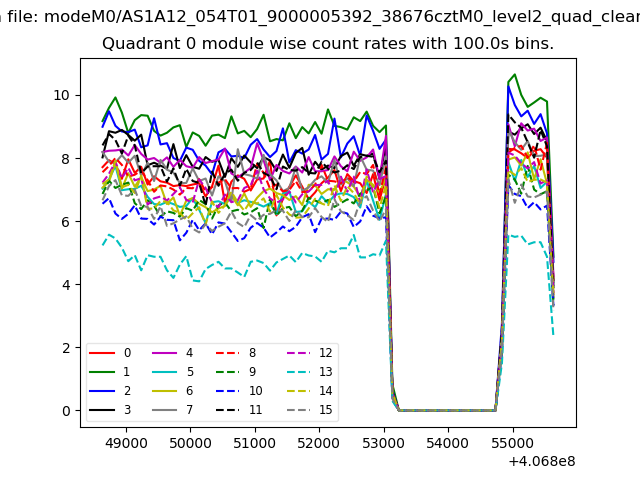 |
 |
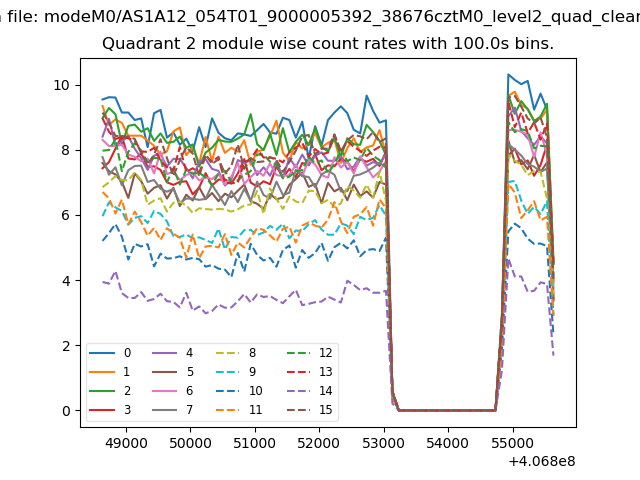
| Module-wise count rates for Quadrant B Data is divided into 100 sec bins |
 |
 |
| Module-wise count rates for Quadrant C Data is divided into 100 sec bins |
 |
 |
| Module-wise count rates for Quadrant D Data is divided into 100 sec bins |
 |
 |
| Parameter | Plot |
|---|---|
| CZT HV Monitor | 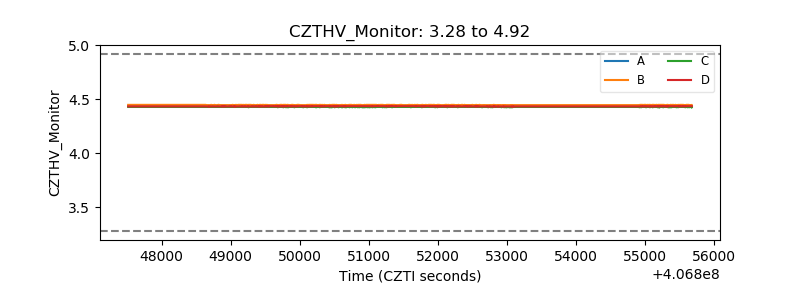 |
| D_VDD | 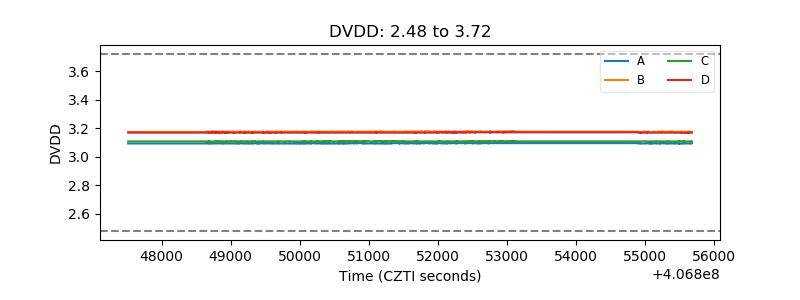 |
| Temperature 1 | 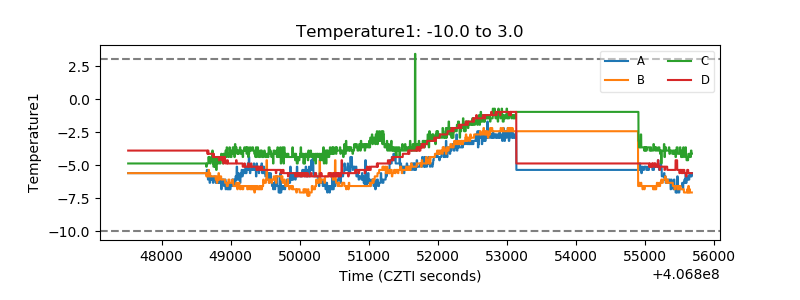 |
| Veto HV Monitor | 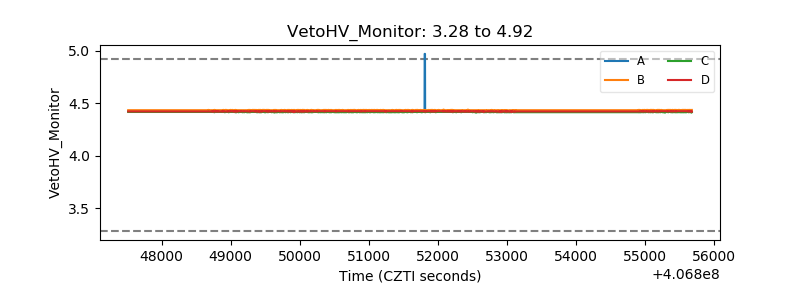 |
| Veto LLD | 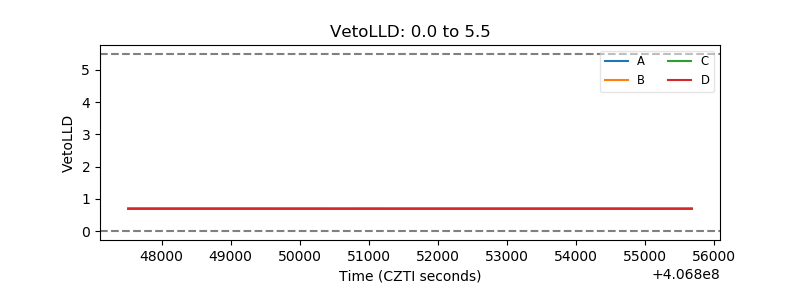 |
| Alpha Counter | 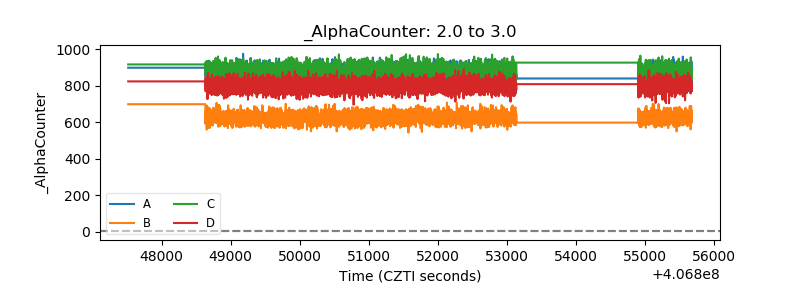 |
| _CPM_Rate | 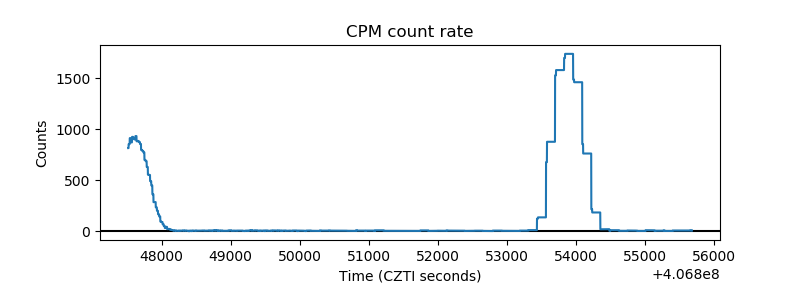 |
| CZT Counter | 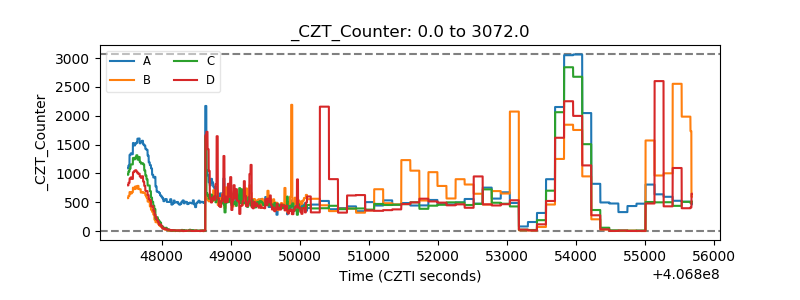 |
| +2.5 Volts monitor | 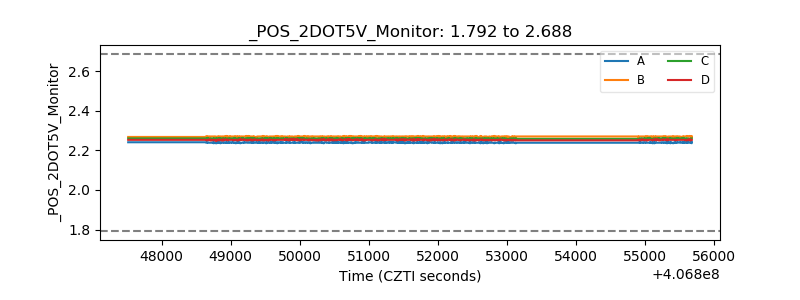 |
| +5 Volts monitor | 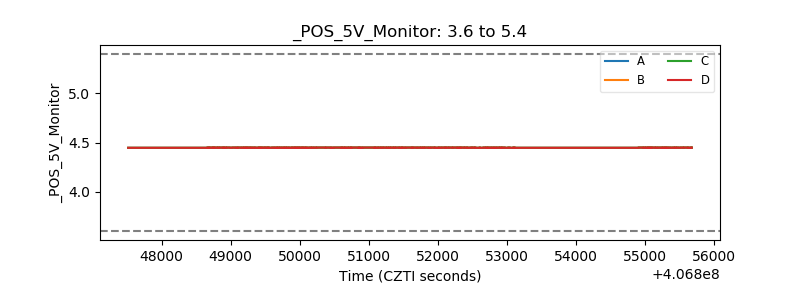 |
| _ROLL_ROT | 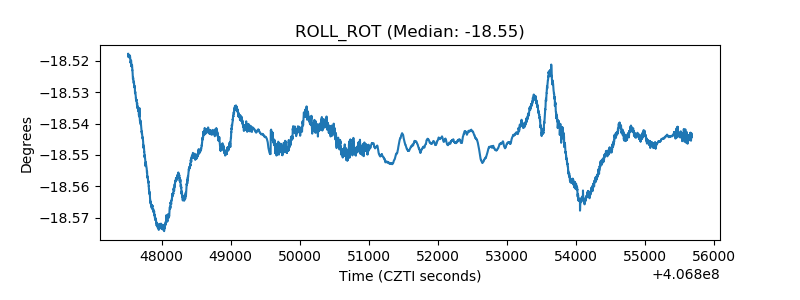 |
| _Roll_DEC | 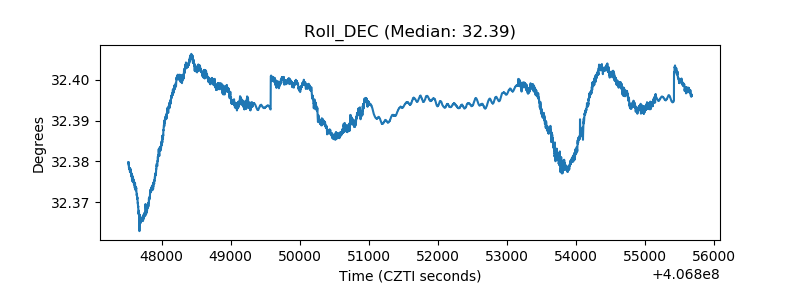 |
| _Roll_RA | 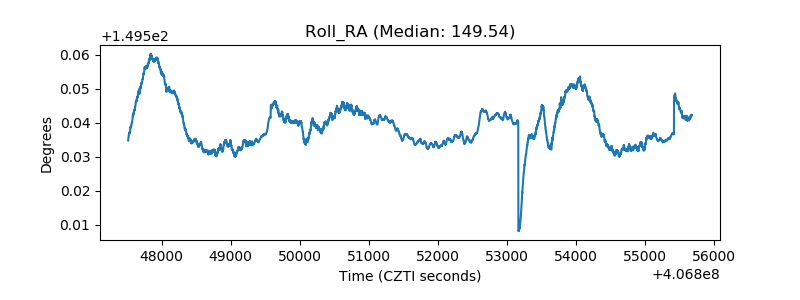 |
| Veto Counter | 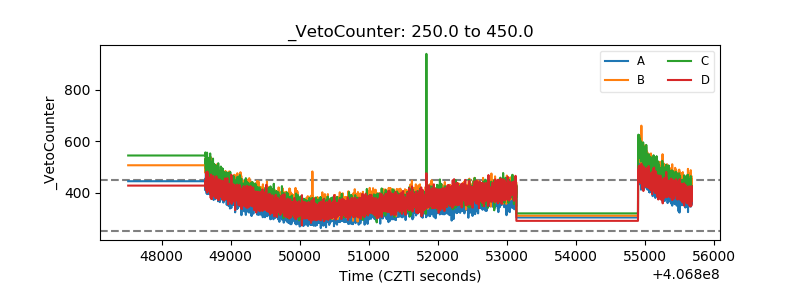 |