| Param | Original file | Final file |
|---|---|---|
| Filename | modeM0/AS1A12_054T01_9000005392_38677cztM0_level2.fits | modeM0/AS1A12_054T01_9000005392_38677cztM0_level2_quad_clean.evt |
| Size (bytes) | 388,290,240 | 95,996,160 |
| Size | 370.3 MB | 91.5 MB |
| Events in quadrant A | 2,876,107 | 664,458 |
| Events in quadrant B | 5,416,094 | 630,724 |
| Events in quadrant C | 2,716,660 | 645,458 |
| Events in quadrant D | 2,935,649 | 580,728 |
| Mode M9 | |||
|---|---|---|---|
| Quadrant | BADHDUFLAG | Total packets | Discarded packets |
| A | 0 | 32 | 0 |
| B | 0 | 32 | 0 |
| C | 0 | 32 | 0 |
| D | 0 | 33 | 0 |
| Mode SS | |||
|---|---|---|---|
| Quadrant | BADHDUFLAG | Total packets | Discarded packets |
| A | 0 | 112 | 0 |
| B | 0 | 112 | 0 |
| C | 0 | 112 | 0 |
| D | 0 | 112 | 0 |
| Mode M0 | |||
|---|---|---|---|
| Quadrant | BADHDUFLAG | Total packets | Discarded packets |
| A | 0 | 11951 | 3 |
| B | 0 | 19737 | 2 |
| C | 0 | 11507 | 2 |
| D | 0 | 12695 | 2 |
| Quadrant | Total seconds | Saturated seconds | Saturation percentage |
|---|---|---|---|
| A | 5509 | 22 | 0.399347% |
| B | 5509 | 689 | 12.506807% |
| C | 5509 | 11 | 0.199673% |
| D | 5509 | 143 | 2.595752% |
Noise dominated data is calculated using 1-second bins in cleaned event files. If a bin has >2000 counts, and if more than 50% of those come from <1% of pixels, then it is considered to be noise-dominated and hence unusable.
| Quadrant | # 1 sec bins | Bins with >0 counts | Bins with >2000 counts | High rate bins dominated by noise | Noise dominated (total time) | Noise dominated (detector-on time) | Marked lightcurve |
|---|---|---|---|---|---|---|---|
| A | 7391 | 5510 | 12 | 12 | 0.16% | 0.22% | 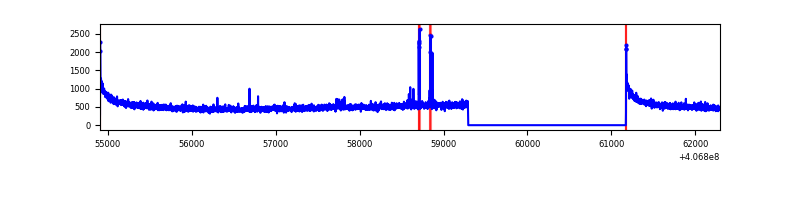 |
| B | 7391 | 5510 | 489 | 489 | 6.62% | 8.87% | 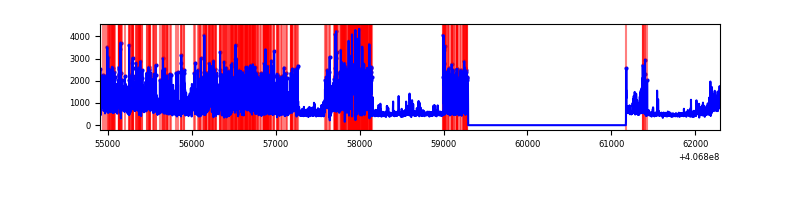 |
| C | 7391 | 5510 | 5 | 5 | 0.07% | 0.09% | 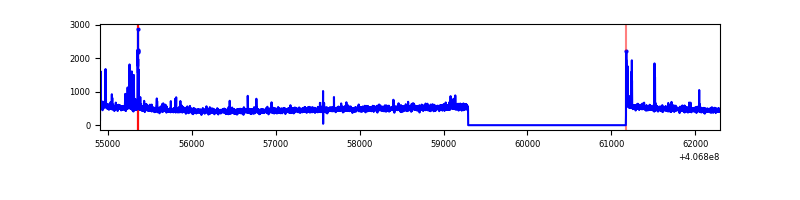 |
| D | 7391 | 5510 | 113 | 113 | 1.53% | 2.05% | 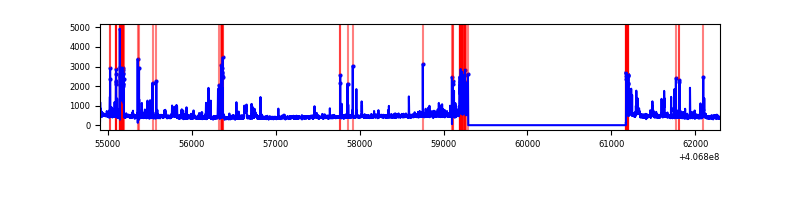 |
Top three noisy pixels from each quadrant. If the there are fewer than three noisy pixels in the level2.evt file, extra rows are filled as -1
| Pixel properties | Quadrant properties | ||||||
|---|---|---|---|---|---|---|---|
| Quadrant | DetID | PixID | Counts | Sigma | Mean | Median | Sigma |
| A | 10 | 83 | 404284 | 3189.7 | 626 | 616 | 126.6 |
| A | 15 | 174 | 30099 | 232.97 | 626 | 616 | 126.6 |
| A | 13 | 248 | 16301 | 123.94 | 626 | 616 | 126.6 |
| B | 4 | 251 | 2865648 | 24459.85 | 601 | 584 | 117.1 |
| B | 4 | 171 | 149399 | 1270.48 | 601 | 584 | 117.1 |
| B | 0 | 230 | 15587 | 128.08 | 601 | 584 | 117.1 |
| C | 15 | 214 | 223772 | 1567.26 | 610 | 613 | 142.4 |
| C | 15 | 208 | 64848 | 451.13 | 610 | 613 | 142.4 |
| C | 0 | 10 | 24889 | 170.49 | 610 | 613 | 142.4 |
| D | 10 | 118 | 221577 | 1532.58 | 596 | 578 | 144.2 |
| D | 13 | 249 | 173271 | 1197.59 | 596 | 578 | 144.2 |
| D | 2 | 250 | 78355 | 539.37 | 596 | 578 | 144.2 |
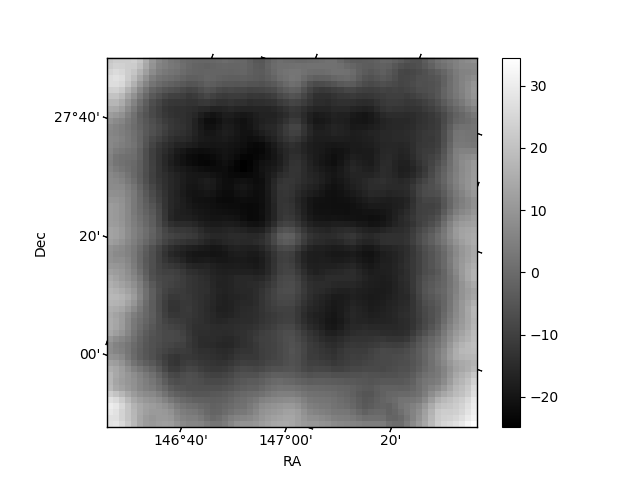
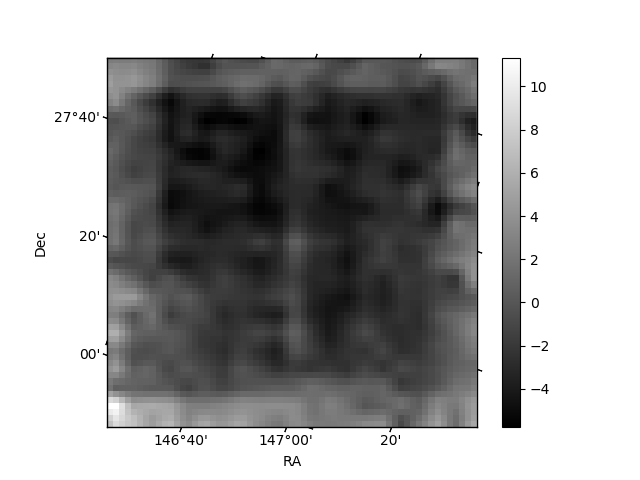
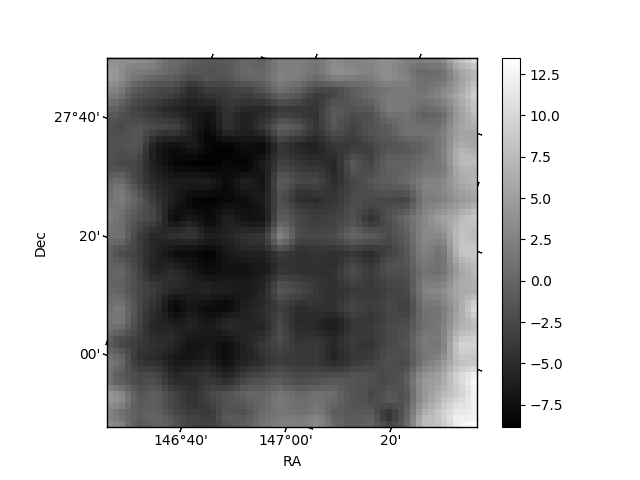
Histogram calculated using DETX and DETY for each event in the final _common_clean file
| Quadrant A | 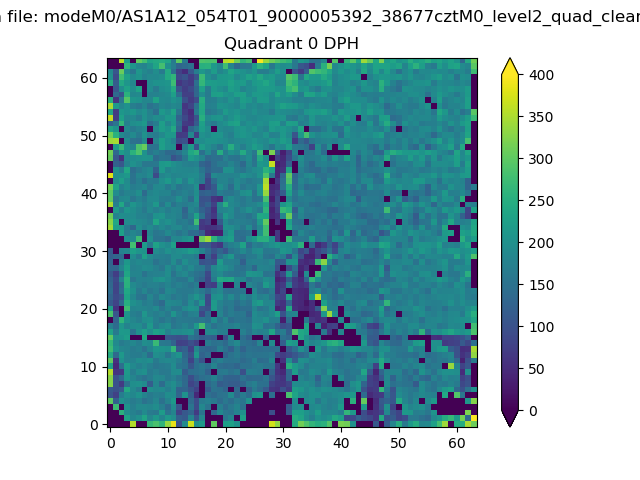 |
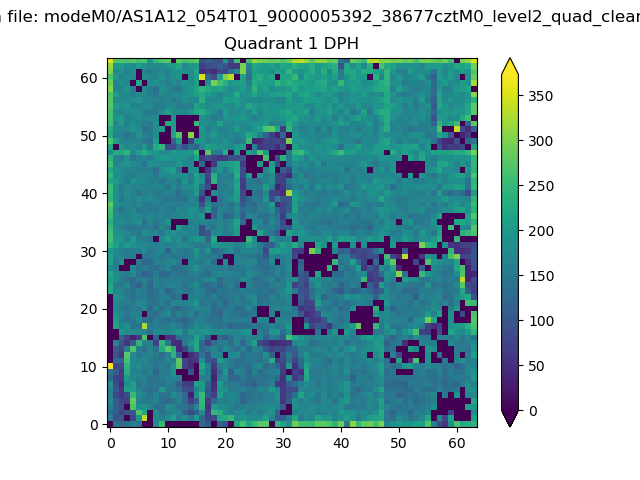 |
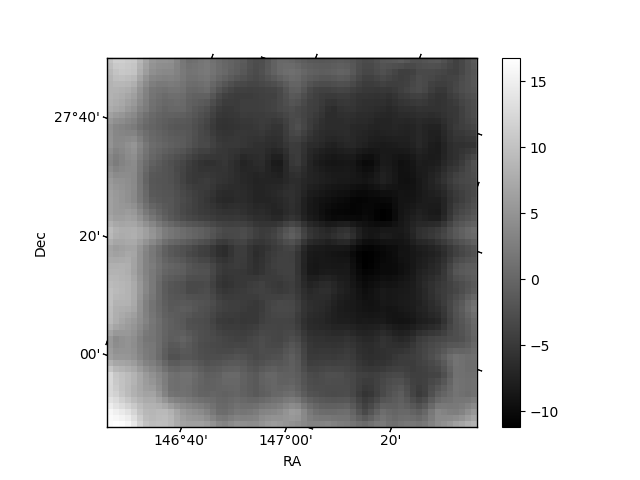
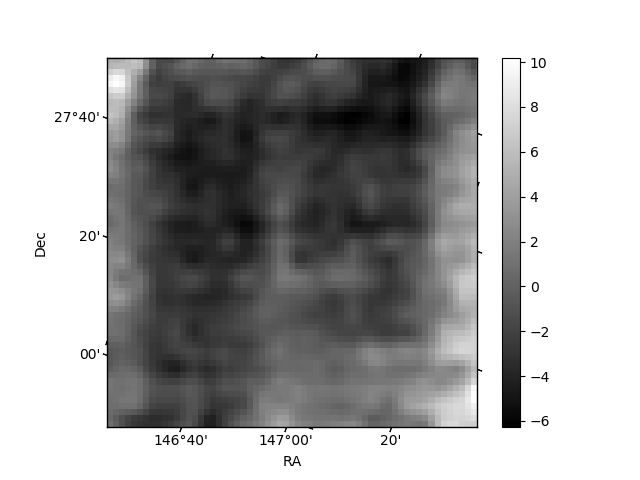
Quadrant B |
|---|---|---|---|
| Quadrant D | 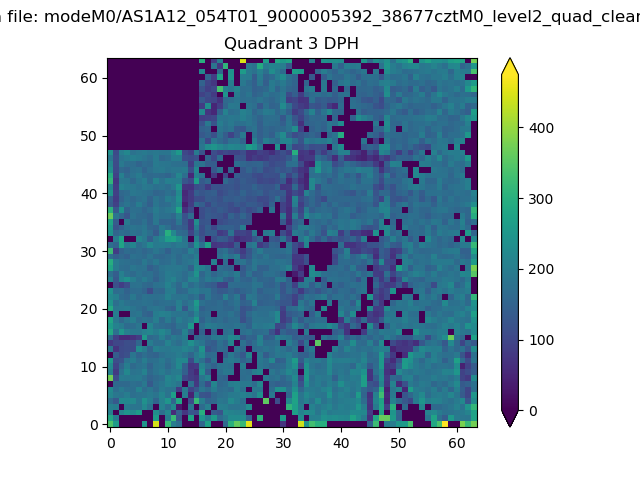 |
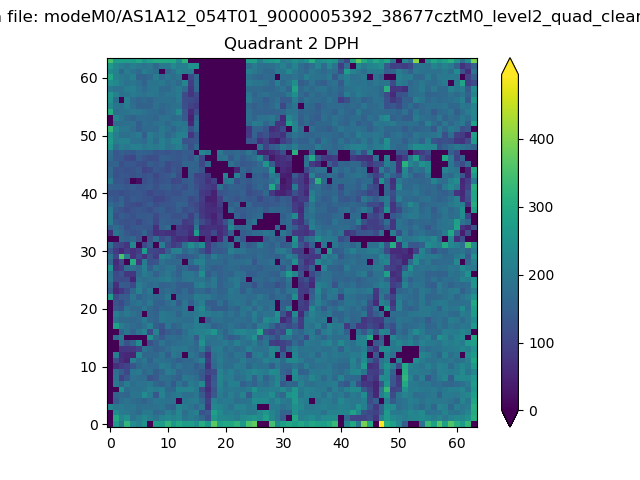 |
Quadrant C |
| Plot type | Count rate plots | Images |
|---|---|---|
| Comparison with Poisson distribution Blue bars denote a histogram of data divided into 1 sec bins. Red curve is a Poisson curve with rate = median count rate of data. |
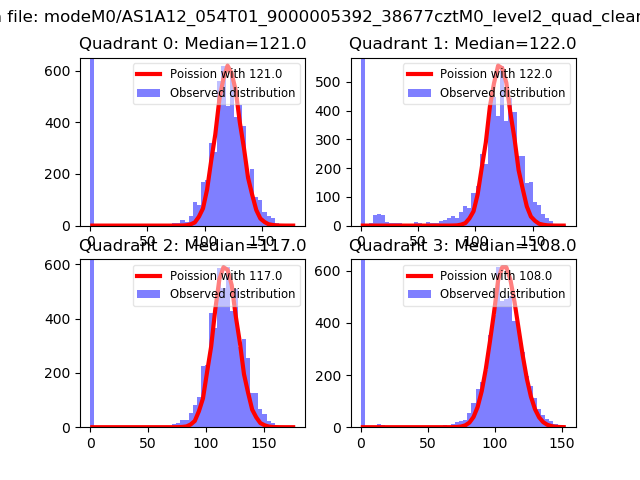 |
 |
| Quadrant-wise count rates Data is divided into 100 sec bins |
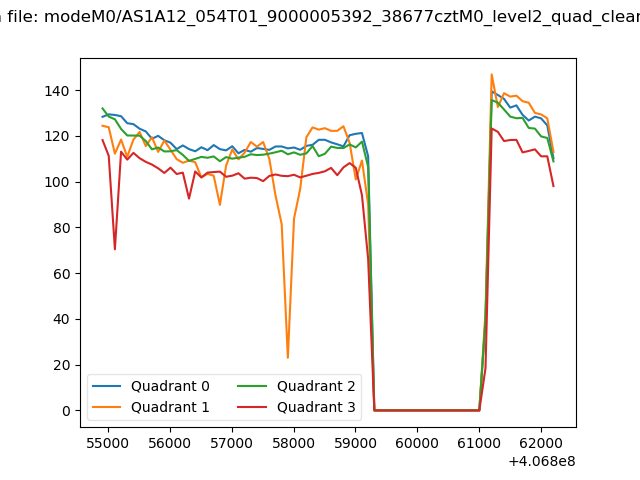 |
|
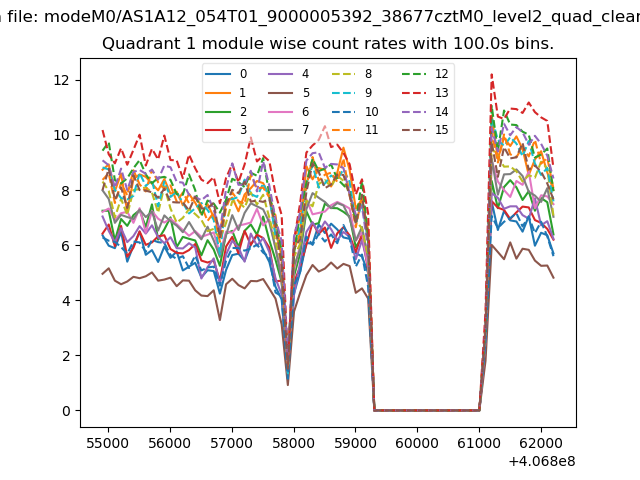
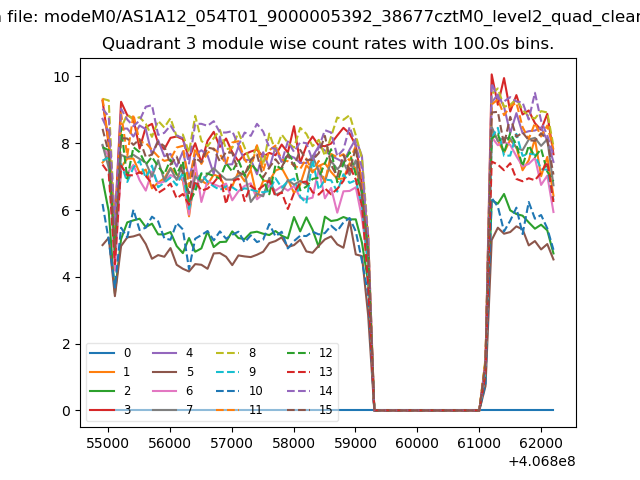
| Module-wise count rates for Quadrant A Data is divided into 100 sec bins |
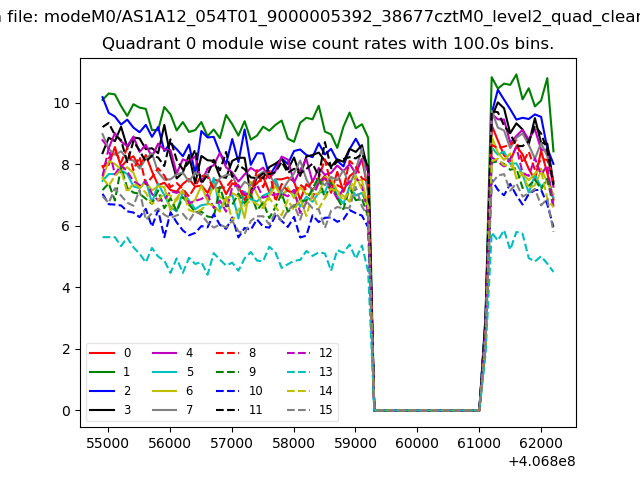 |
 |
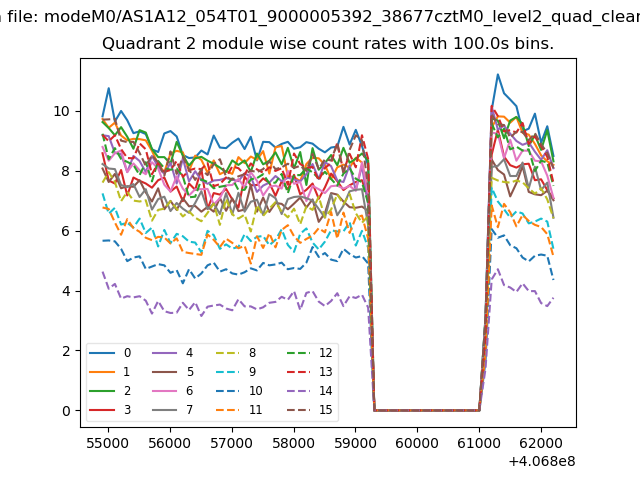
| Module-wise count rates for Quadrant B Data is divided into 100 sec bins |
 |
 |
| Module-wise count rates for Quadrant C Data is divided into 100 sec bins |
 |
 |
| Module-wise count rates for Quadrant D Data is divided into 100 sec bins |
 |
 |
| Parameter | Plot |
|---|---|
| CZT HV Monitor | 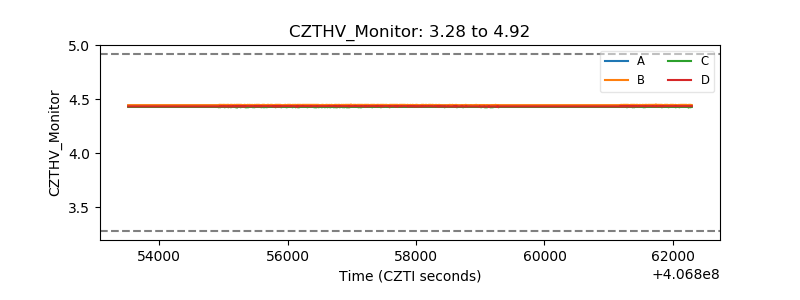 |
| D_VDD | 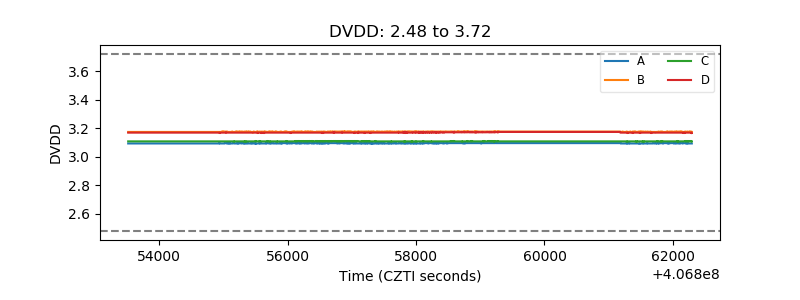 |
| Temperature 1 | 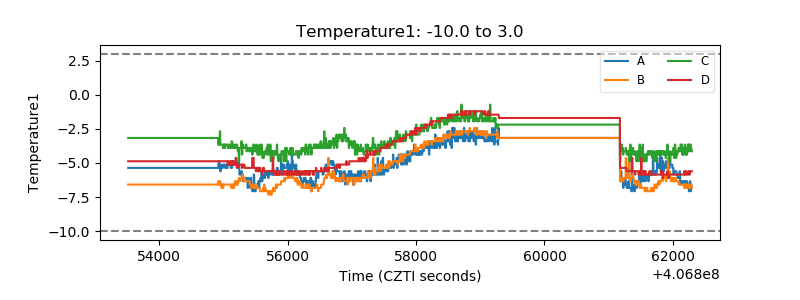 |
| Veto HV Monitor | 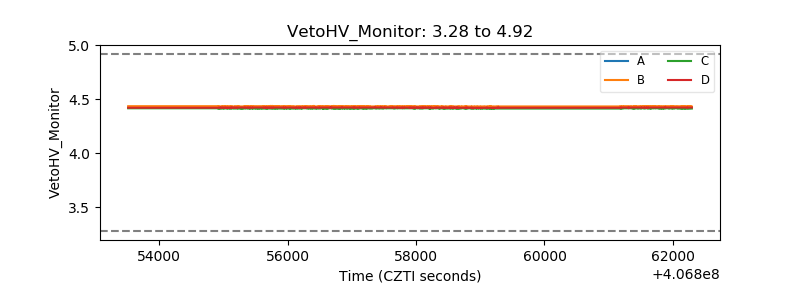 |
| Veto LLD | 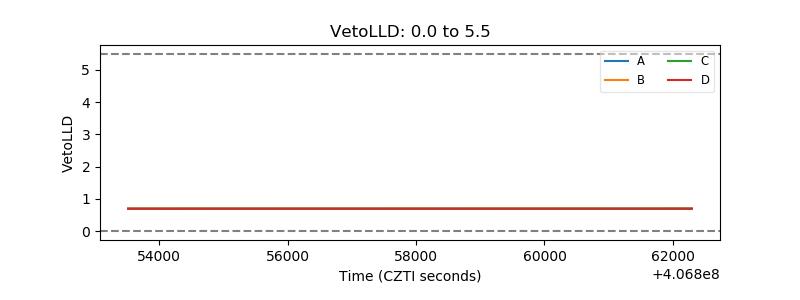 |
| Alpha Counter | 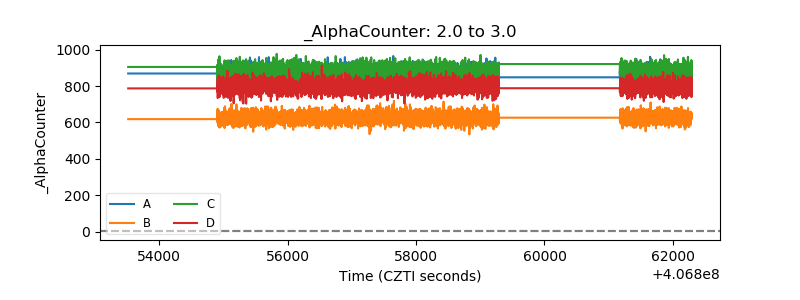 |
| _CPM_Rate | 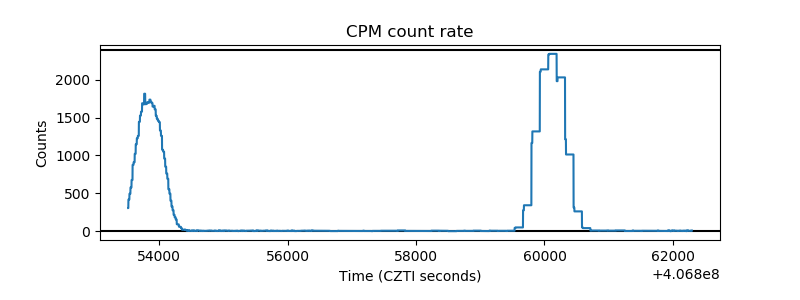 |
| CZT Counter | 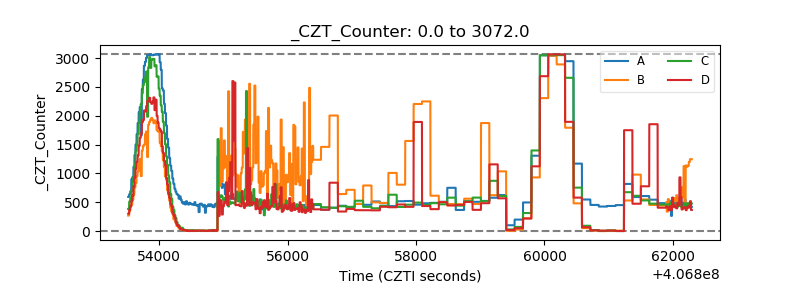 |
| +2.5 Volts monitor |  |
| +5 Volts monitor | 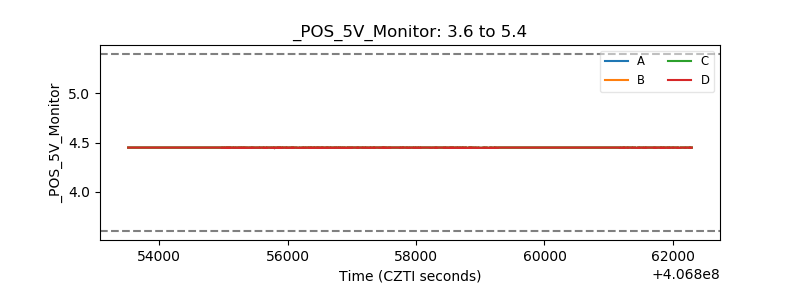 |
| _ROLL_ROT | 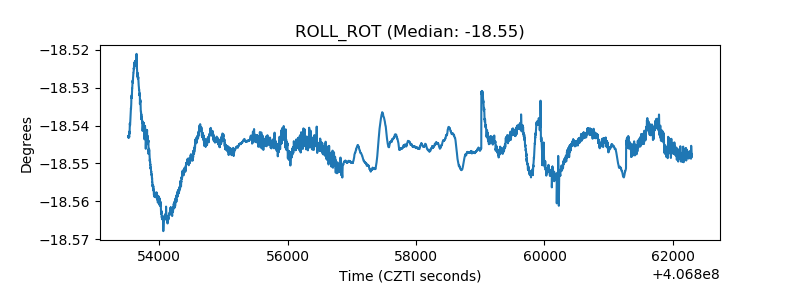 |
| _Roll_DEC | 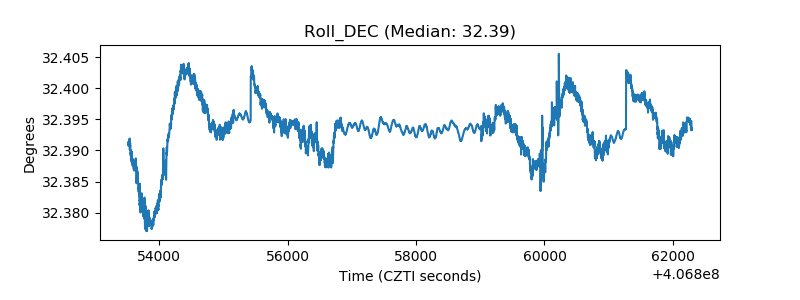 |
| _Roll_RA | 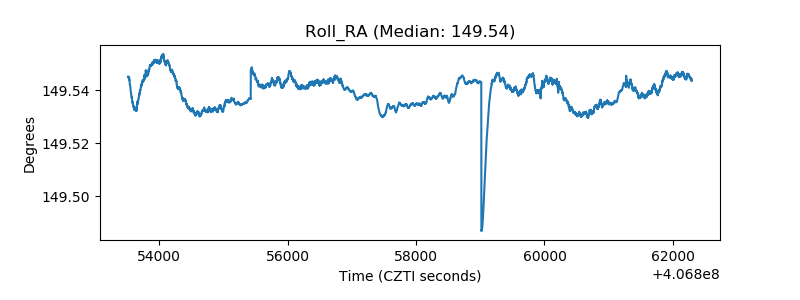 |
| Veto Counter | 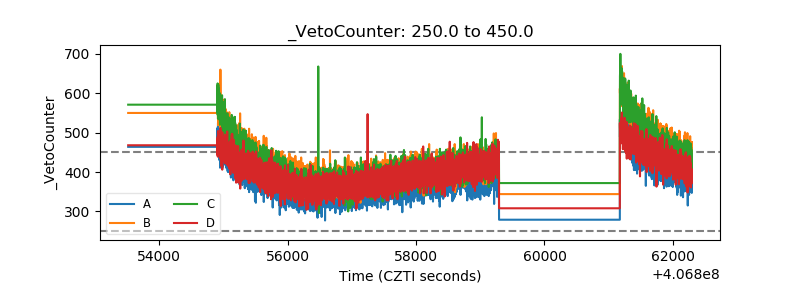 |