| Param | Original file | Final file |
|---|---|---|
| Filename | modeM0/AS1A12_054T01_9000005392_38678cztM0_level2.fits | modeM0/AS1A12_054T01_9000005392_38678cztM0_level2_quad_clean.evt |
| Size (bytes) | 341,614,080 | 97,554,240 |
| Size | 325.8 MB | 93.0 MB |
| Events in quadrant A | 2,952,438 | 667,135 |
| Events in quadrant B | 2,895,217 | 689,571 |
| Events in quadrant C | 2,851,185 | 646,789 |
| Events in quadrant D | 3,530,632 | 576,218 |
| Mode M9 | |||
|---|---|---|---|
| Quadrant | BADHDUFLAG | Total packets | Discarded packets |
| A | 0 | 27 | 0 |
| B | 0 | 27 | 0 |
| C | 0 | 27 | 0 |
| D | 0 | 28 | 0 |
| Mode SS | |||
|---|---|---|---|
| Quadrant | BADHDUFLAG | Total packets | Discarded packets |
| A | 0 | 110 | 0 |
| B | 0 | 110 | 0 |
| C | 0 | 110 | 0 |
| D | 0 | 110 | 0 |
| Mode M0 | |||
|---|---|---|---|
| Quadrant | BADHDUFLAG | Total packets | Discarded packets |
| A | 0 | 12028 | 3 |
| B | 0 | 12017 | 2 |
| C | 0 | 11656 | 2 |
| D | 0 | 14153 | 2 |
| Quadrant | Total seconds | Saturated seconds | Saturation percentage |
|---|---|---|---|
| A | 5343 | 30 | 0.561482% |
| B | 5343 | 28 | 0.524050% |
| C | 5343 | 30 | 0.561482% |
| D | 5343 | 203 | 3.799364% |
Noise dominated data is calculated using 1-second bins in cleaned event files. If a bin has >2000 counts, and if more than 50% of those come from <1% of pixels, then it is considered to be noise-dominated and hence unusable.
| Quadrant | # 1 sec bins | Bins with >0 counts | Bins with >2000 counts | High rate bins dominated by noise | Noise dominated (total time) | Noise dominated (detector-on time) | Marked lightcurve |
|---|---|---|---|---|---|---|---|
| A | 7346 | 5344 | 18 | 18 | 0.25% | 0.34% | 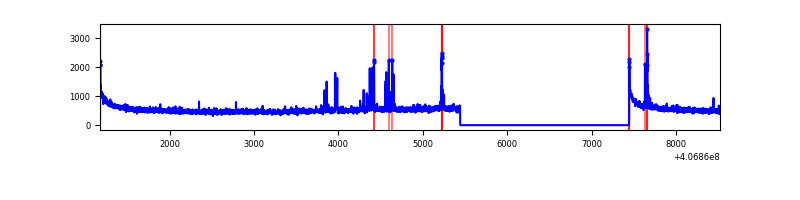 |
| B | 7346 | 5344 | 12 | 12 | 0.16% | 0.22% | 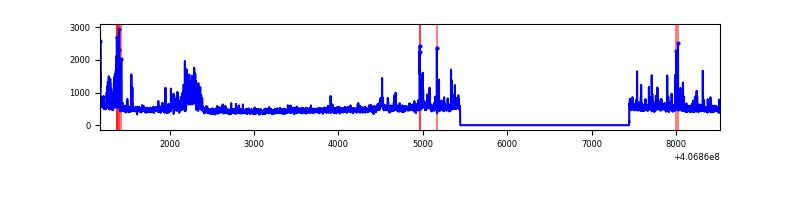 |
| C | 7346 | 5344 | 38 | 38 | 0.52% | 0.71% | 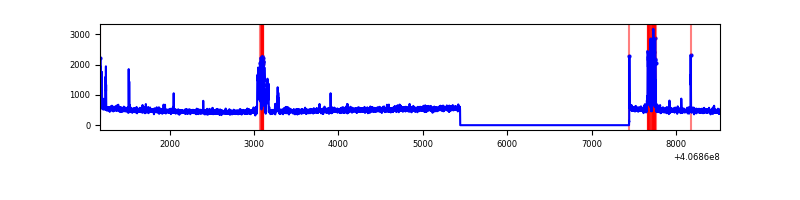 |
| D | 7346 | 5344 | 173 | 173 | 2.36% | 3.24% | 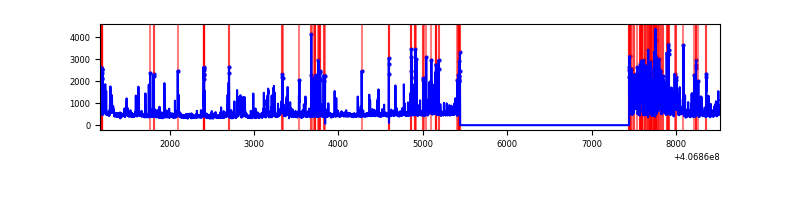 |
Top three noisy pixels from each quadrant. If the there are fewer than three noisy pixels in the level2.evt file, extra rows are filled as -1
| Pixel properties | Quadrant properties | ||||||
|---|---|---|---|---|---|---|---|
| Quadrant | DetID | PixID | Counts | Sigma | Mean | Median | Sigma |
| A | 10 | 83 | 397679 | 3184.28 | 622 | 611 | 124.7 |
| A | 13 | 248 | 111684 | 890.75 | 622 | 611 | 124.7 |
| A | 15 | 174 | 23817 | 186.1 | 622 | 611 | 124.7 |
| B | 4 | 251 | 356753 | 3036.48 | 620 | 605 | 117.3 |
| B | 4 | 171 | 38156 | 320.16 | 620 | 605 | 117.3 |
| B | 15 | 85 | 18712 | 154.38 | 620 | 605 | 117.3 |
| C | 15 | 214 | 218120 | 1550.8 | 604 | 606 | 140.3 |
| C | 3 | 110 | 129139 | 916.4 | 604 | 606 | 140.3 |
| C | 15 | 208 | 116001 | 822.73 | 604 | 606 | 140.3 |
| D | 10 | 118 | 620885 | 4340.19 | 588 | 570 | 142.9 |
| D | 12 | 227 | 192905 | 1345.72 | 588 | 570 | 142.9 |
| D | 13 | 249 | 102798 | 715.26 | 588 | 570 | 142.9 |
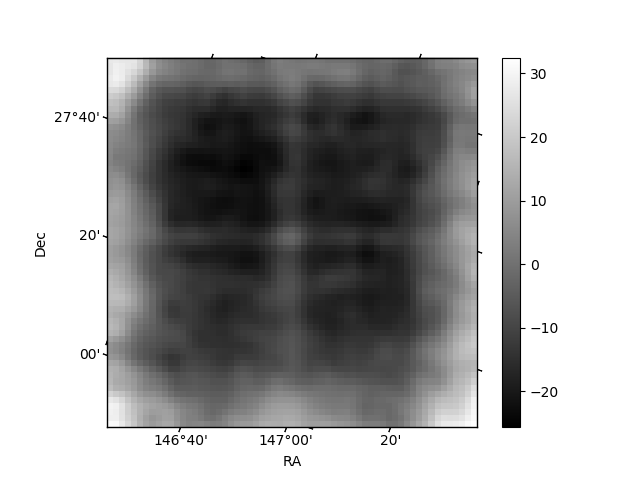
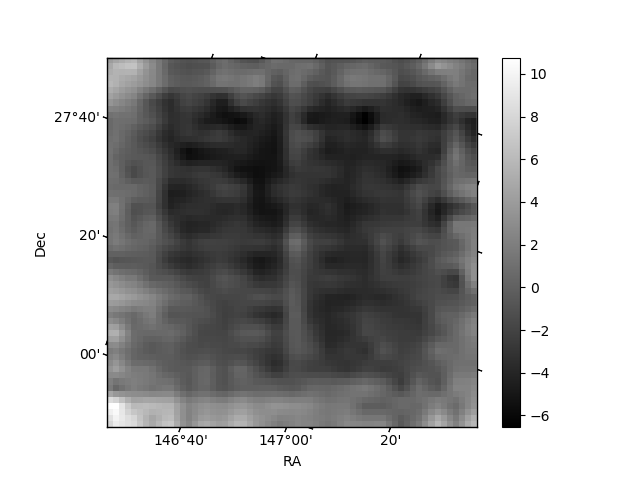
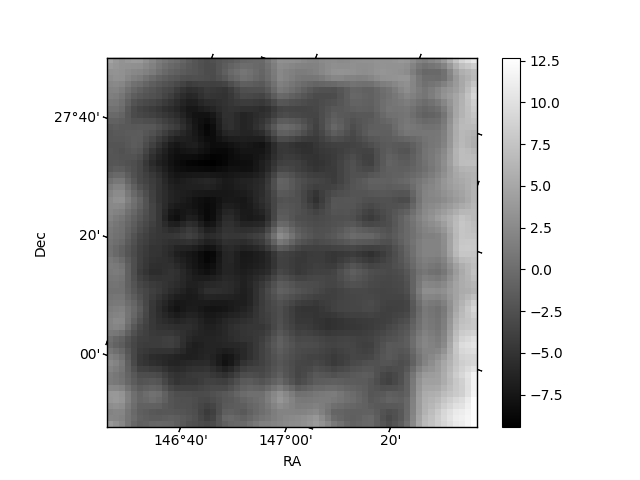
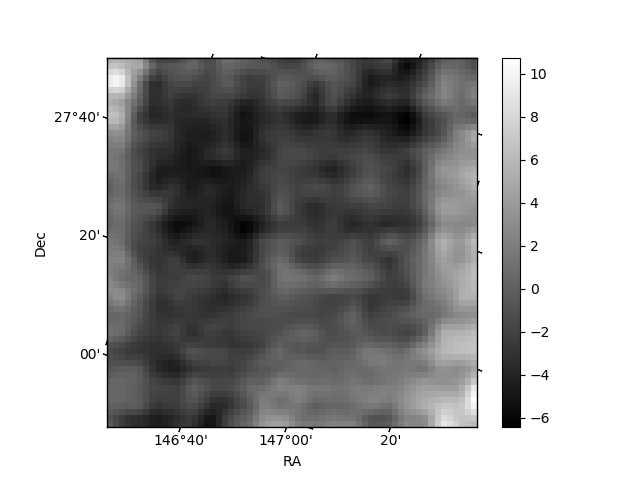
Histogram calculated using DETX and DETY for each event in the final _common_clean file
| Quadrant A | 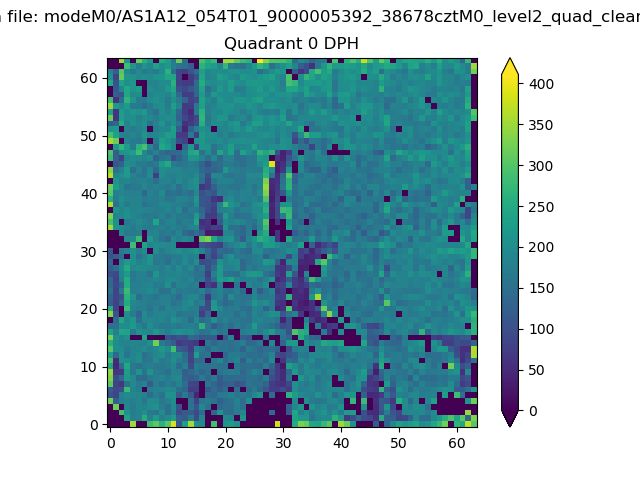 |
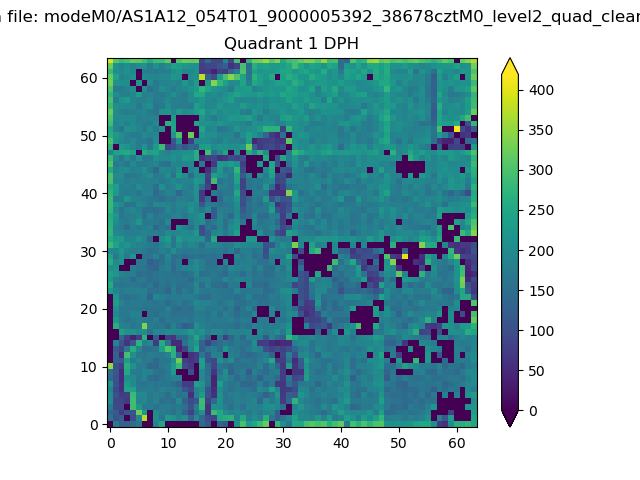 |
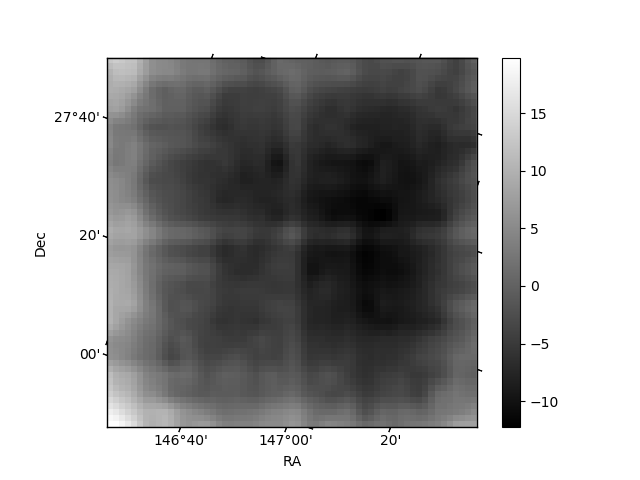
Quadrant B |
|---|---|---|---|
| Quadrant D | 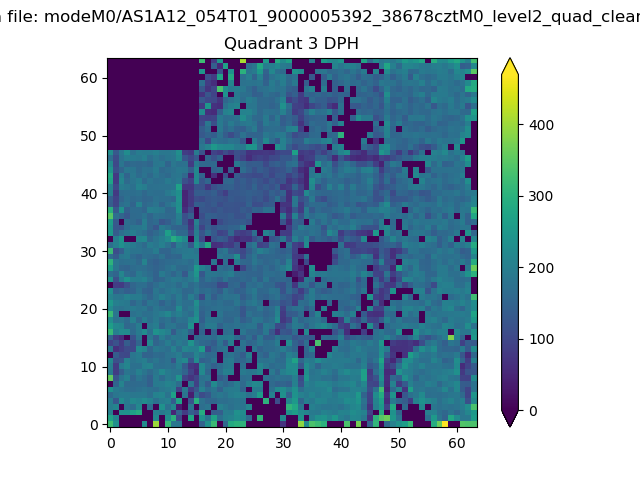 |
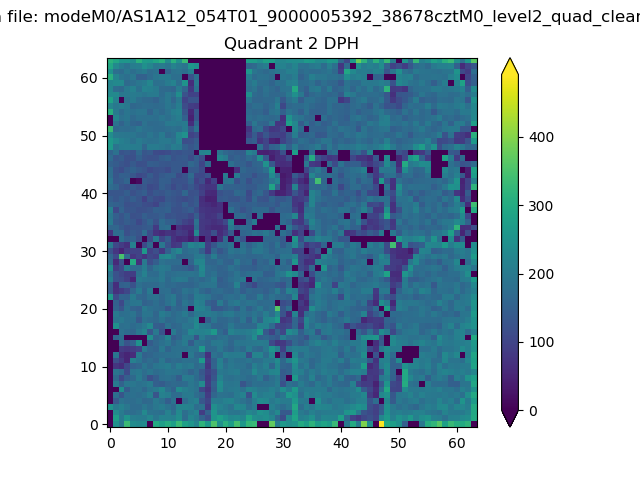 |
Quadrant C |
| Plot type | Count rate plots | Images |
|---|---|---|
| Comparison with Poisson distribution Blue bars denote a histogram of data divided into 1 sec bins. Red curve is a Poisson curve with rate = median count rate of data. |
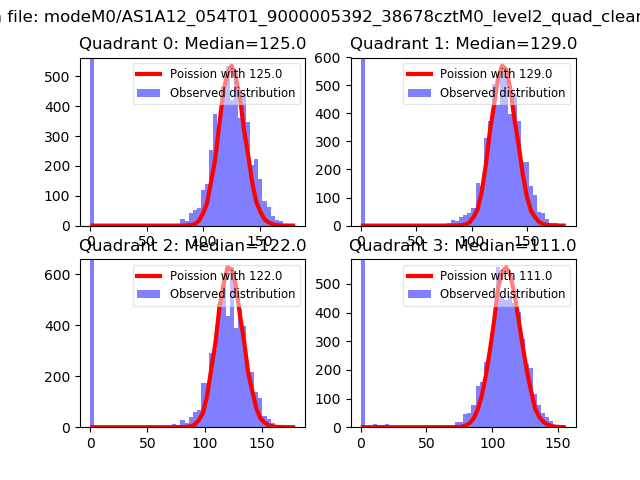 |
 |
| Quadrant-wise count rates Data is divided into 100 sec bins |
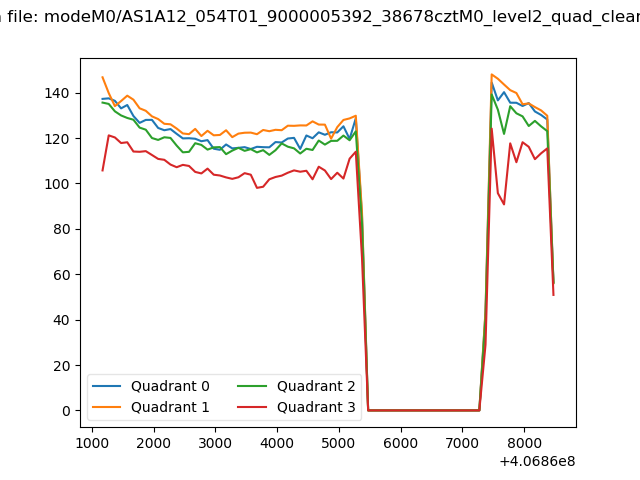 |
|
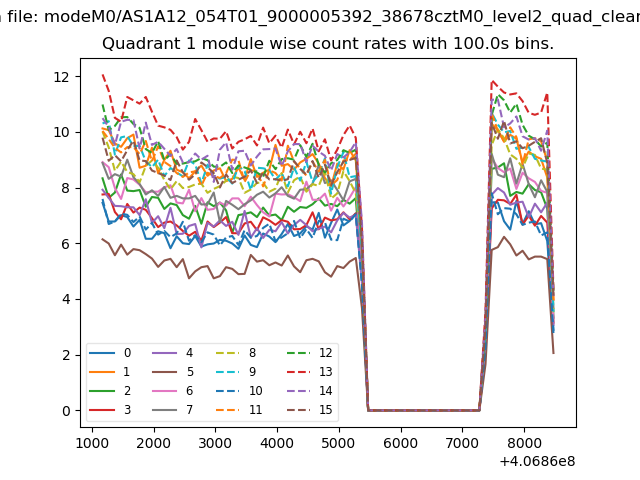
| Module-wise count rates for Quadrant A Data is divided into 100 sec bins |
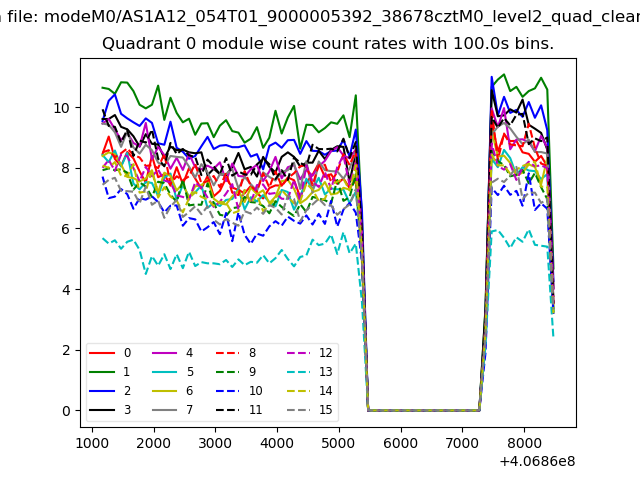 |
 |
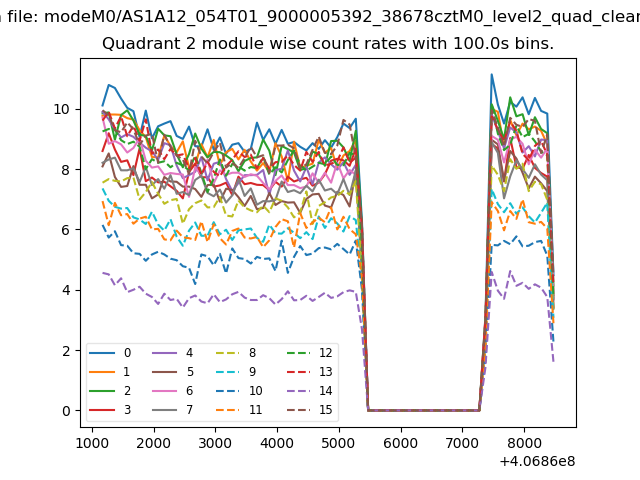
| Module-wise count rates for Quadrant B Data is divided into 100 sec bins |
 |
 |
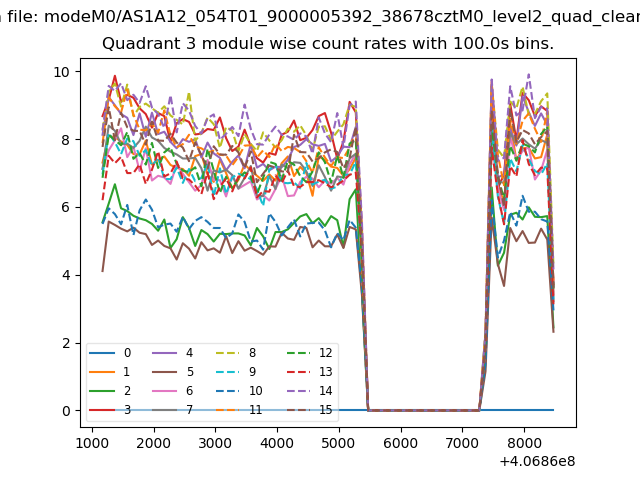
| Module-wise count rates for Quadrant C Data is divided into 100 sec bins |
 |
 |
| Module-wise count rates for Quadrant D Data is divided into 100 sec bins |
 |
 |
| Parameter | Plot |
|---|---|
| CZT HV Monitor | 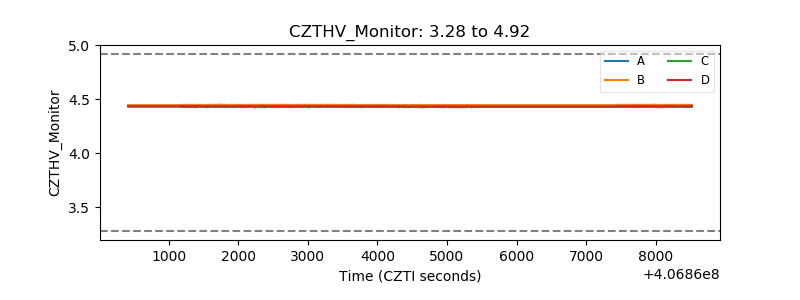 |
| D_VDD | 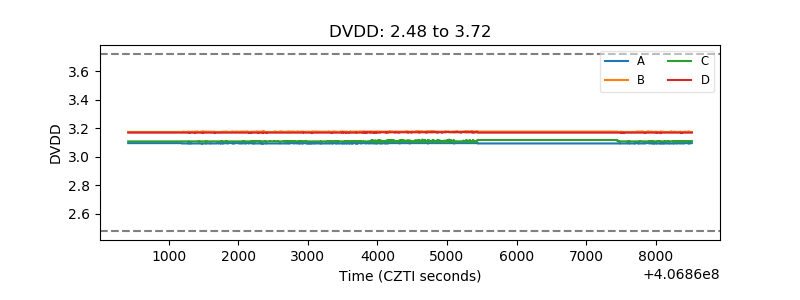 |
| Temperature 1 | 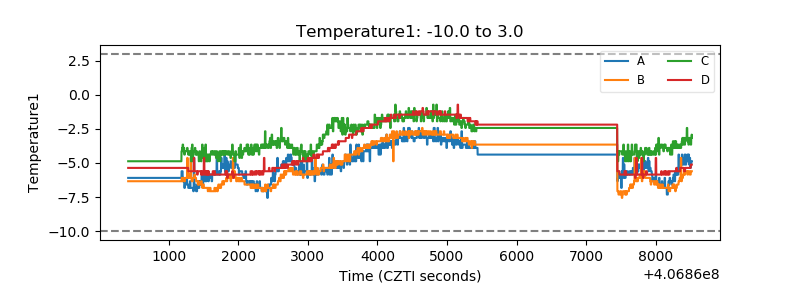 |
| Veto HV Monitor | 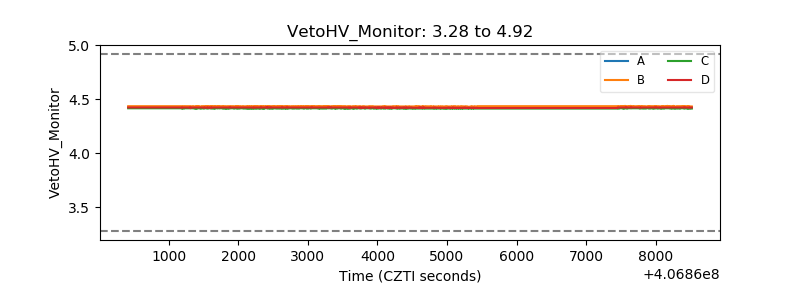 |
| Veto LLD | 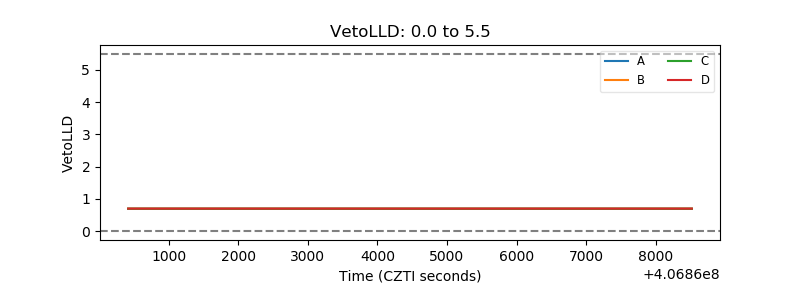 |
| Alpha Counter | 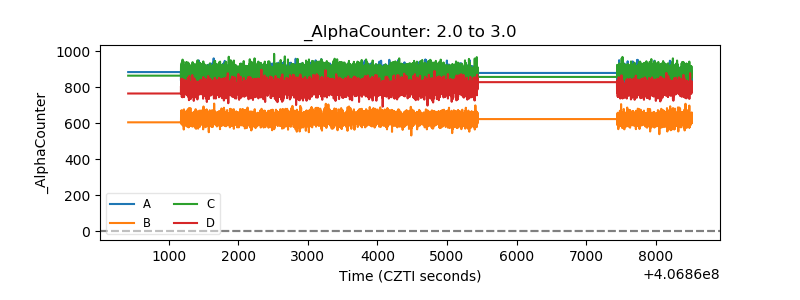 |
| _CPM_Rate | 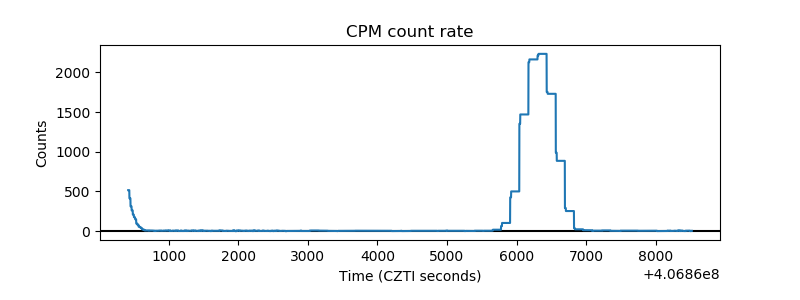 |
| CZT Counter | 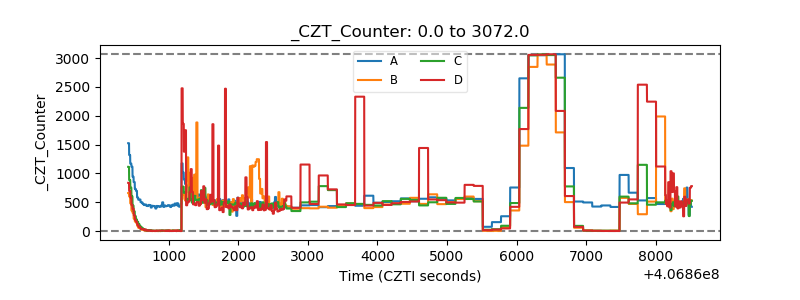 |
| +2.5 Volts monitor | 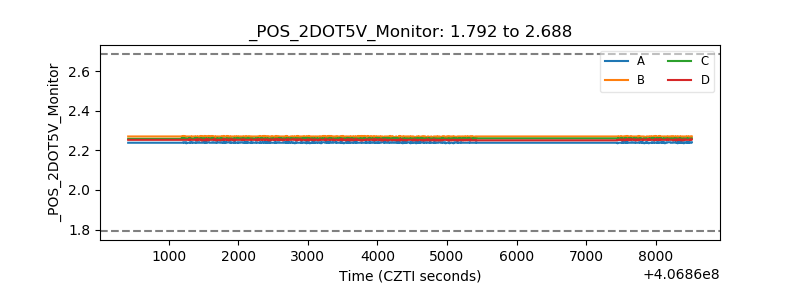 |
| +5 Volts monitor | 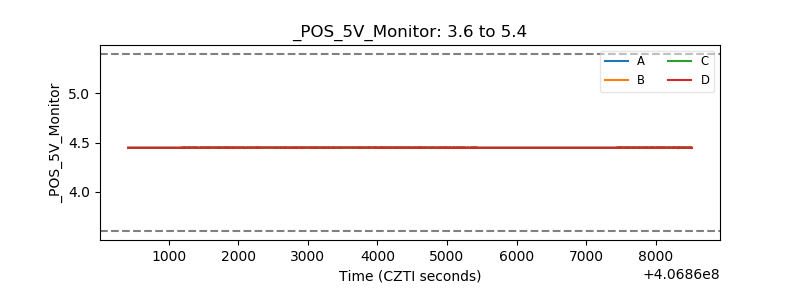 |
| _ROLL_ROT | 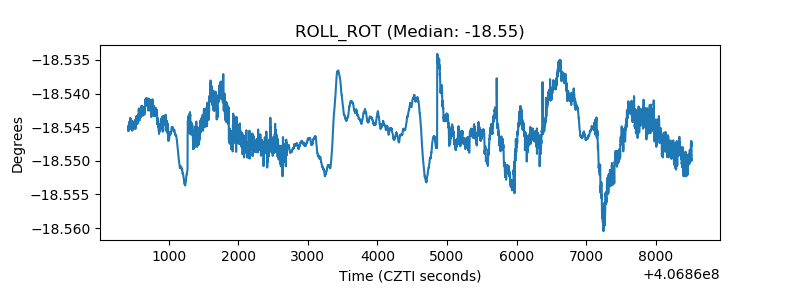 |
| _Roll_DEC | 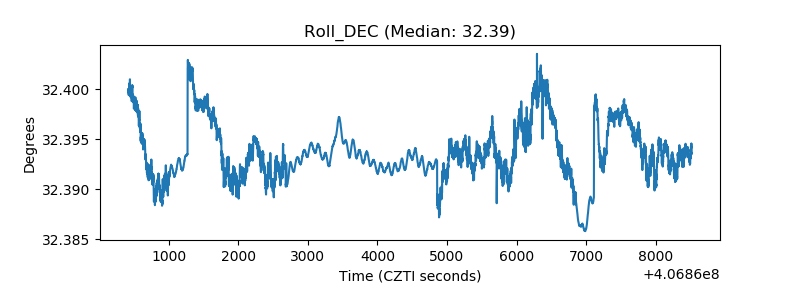 |
| _Roll_RA | 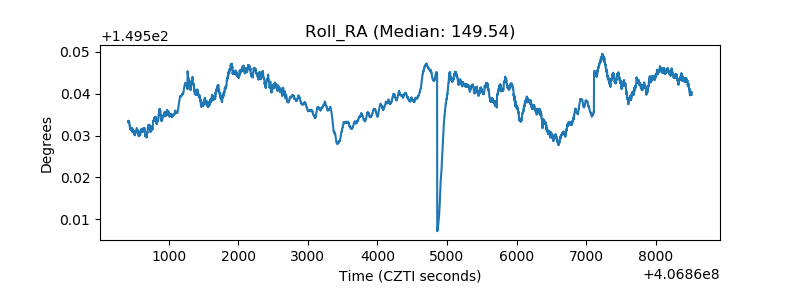 |
| Veto Counter | 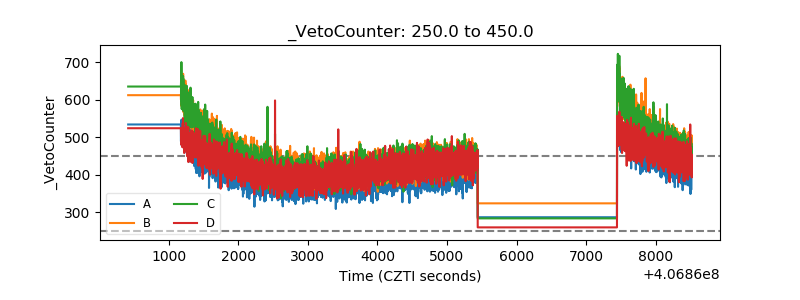 |