| Param | Original file | Final file |
|---|---|---|
| Filename | modeM0/AS1A12_054T01_9000005392_38679cztM0_level2.fits | modeM0/AS1A12_054T01_9000005392_38679cztM0_level2_quad_clean.evt |
| Size (bytes) | 346,083,840 | 95,578,560 |
| Size | 330.1 MB | 91.2 MB |
| Events in quadrant A | 2,941,920 | 659,991 |
| Events in quadrant B | 2,813,207 | 676,773 |
| Events in quadrant C | 2,735,991 | 633,712 |
| Events in quadrant D | 3,916,366 | 560,296 |
| Mode M9 | |||
|---|---|---|---|
| Quadrant | BADHDUFLAG | Total packets | Discarded packets |
| A | 0 | 31 | 0 |
| B | 0 | 31 | 0 |
| C | 0 | 31 | 0 |
| D | 0 | 32 | 0 |
| Mode SS | |||
|---|---|---|---|
| Quadrant | BADHDUFLAG | Total packets | Discarded packets |
| A | 0 | 108 | 0 |
| B | 0 | 108 | 0 |
| C | 0 | 108 | 0 |
| D | 0 | 108 | 0 |
| Mode M0 | |||
|---|---|---|---|
| Quadrant | BADHDUFLAG | Total packets | Discarded packets |
| A | 0 | 11897 | 3 |
| B | 0 | 11515 | 2 |
| C | 0 | 11140 | 2 |
| D | 0 | 15092 | 2 |
| Quadrant | Total seconds | Saturated seconds | Saturation percentage |
|---|---|---|---|
| A | 5183 | 14 | 0.270114% |
| B | 5183 | 30 | 0.578815% |
| C | 5183 | 36 | 0.694578% |
| D | 5183 | 287 | 5.537334% |
Noise dominated data is calculated using 1-second bins in cleaned event files. If a bin has >2000 counts, and if more than 50% of those come from <1% of pixels, then it is considered to be noise-dominated and hence unusable.
| Quadrant | # 1 sec bins | Bins with >0 counts | Bins with >2000 counts | High rate bins dominated by noise | Noise dominated (total time) | Noise dominated (detector-on time) | Marked lightcurve |
|---|---|---|---|---|---|---|---|
| A | 7274 | 5183 | 13 | 13 | 0.18% | 0.25% | 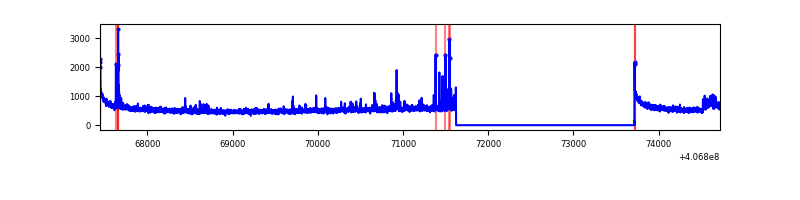 |
| B | 7274 | 5184 | 16 | 16 | 0.22% | 0.31% | 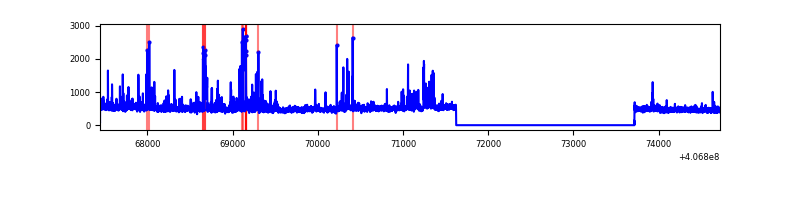 |
| C | 7274 | 5184 | 40 | 40 | 0.55% | 0.77% | 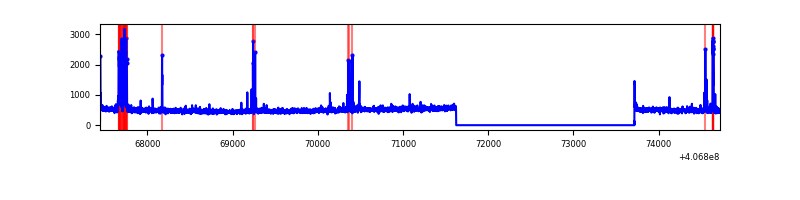 |
| D | 7274 | 5184 | 247 | 247 | 3.40% | 4.76% | 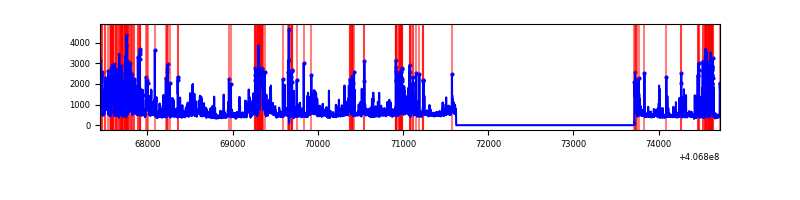 |
Top three noisy pixels from each quadrant. If the there are fewer than three noisy pixels in the level2.evt file, extra rows are filled as -1
| Pixel properties | Quadrant properties | ||||||
|---|---|---|---|---|---|---|---|
| Quadrant | DetID | PixID | Counts | Sigma | Mean | Median | Sigma |
| A | 10 | 83 | 397942 | 3244.06 | 613 | 603 | 122.5 |
| A | 13 | 248 | 107182 | 870.16 | 613 | 603 | 122.5 |
| A | 12 | 189 | 53779 | 434.15 | 613 | 603 | 122.5 |
| B | 4 | 251 | 254912 | 2202.84 | 608 | 594 | 115.5 |
| B | 4 | 171 | 143015 | 1233.62 | 608 | 594 | 115.5 |
| B | 0 | 230 | 16791 | 140.29 | 608 | 594 | 115.5 |
| C | 15 | 214 | 210549 | 1541.26 | 591 | 597 | 136.2 |
| C | 15 | 208 | 154736 | 1131.53 | 591 | 597 | 136.2 |
| C | 15 | 159 | 32635 | 235.19 | 591 | 597 | 136.2 |
| D | 12 | 227 | 641667 | 4512.25 | 579 | 562 | 142.1 |
| D | 10 | 118 | 544794 | 3830.43 | 579 | 562 | 142.1 |
| D | 2 | 16 | 164362 | 1152.86 | 579 | 562 | 142.1 |
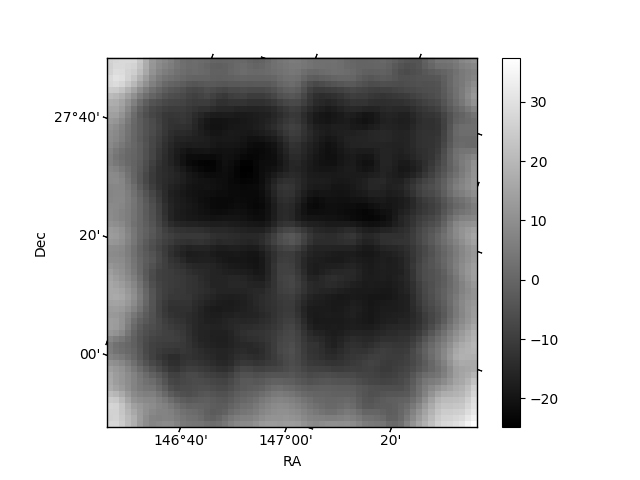
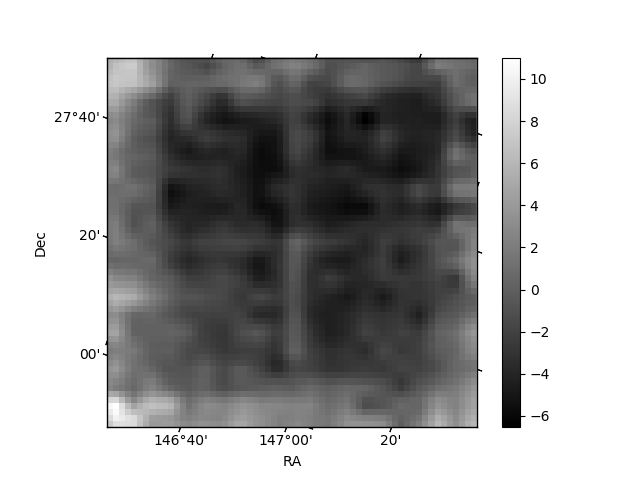
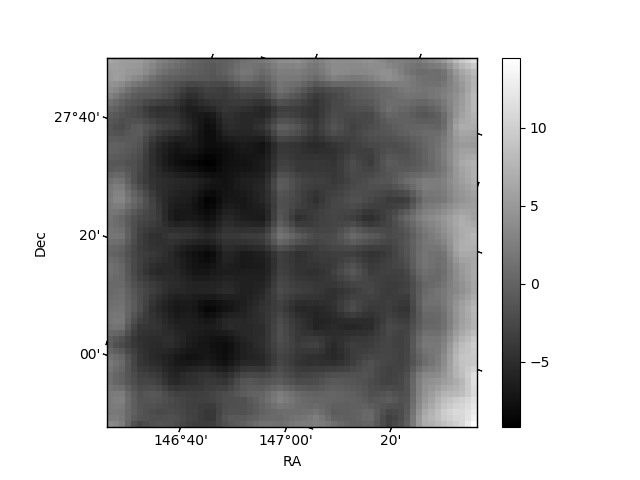
Histogram calculated using DETX and DETY for each event in the final _common_clean file
| Quadrant A | 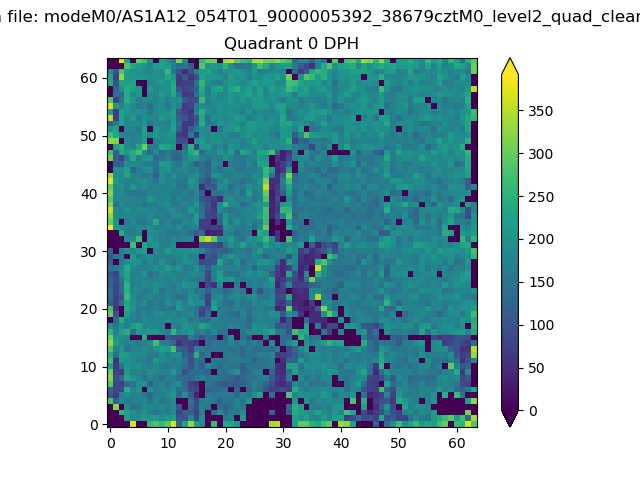 |
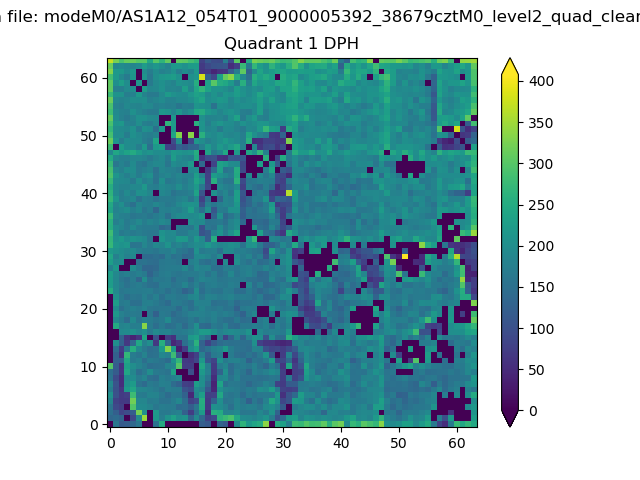 |
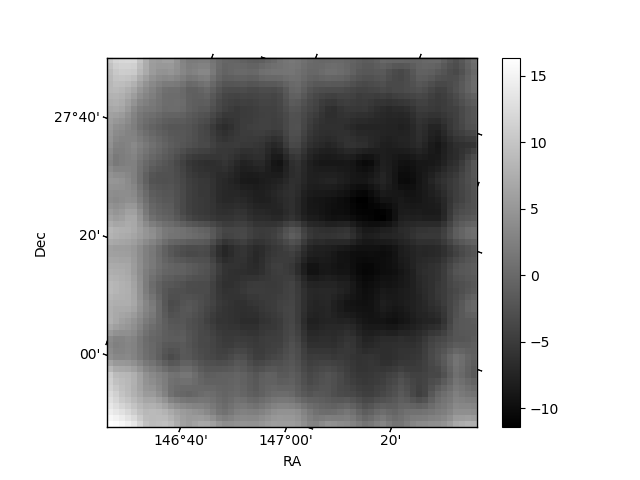
Quadrant B |
|---|---|---|---|
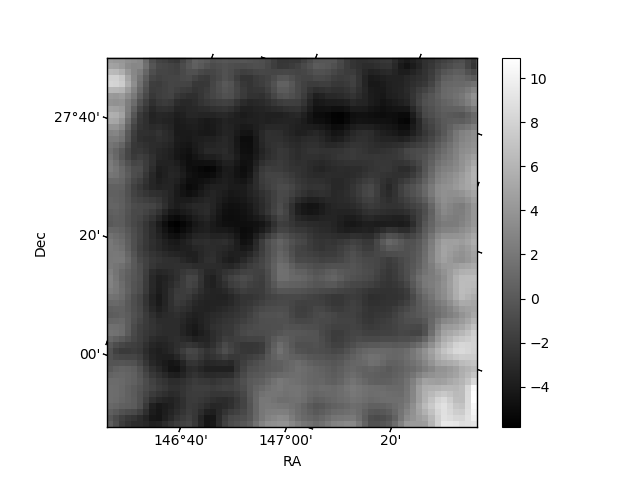
| Quadrant D | 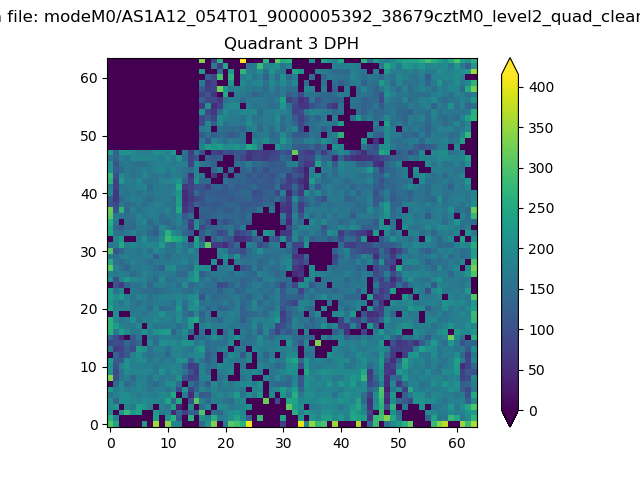 |
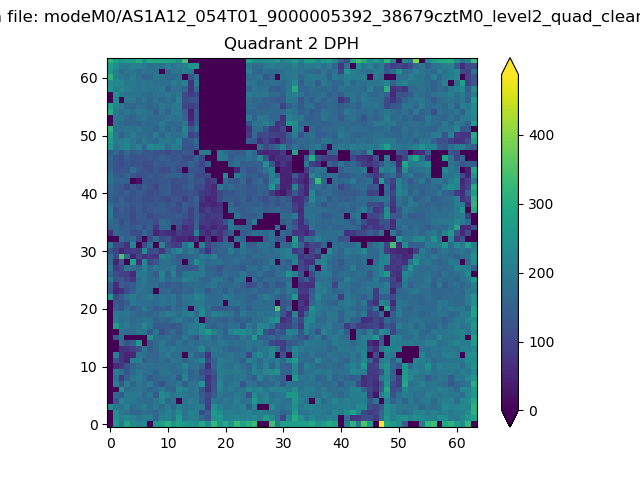 |
Quadrant C |
| Plot type | Count rate plots | Images |
|---|---|---|
| Comparison with Poisson distribution Blue bars denote a histogram of data divided into 1 sec bins. Red curve is a Poisson curve with rate = median count rate of data. |
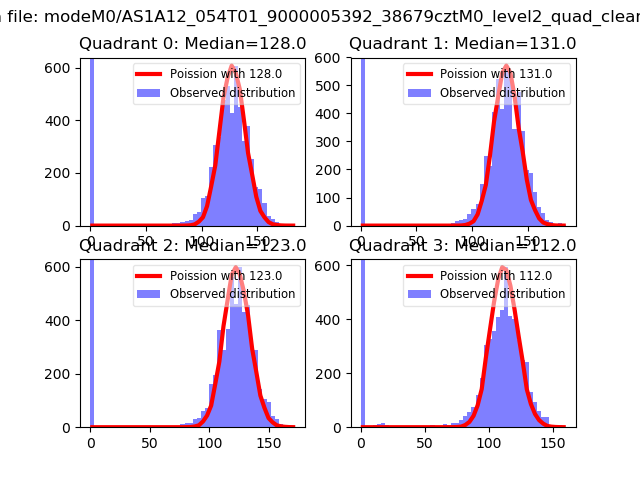 |
 |
| Quadrant-wise count rates Data is divided into 100 sec bins |
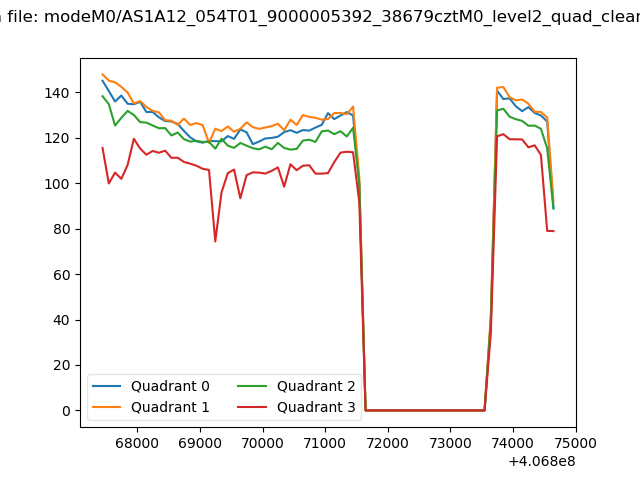 |
|
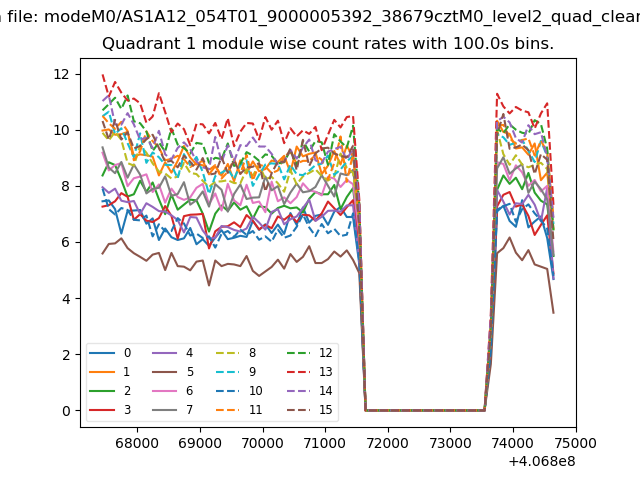
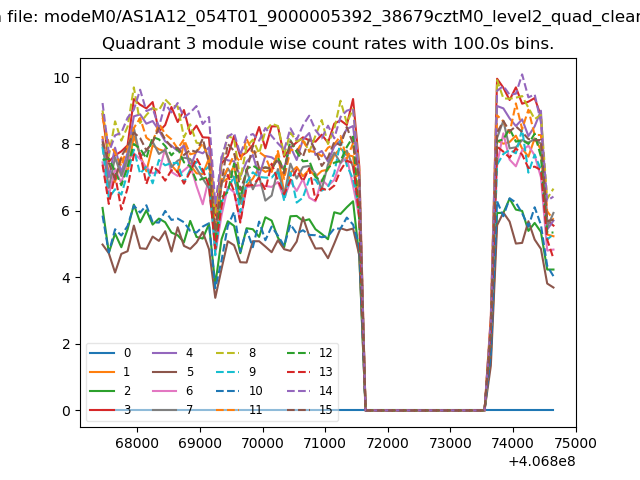
| Module-wise count rates for Quadrant A Data is divided into 100 sec bins |
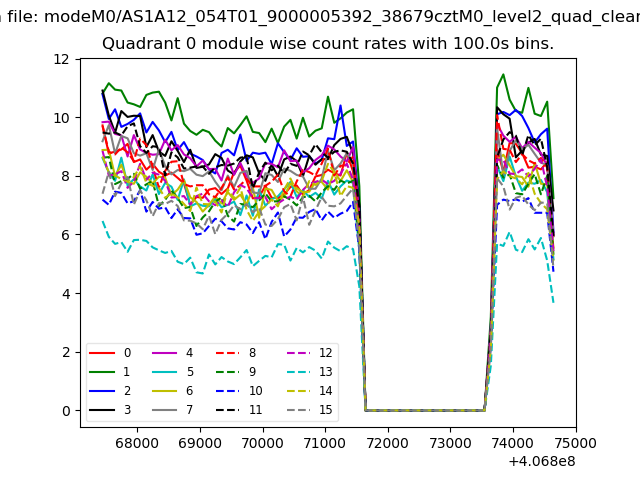 |
 |
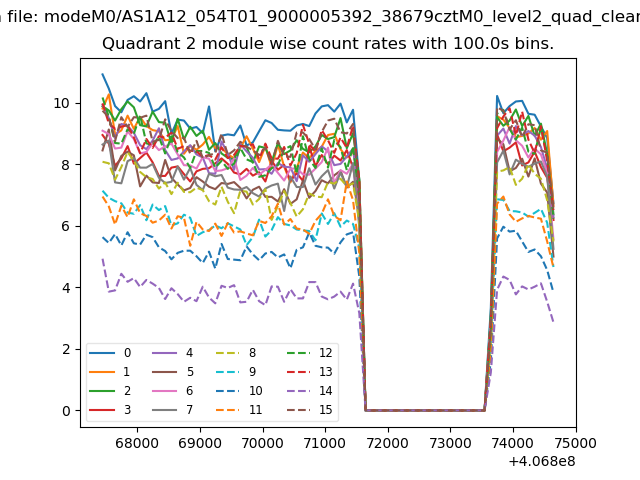
| Module-wise count rates for Quadrant B Data is divided into 100 sec bins |
 |
 |
| Module-wise count rates for Quadrant C Data is divided into 100 sec bins |
 |
 |
| Module-wise count rates for Quadrant D Data is divided into 100 sec bins |
 |
 |
| Parameter | Plot |
|---|---|
| CZT HV Monitor | 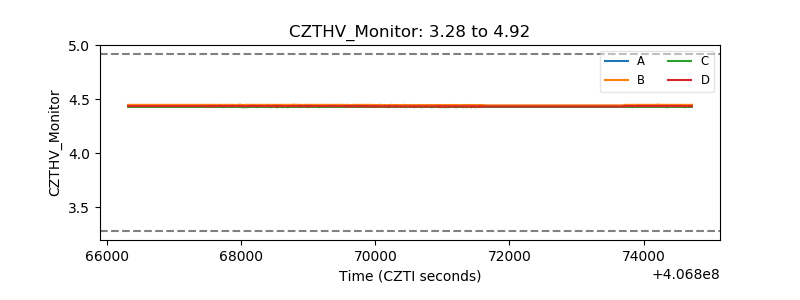 |
| D_VDD | 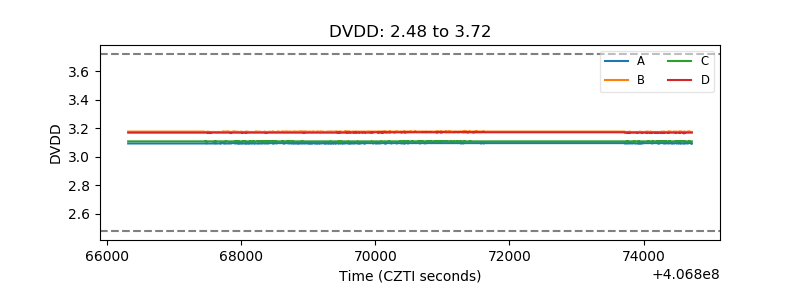 |
| Temperature 1 | 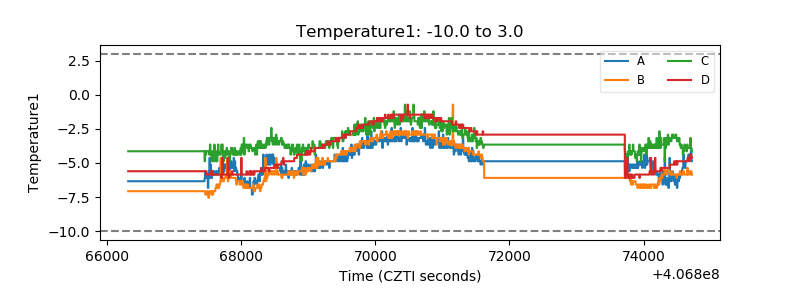 |
| Veto HV Monitor | 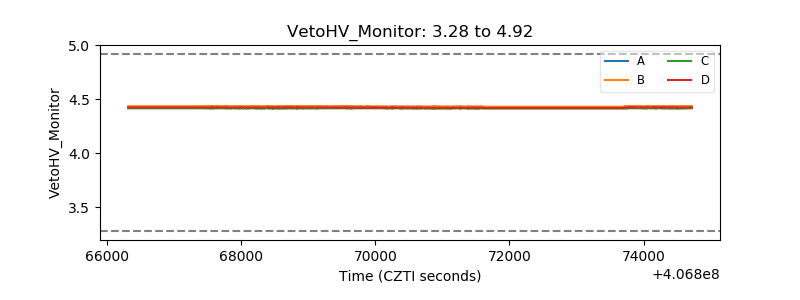 |
| Veto LLD | 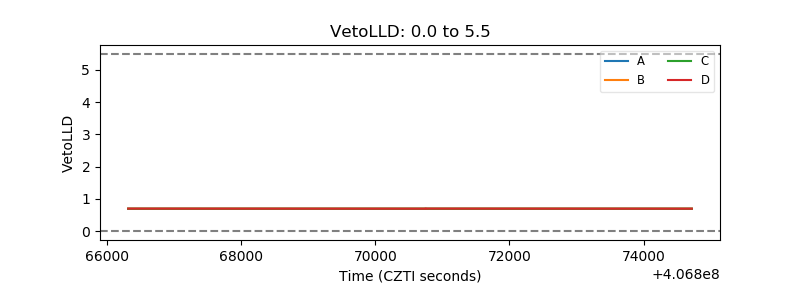 |
| Alpha Counter | 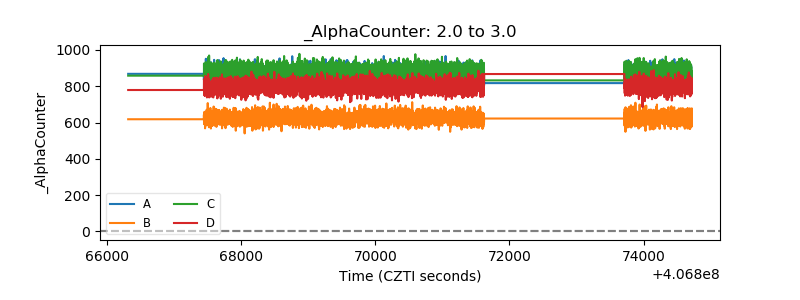 |
| _CPM_Rate | 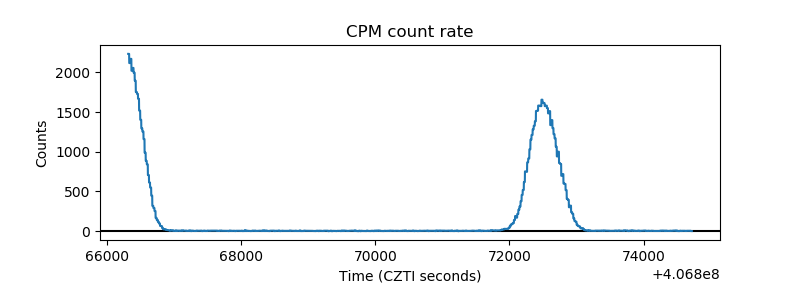 |
| CZT Counter | 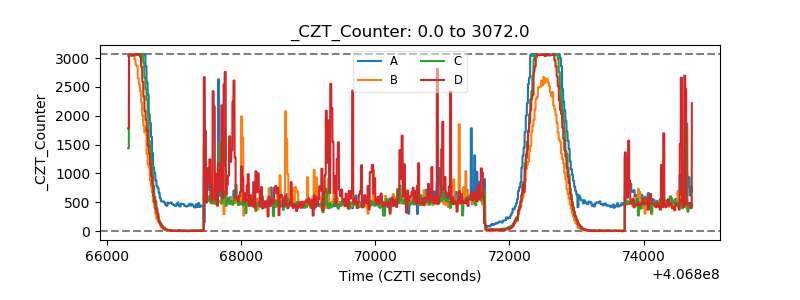 |
| +2.5 Volts monitor | 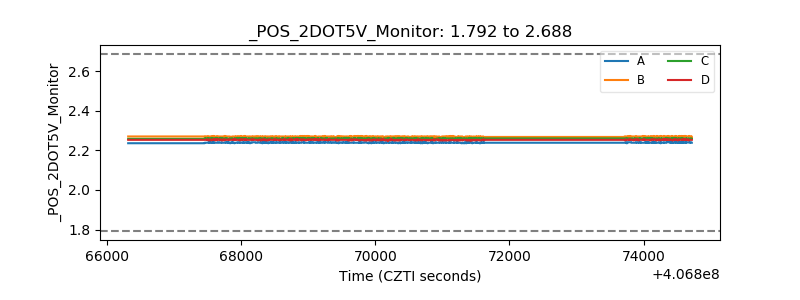 |
| +5 Volts monitor | 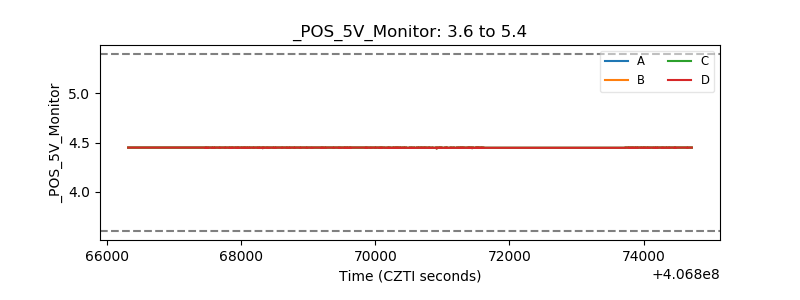 |
| _ROLL_ROT | 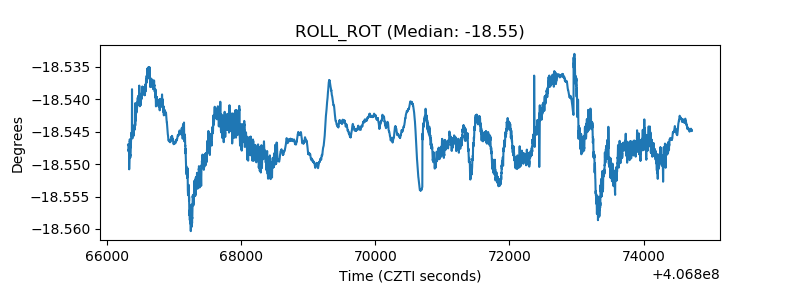 |
| _Roll_DEC | 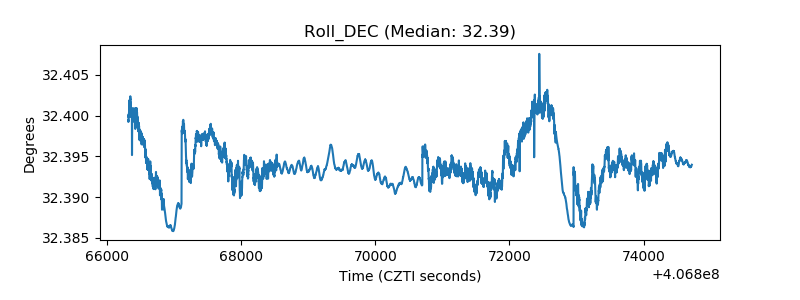 |
| _Roll_RA | 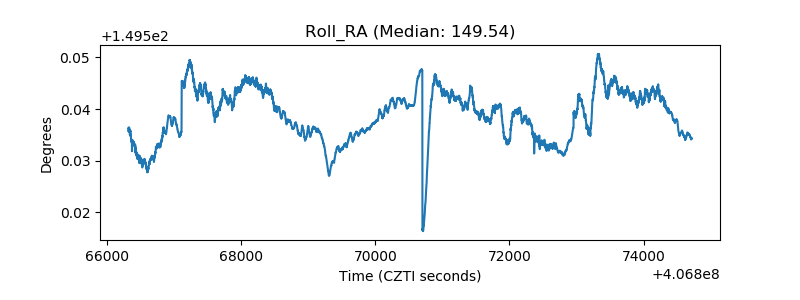 |
| Veto Counter | 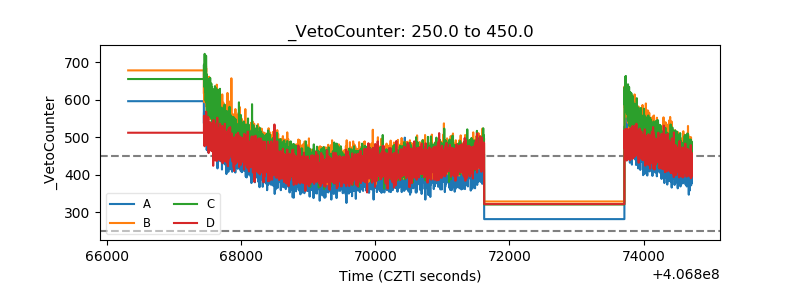 |