| Param | Original file | Final file |
|---|---|---|
| Filename | modeM0/AS1A12_054T01_9000005392_38680cztM0_level2.fits | modeM0/AS1A12_054T01_9000005392_38680cztM0_level2_quad_clean.evt |
| Size (bytes) | 365,126,400 | 90,360,000 |
| Size | 348.2 MB | 86.2 MB |
| Events in quadrant A | 2,909,306 | 629,766 |
| Events in quadrant B | 3,001,851 | 623,356 |
| Events in quadrant C | 2,577,340 | 603,183 |
| Events in quadrant D | 4,634,525 | 525,930 |
| Mode M9 | |||
|---|---|---|---|
| Quadrant | BADHDUFLAG | Total packets | Discarded packets |
| A | 0 | 21 | 0 |
| B | 0 | 21 | 0 |
| C | 0 | 21 | 0 |
| D | 0 | 22 | 0 |
| Mode SS | |||
|---|---|---|---|
| Quadrant | BADHDUFLAG | Total packets | Discarded packets |
| A | 0 | 104 | 0 |
| B | 0 | 104 | 0 |
| C | 0 | 104 | 0 |
| D | 0 | 104 | 0 |
| Mode M0 | |||
|---|---|---|---|
| Quadrant | BADHDUFLAG | Total packets | Discarded packets |
| A | 0 | 11621 | 3 |
| B | 0 | 12208 | 2 |
| C | 0 | 10585 | 2 |
| D | 0 | 17261 | 2 |
| Quadrant | Total seconds | Saturated seconds | Saturation percentage |
|---|---|---|---|
| A | 5048 | 19 | 0.376387% |
| B | 5048 | 198 | 3.922345% |
| C | 5048 | 26 | 0.515055% |
| D | 5048 | 435 | 8.617274% |
Noise dominated data is calculated using 1-second bins in cleaned event files. If a bin has >2000 counts, and if more than 50% of those come from <1% of pixels, then it is considered to be noise-dominated and hence unusable.
| Quadrant | # 1 sec bins | Bins with >0 counts | Bins with >2000 counts | High rate bins dominated by noise | Noise dominated (total time) | Noise dominated (detector-on time) | Marked lightcurve |
|---|---|---|---|---|---|---|---|
| A | 7200 | 5048 | 13 | 13 | 0.18% | 0.26% | 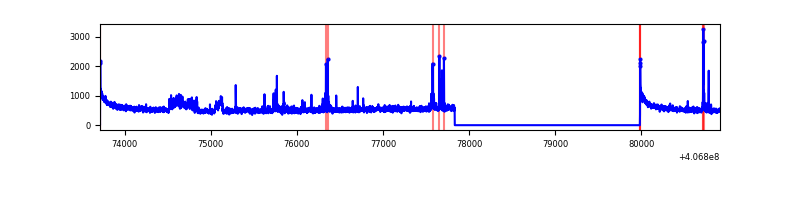 |
| B | 7200 | 5049 | 165 | 165 | 2.29% | 3.27% | 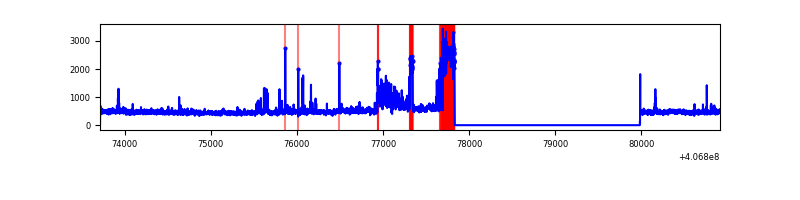 |
| C | 7200 | 5049 | 23 | 23 | 0.32% | 0.46% | 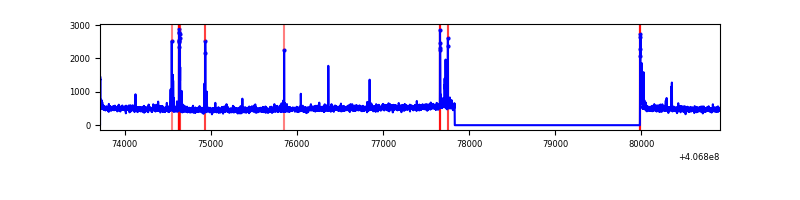 |
| D | 7200 | 5049 | 406 | 406 | 5.64% | 8.04% | 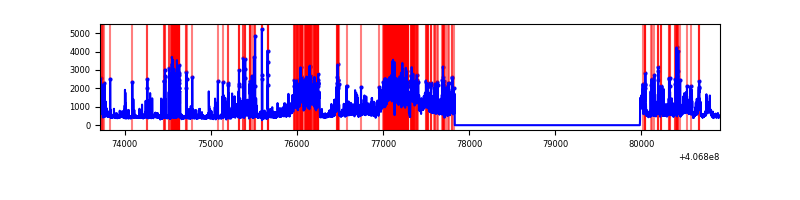 |
Top three noisy pixels from each quadrant. If the there are fewer than three noisy pixels in the level2.evt file, extra rows are filled as -1
| Pixel properties | Quadrant properties | ||||||
|---|---|---|---|---|---|---|---|
| Quadrant | DetID | PixID | Counts | Sigma | Mean | Median | Sigma |
| A | 10 | 83 | 398801 | 3302.61 | 594 | 585 | 120.6 |
| A | 12 | 189 | 104071 | 858.26 | 594 | 585 | 120.6 |
| A | 13 | 248 | 73119 | 601.56 | 594 | 585 | 120.6 |
| B | 4 | 251 | 392091 | 3586.2 | 575 | 561 | 109.2 |
| B | 4 | 171 | 160947 | 1469.05 | 575 | 561 | 109.2 |
| B | 4 | 170 | 148979 | 1359.43 | 575 | 561 | 109.2 |
| C | 15 | 214 | 204417 | 1533.06 | 572 | 577 | 133.0 |
| C | 15 | 208 | 44456 | 330.01 | 572 | 577 | 133.0 |
| C | 15 | 159 | 35739 | 264.45 | 572 | 577 | 133.0 |
| D | 12 | 227 | 1741028 | 12693.25 | 559 | 544 | 137.1 |
| D | 2 | 250 | 199191 | 1448.72 | 559 | 544 | 137.1 |
| D | 2 | 16 | 141725 | 1029.62 | 559 | 544 | 137.1 |
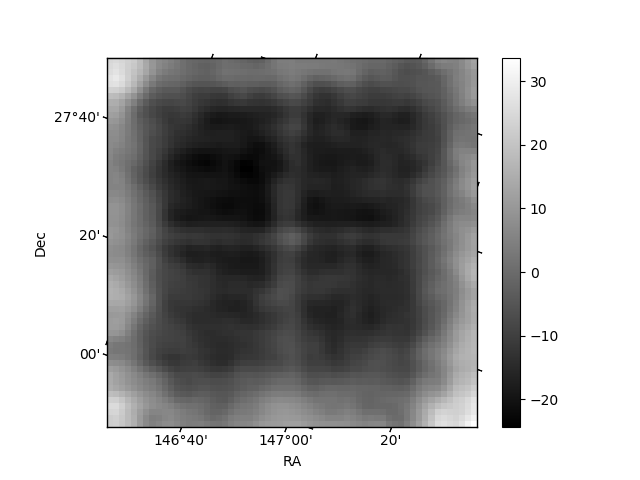
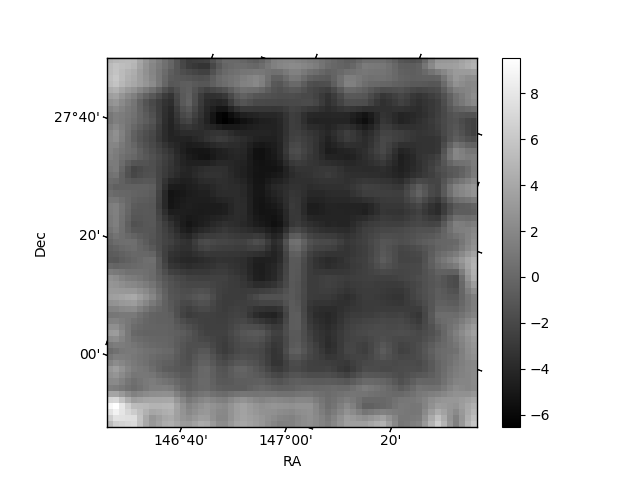
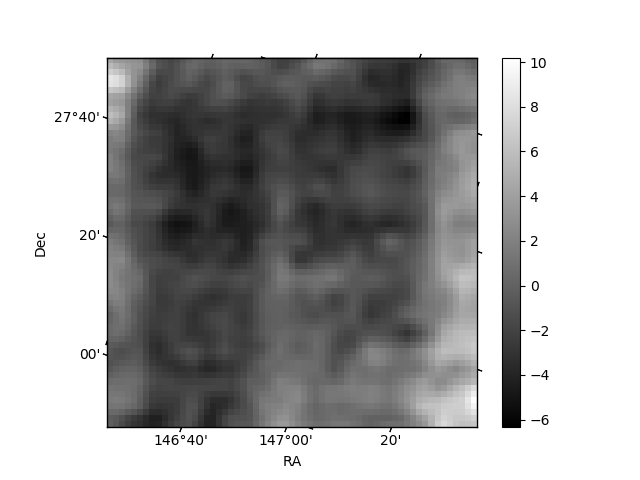
Histogram calculated using DETX and DETY for each event in the final _common_clean file
| Quadrant A | 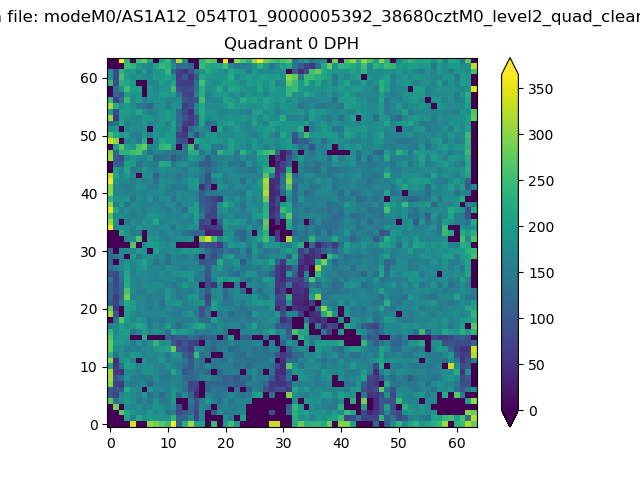 |
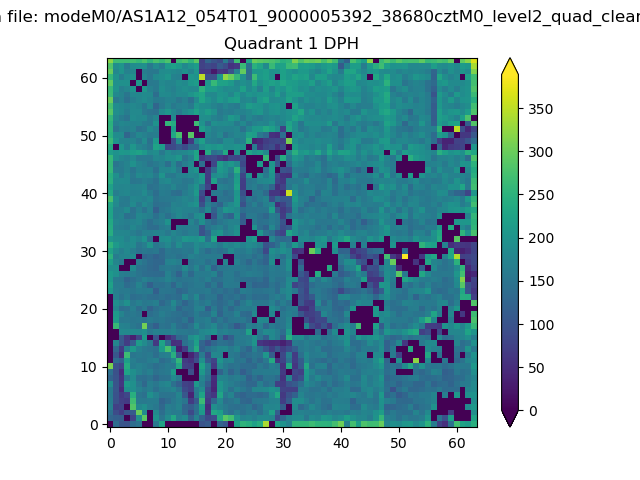 |
Quadrant B |
|---|---|---|---|
| Quadrant D | 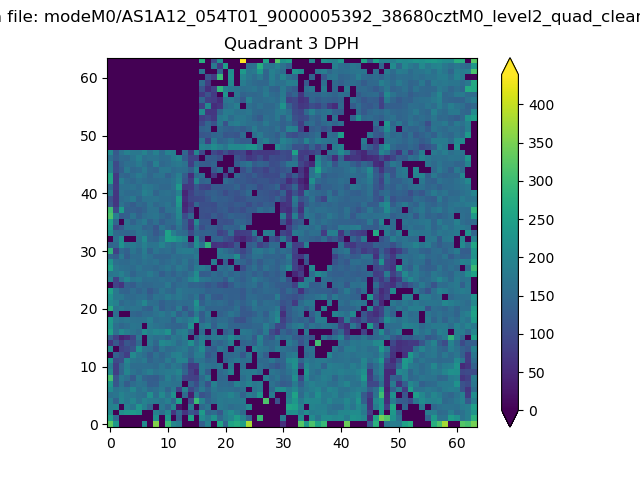 |
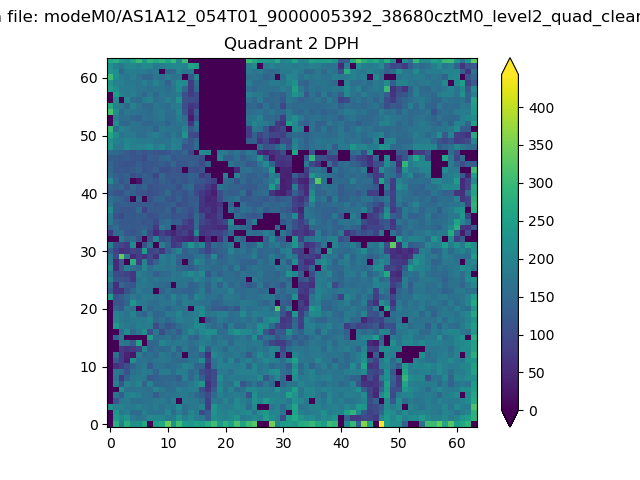 |
Quadrant C |
| Plot type | Count rate plots | Images |
|---|---|---|
| Comparison with Poisson distribution Blue bars denote a histogram of data divided into 1 sec bins. Red curve is a Poisson curve with rate = median count rate of data. |
 |
 |
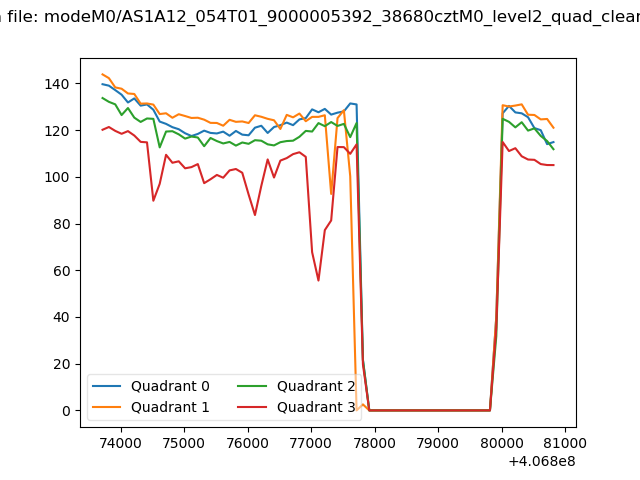
| Quadrant-wise count rates Data is divided into 100 sec bins |
 |
|
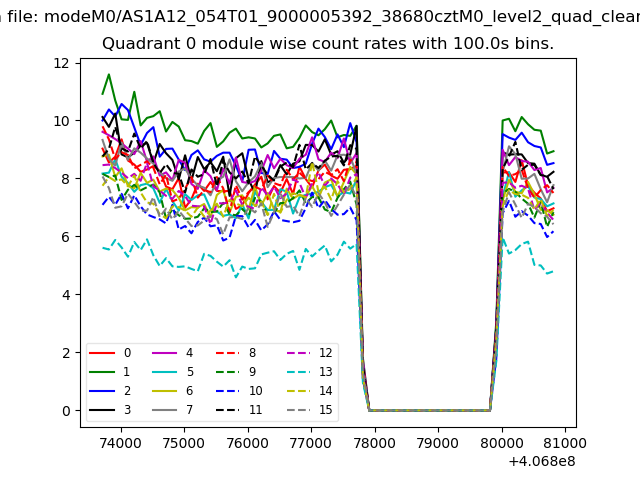
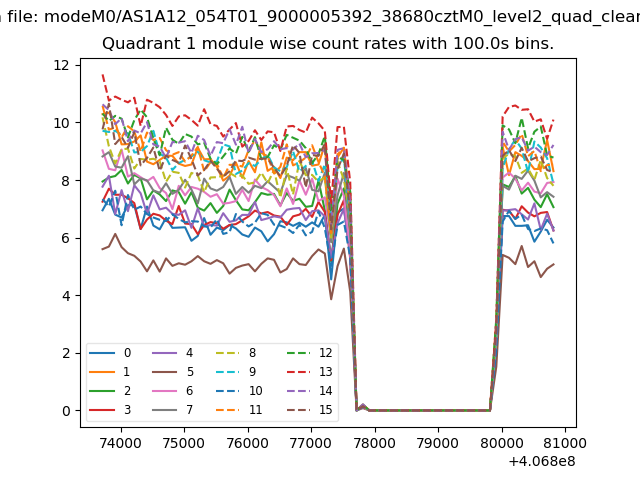
| Module-wise count rates for Quadrant A Data is divided into 100 sec bins |
 |
 |
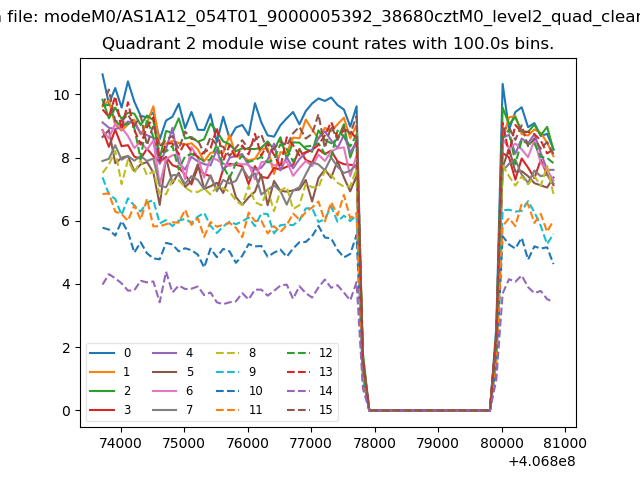
| Module-wise count rates for Quadrant B Data is divided into 100 sec bins |
 |
 |
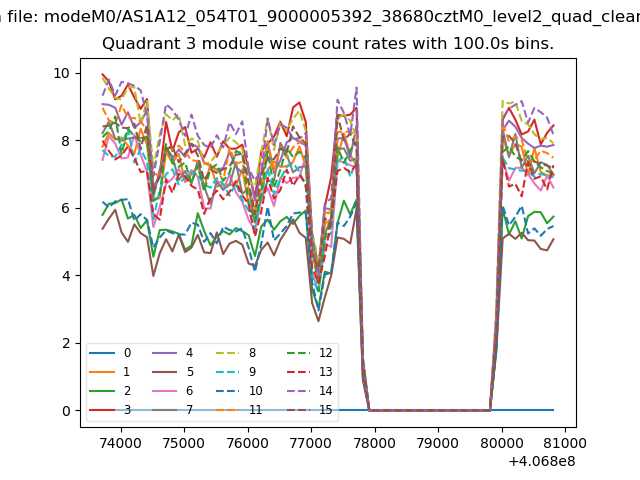
| Module-wise count rates for Quadrant C Data is divided into 100 sec bins |
 |
 |
| Module-wise count rates for Quadrant D Data is divided into 100 sec bins |
 |
 |
| Parameter | Plot |
|---|---|
| CZT HV Monitor | 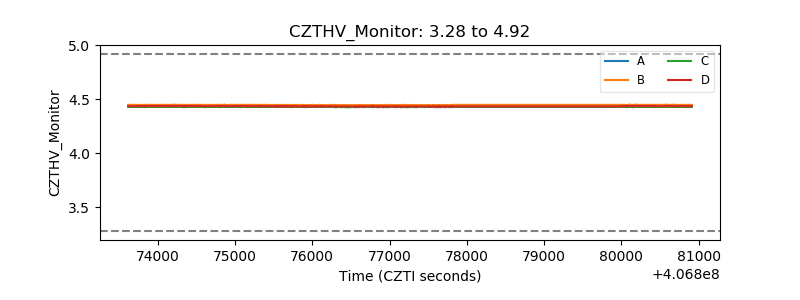 |
| D_VDD | 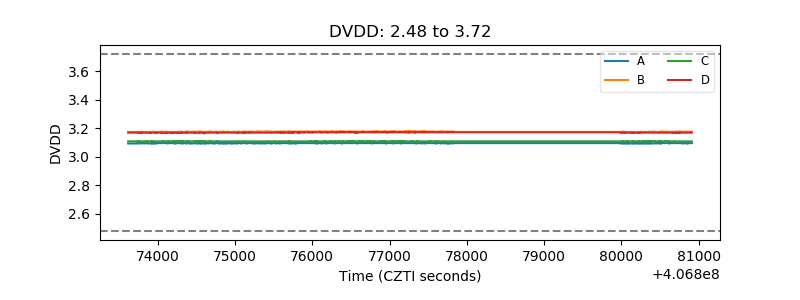 |
| Temperature 1 | 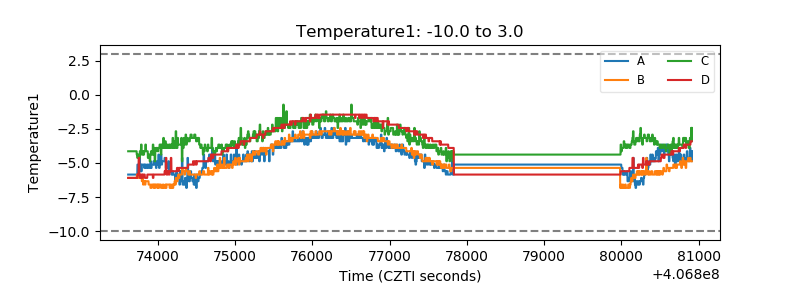 |
| Veto HV Monitor | 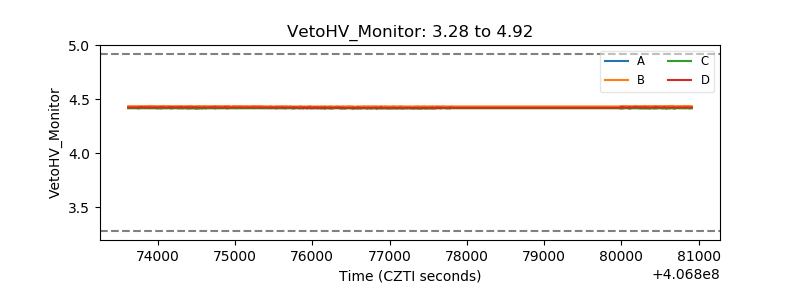 |
| Veto LLD | 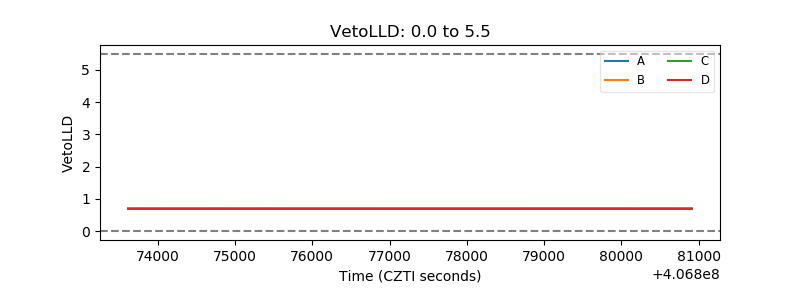 |
| Alpha Counter | 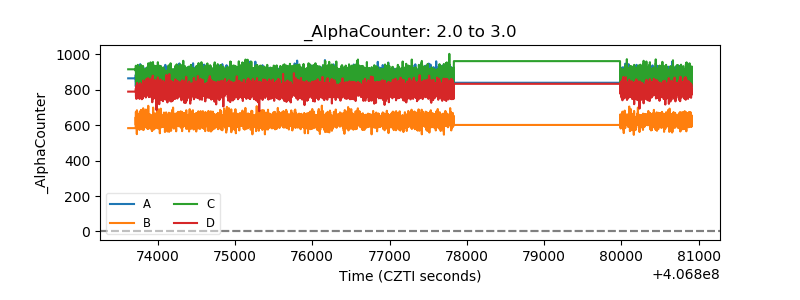 |
| _CPM_Rate | 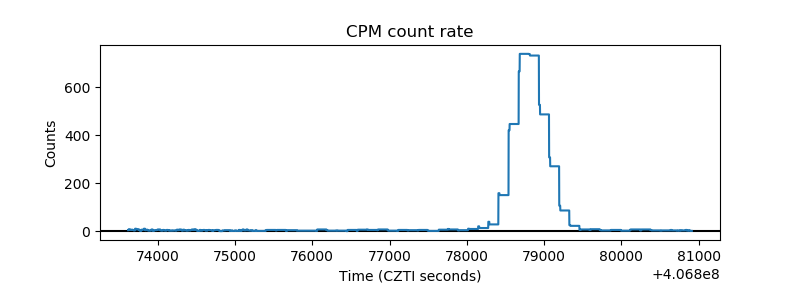 |
| CZT Counter | 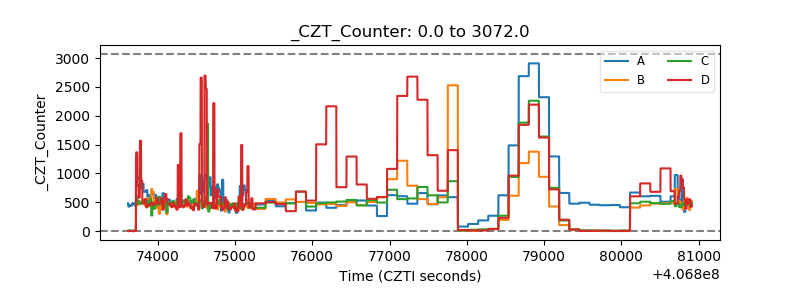 |
| +2.5 Volts monitor | 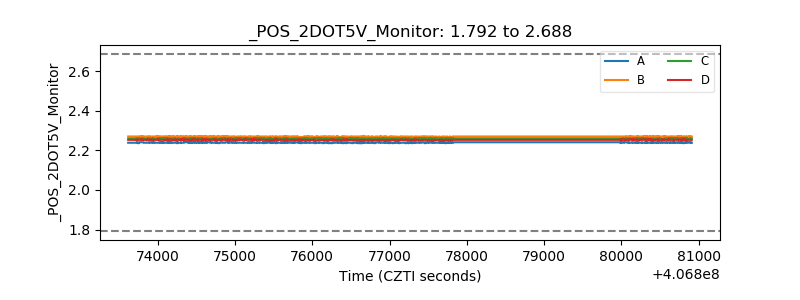 |
| +5 Volts monitor | 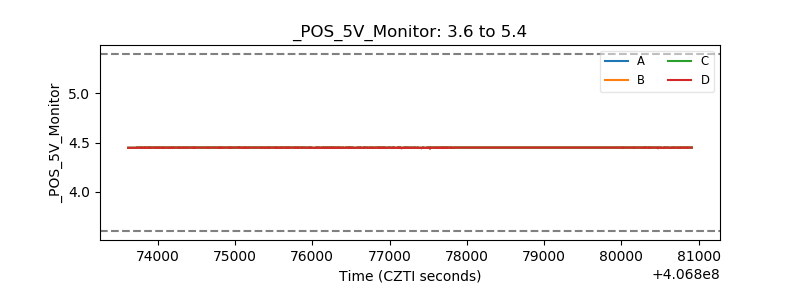 |
| _ROLL_ROT | 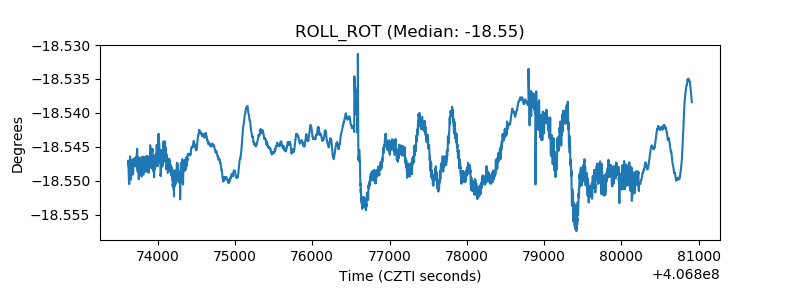 |
| _Roll_DEC |  |
| _Roll_RA | 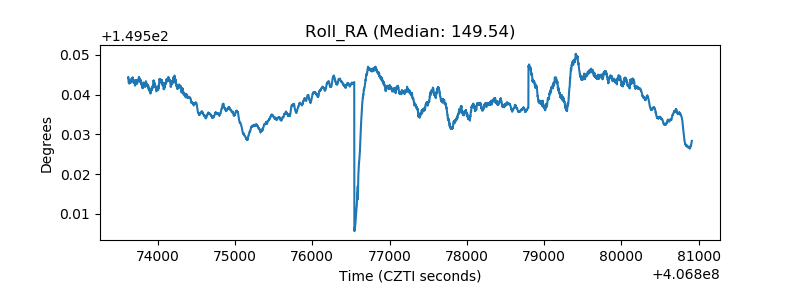 |
| Veto Counter | 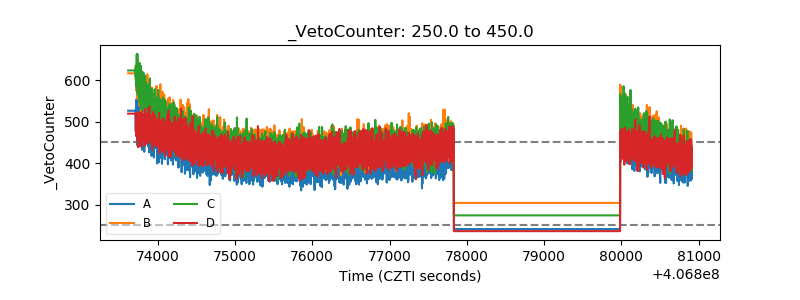 |