| Param | Original file | Final file |
|---|---|---|
| Filename | modeM0/AS1A12_054T01_9000005392_38681cztM0_level2.fits | modeM0/AS1A12_054T01_9000005392_38681cztM0_level2_quad_clean.evt |
| Size (bytes) | 492,007,680 | 80,928,000 |
| Size | 469.2 MB | 77.2 MB |
| Events in quadrant A | 3,133,847 | 590,428 |
| Events in quadrant B | 5,910,855 | 489,624 |
| Events in quadrant C | 2,586,061 | 572,611 |
| Events in quadrant D | 6,196,372 | 449,203 |
| Mode M9 | |||
|---|---|---|---|
| Quadrant | BADHDUFLAG | Total packets | Discarded packets |
| A | 0 | 30 | 0 |
| B | 0 | 30 | 0 |
| C | 0 | 30 | 0 |
| D | 0 | 31 | 0 |
| Mode SS | |||
|---|---|---|---|
| Quadrant | BADHDUFLAG | Total packets | Discarded packets |
| A | 0 | 102 | 0 |
| B | 0 | 102 | 0 |
| C | 0 | 102 | 0 |
| D | 0 | 102 | 0 |
| Mode M0 | |||
|---|---|---|---|
| Quadrant | BADHDUFLAG | Total packets | Discarded packets |
| A | 0 | 12263 | 3 |
| B | 0 | 20914 | 2 |
| C | 0 | 10570 | 2 |
| D | 0 | 21880 | 2 |
| Quadrant | Total seconds | Saturated seconds | Saturation percentage |
|---|---|---|---|
| A | 4966 | 82 | 1.651228% |
| B | 4966 | 1181 | 23.781716% |
| C | 4966 | 13 | 0.261780% |
| D | 4966 | 957 | 19.271043% |
Noise dominated data is calculated using 1-second bins in cleaned event files. If a bin has >2000 counts, and if more than 50% of those come from <1% of pixels, then it is considered to be noise-dominated and hence unusable.
| Quadrant | # 1 sec bins | Bins with >0 counts | Bins with >2000 counts | High rate bins dominated by noise | Noise dominated (total time) | Noise dominated (detector-on time) | Marked lightcurve |
|---|---|---|---|---|---|---|---|
| A | 7058 | 4967 | 54 | 54 | 0.77% | 1.09% | 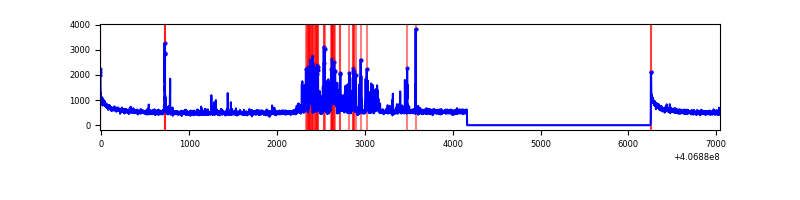 |
| B | 7058 | 4967 | 1056 | 1056 | 14.96% | 21.26% | 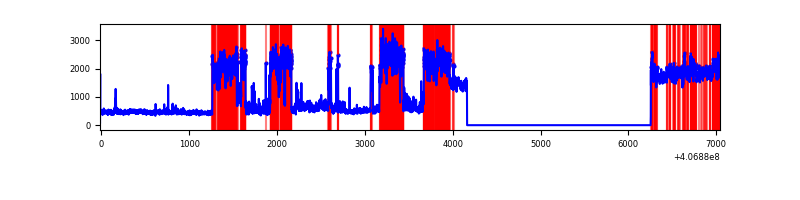 |
| C | 7058 | 4967 | 11 | 11 | 0.16% | 0.22% | 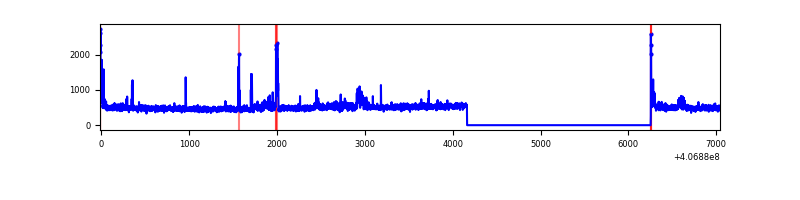 |
| D | 7058 | 4967 | 912 | 912 | 12.92% | 18.36% | 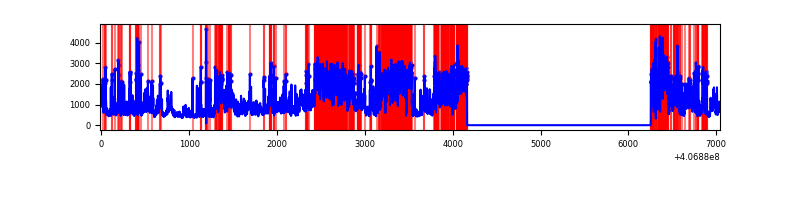 |
Top three noisy pixels from each quadrant. If the there are fewer than three noisy pixels in the level2.evt file, extra rows are filled as -1
| Pixel properties | Quadrant properties | ||||||
|---|---|---|---|---|---|---|---|
| Quadrant | DetID | PixID | Counts | Sigma | Mean | Median | Sigma |
| A | 13 | 248 | 501967 | 4262.99 | 575 | 564 | 117.6 |
| A | 10 | 83 | 392365 | 3331.14 | 575 | 564 | 117.6 |
| A | 13 | 254 | 8646 | 68.71 | 575 | 564 | 117.6 |
| B | 4 | 251 | 3535122 | 34666.91 | 530 | 516 | 102.0 |
| B | 4 | 170 | 149271 | 1458.97 | 530 | 516 | 102.0 |
| B | 4 | 171 | 81280 | 792.12 | 530 | 516 | 102.0 |
| C | 15 | 214 | 203531 | 1564.62 | 557 | 561 | 129.7 |
| C | 14 | 254 | 142940 | 1097.55 | 557 | 561 | 129.7 |
| C | 0 | 10 | 45316 | 345.0 | 557 | 561 | 129.7 |
| D | 12 | 227 | 2918977 | 22658.75 | 525 | 511 | 128.8 |
| D | 5 | 222 | 522463 | 4052.4 | 525 | 511 | 128.8 |
| D | 10 | 118 | 278321 | 2156.9 | 525 | 511 | 128.8 |
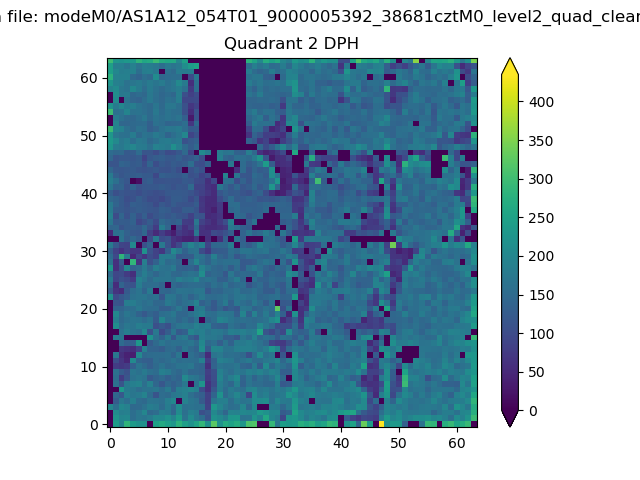
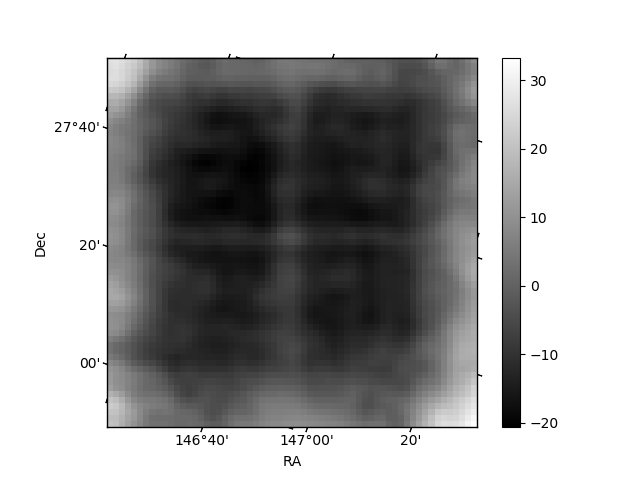
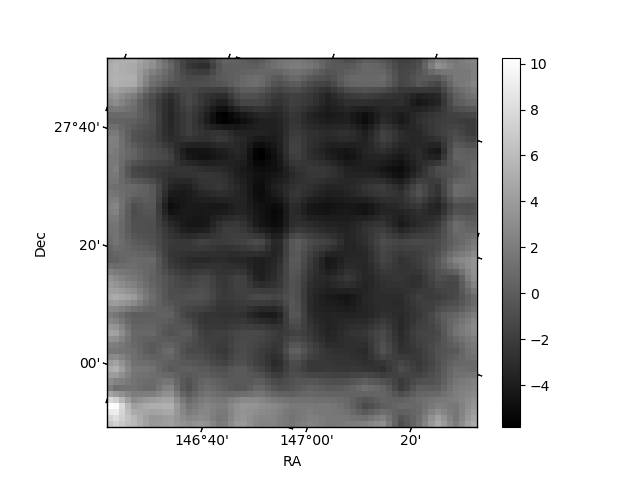
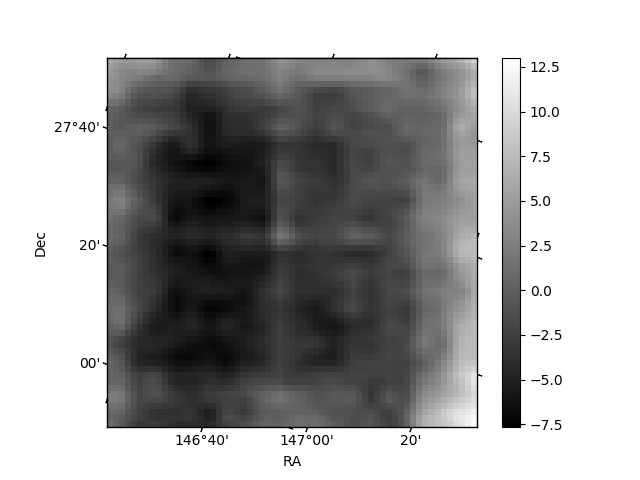
Histogram calculated using DETX and DETY for each event in the final _common_clean file
| Quadrant A | 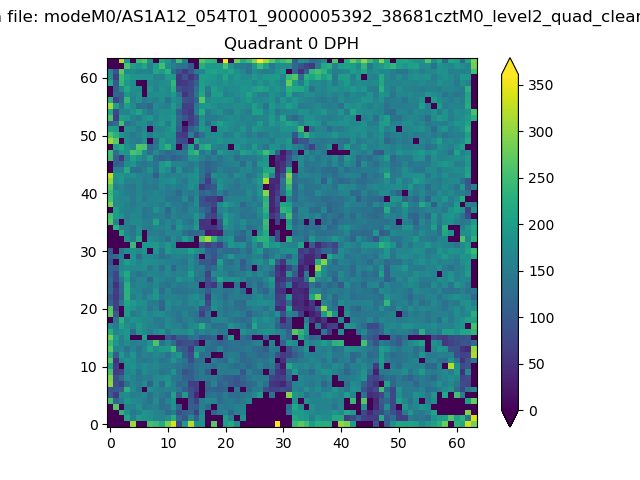 |
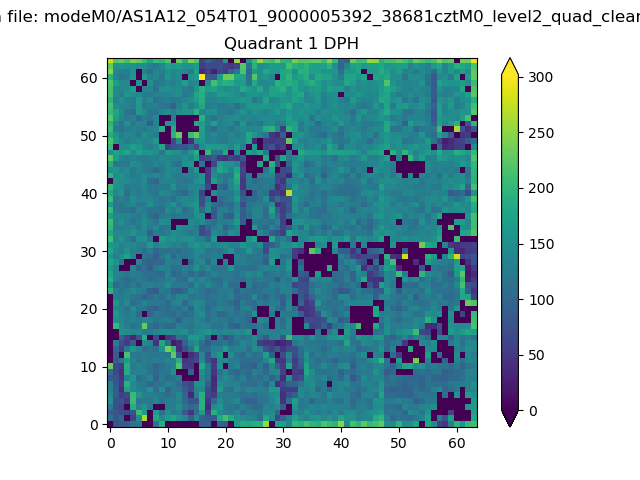 |
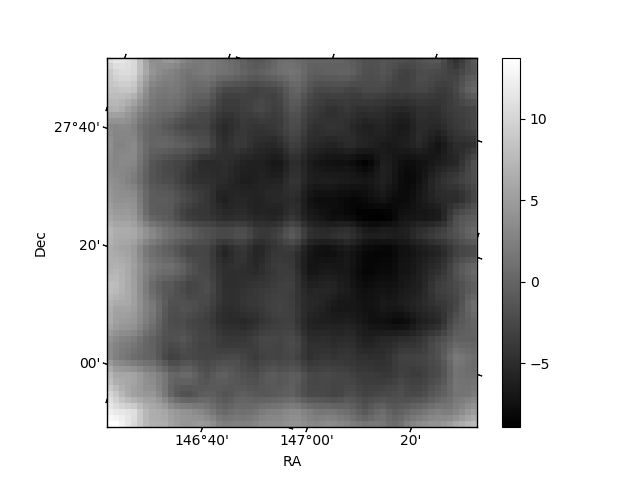
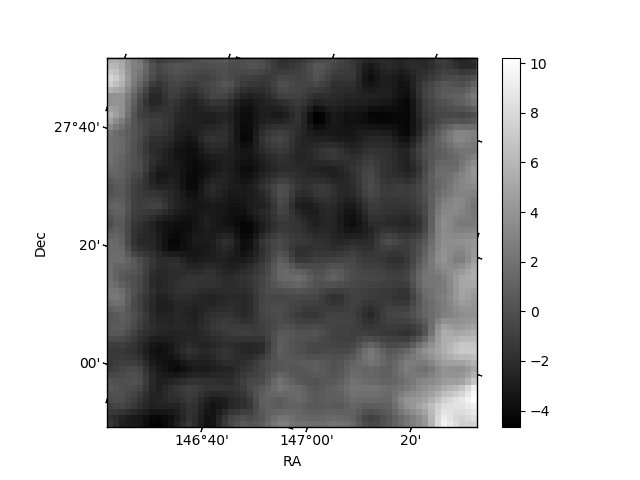
Quadrant B |
|---|---|---|---|
| Quadrant D | 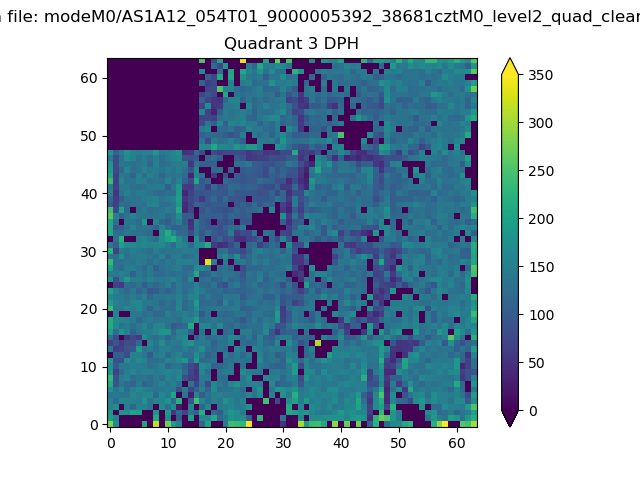 |
 |
Quadrant C |
| Plot type | Count rate plots | Images |
|---|---|---|
| Comparison with Poisson distribution Blue bars denote a histogram of data divided into 1 sec bins. Red curve is a Poisson curve with rate = median count rate of data. |
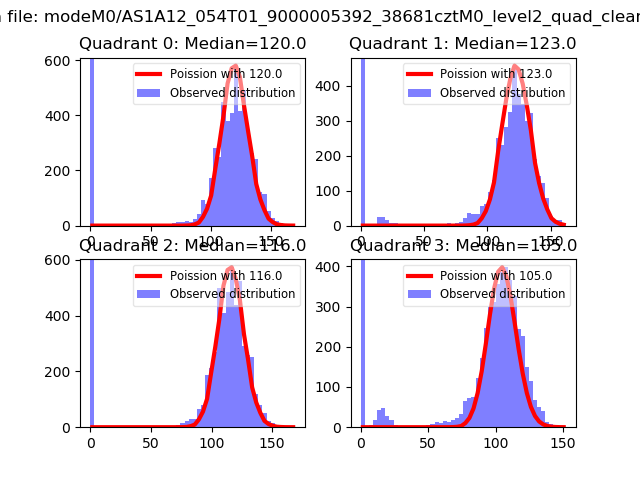 |
 |
| Quadrant-wise count rates Data is divided into 100 sec bins |
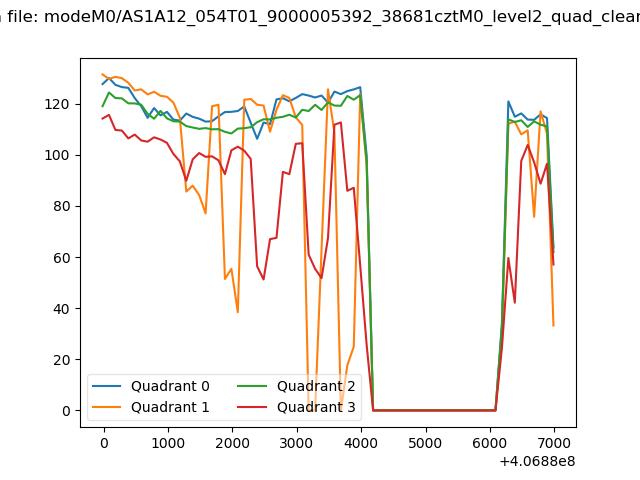 |
|
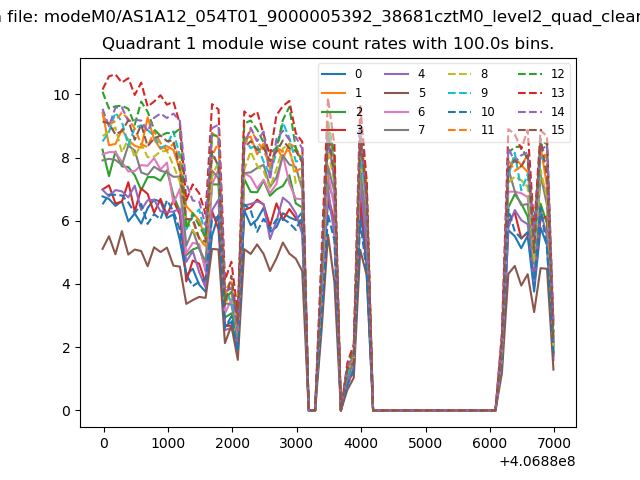
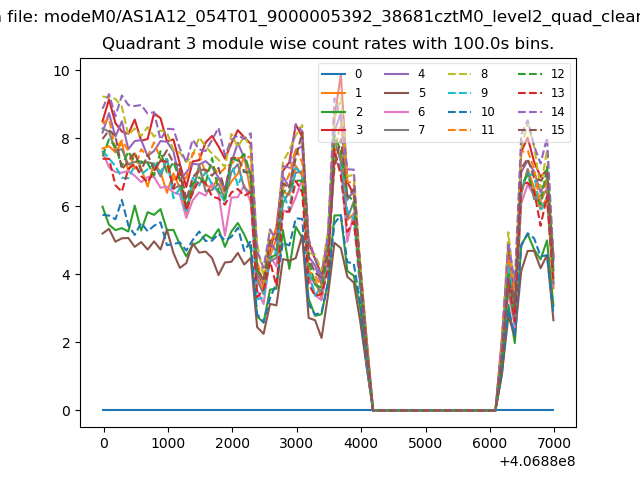
| Module-wise count rates for Quadrant A Data is divided into 100 sec bins |
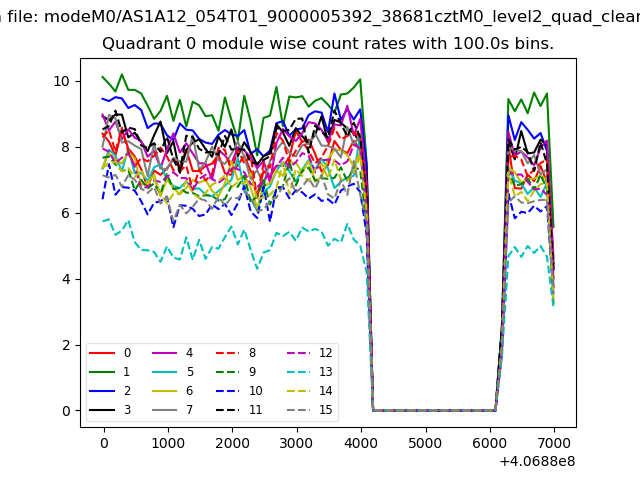 |
 |
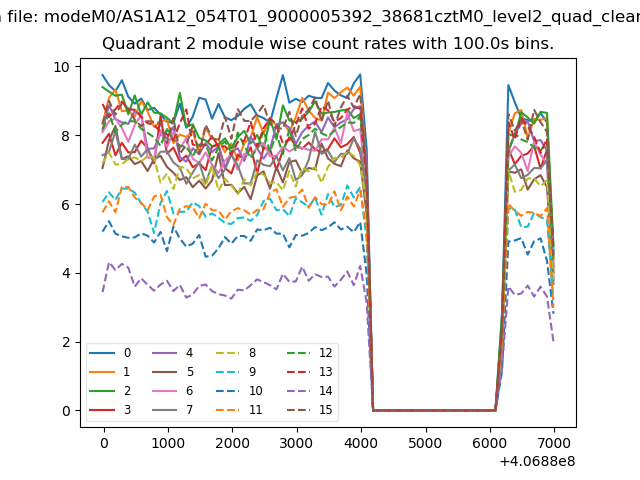
| Module-wise count rates for Quadrant B Data is divided into 100 sec bins |
 |
 |
| Module-wise count rates for Quadrant C Data is divided into 100 sec bins |
 |
 |
| Module-wise count rates for Quadrant D Data is divided into 100 sec bins |
 |
 |
| Parameter | Plot |
|---|---|
| CZT HV Monitor | 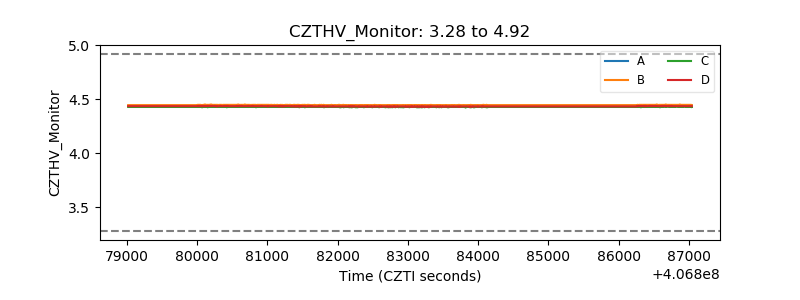 |
| D_VDD | 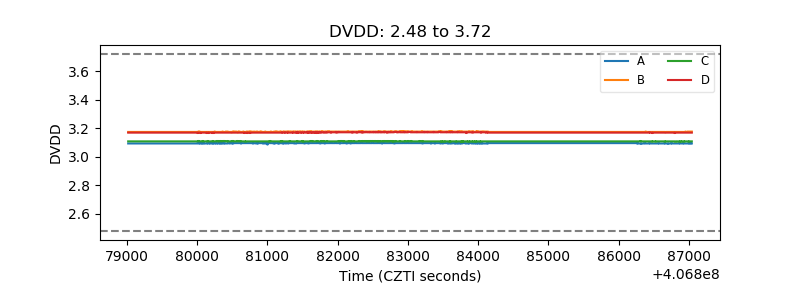 |
| Temperature 1 | 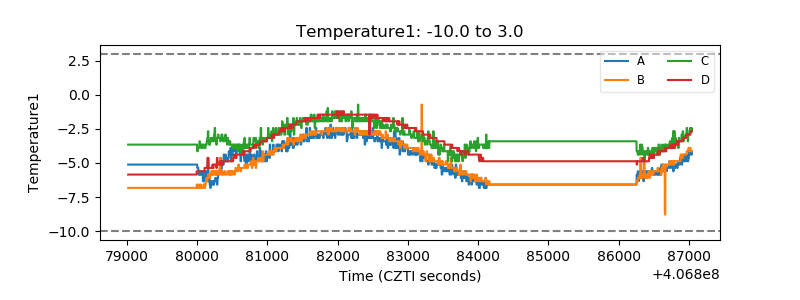 |
| Veto HV Monitor | 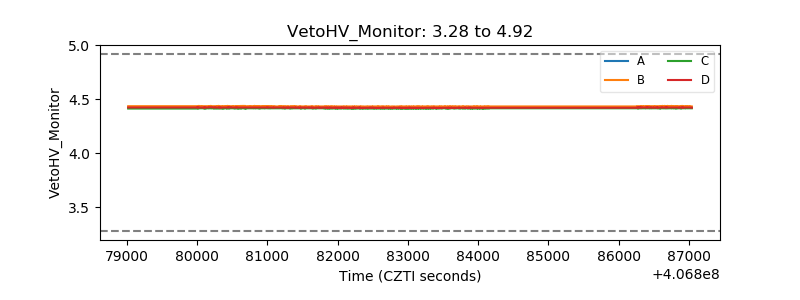 |
| Veto LLD | 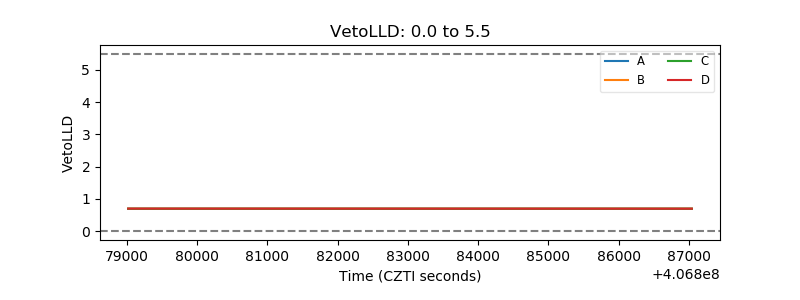 |
| Alpha Counter | 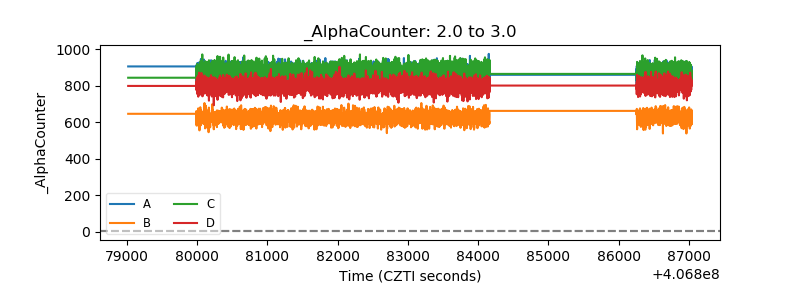 |
| _CPM_Rate | 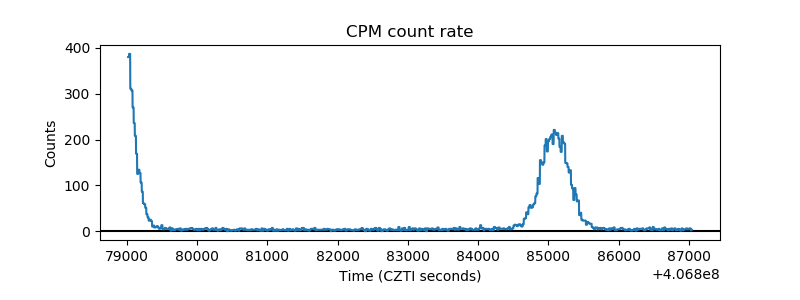 |
| CZT Counter | 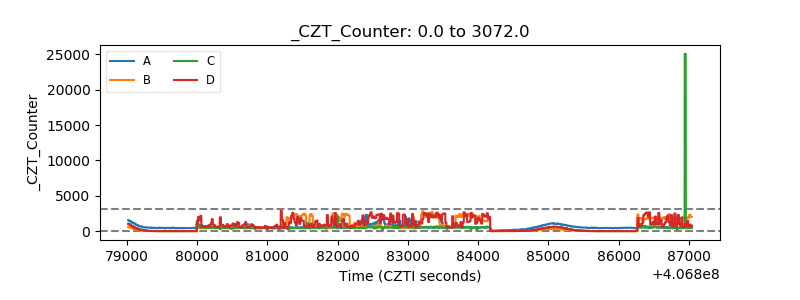 |
| +2.5 Volts monitor | 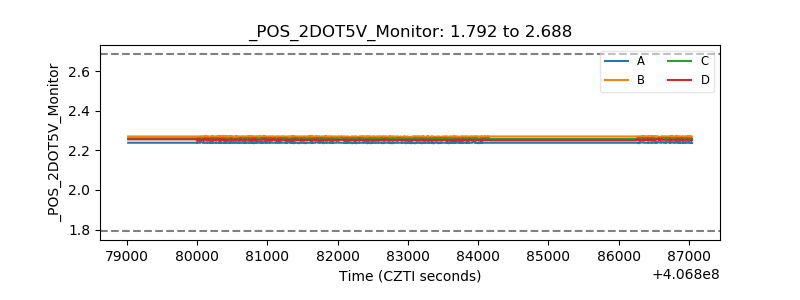 |
| +5 Volts monitor | 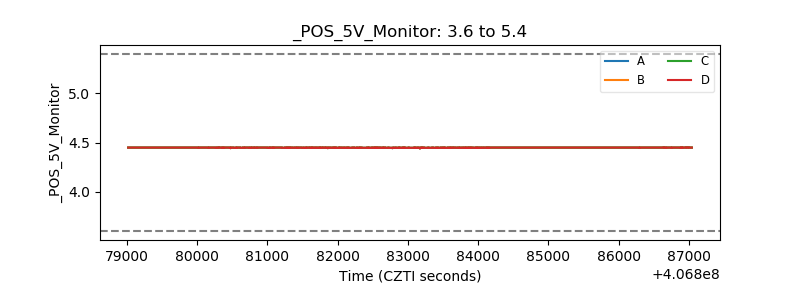 |
| _ROLL_ROT | 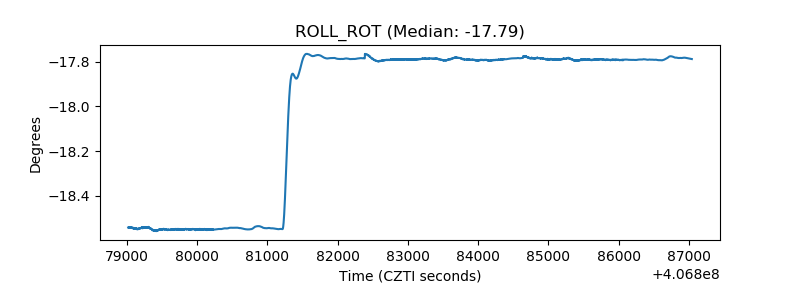 |
| _Roll_DEC | 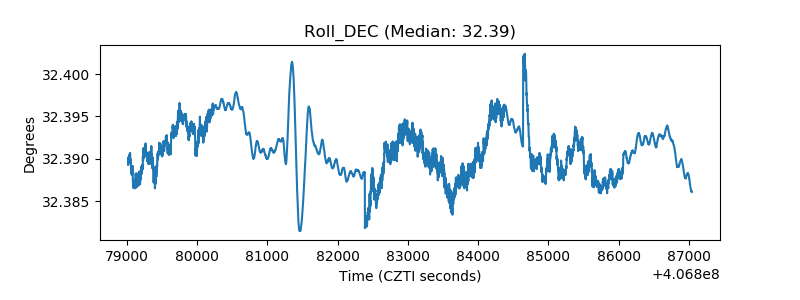 |
| _Roll_RA | 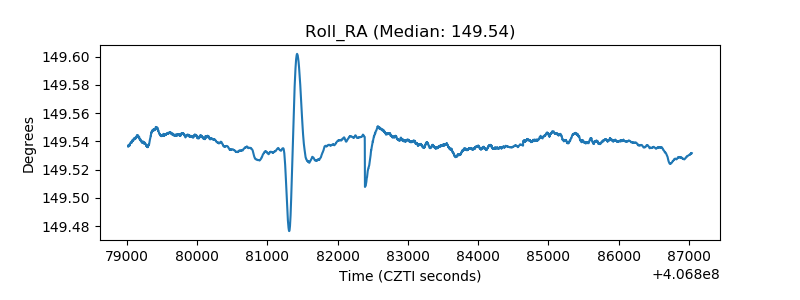 |
| Veto Counter | 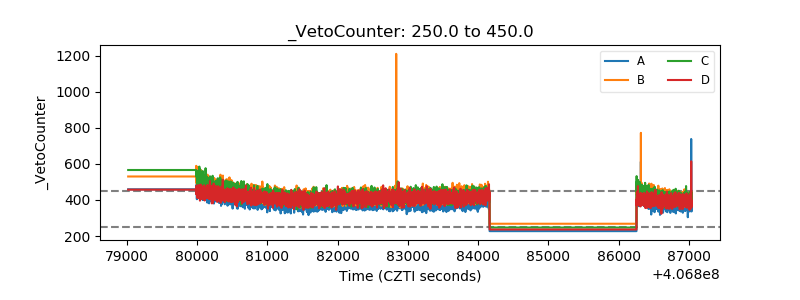 |