| Param | Original file | Final file |
|---|---|---|
| Filename | modeM0/AS1A12_054T01_9000005392_38682cztM0_level2.fits | modeM0/AS1A12_054T01_9000005392_38682cztM0_level2_quad_clean.evt |
| Size (bytes) | 570,162,240 | 73,920,960 |
| Size | 543.7 MB | 70.5 MB |
| Events in quadrant A | 2,789,044 | 589,306 |
| Events in quadrant B | 7,873,291 | 345,041 |
| Events in quadrant C | 2,673,357 | 568,523 |
| Events in quadrant D | 7,372,260 | 376,769 |
| Mode M9 | |||
|---|---|---|---|
| Quadrant | BADHDUFLAG | Total packets | Discarded packets |
| A | 0 | 19 | 0 |
| B | 0 | 19 | 0 |
| C | 0 | 19 | 0 |
| D | 0 | 20 | 0 |
| Mode SS | |||
|---|---|---|---|
| Quadrant | BADHDUFLAG | Total packets | Discarded packets |
| A | 0 | 104 | 0 |
| B | 0 | 104 | 0 |
| C | 0 | 104 | 0 |
| D | 0 | 104 | 0 |
| Mode M0 | |||
|---|---|---|---|
| Quadrant | BADHDUFLAG | Total packets | Discarded packets |
| A | 0 | 11234 | 3 |
| B | 0 | 26804 | 2 |
| C | 0 | 10964 | 2 |
| D | 0 | 25448 | 2 |
| Quadrant | Total seconds | Saturated seconds | Saturation percentage |
|---|---|---|---|
| A | 5114 | 33 | 0.645287% |
| B | 5114 | 2397 | 46.871334% |
| C | 5114 | 6 | 0.117325% |
| D | 5114 | 1658 | 32.420806% |
Noise dominated data is calculated using 1-second bins in cleaned event files. If a bin has >2000 counts, and if more than 50% of those come from <1% of pixels, then it is considered to be noise-dominated and hence unusable.
| Quadrant | # 1 sec bins | Bins with >0 counts | Bins with >2000 counts | High rate bins dominated by noise | Noise dominated (total time) | Noise dominated (detector-on time) | Marked lightcurve |
|---|---|---|---|---|---|---|---|
| A | 6998 | 5115 | 24 | 24 | 0.34% | 0.47% | 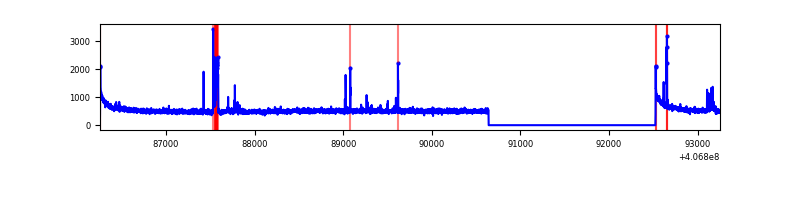 |
| B | 6998 | 5115 | 2179 | 2179 | 31.14% | 42.60% | 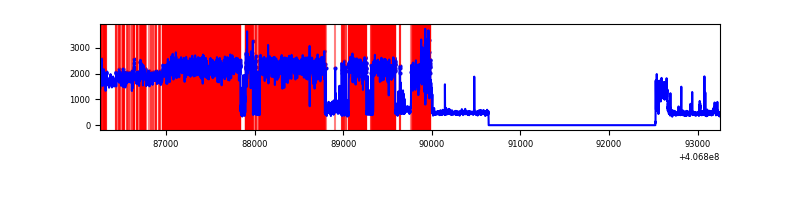 |
| C | 6998 | 5115 | 6 | 6 | 0.09% | 0.12% | 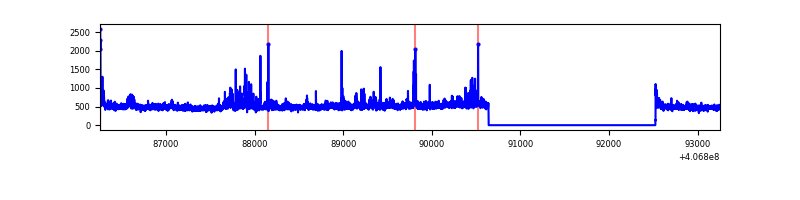 |
| D | 6998 | 5115 | 1448 | 1448 | 20.69% | 28.31% | 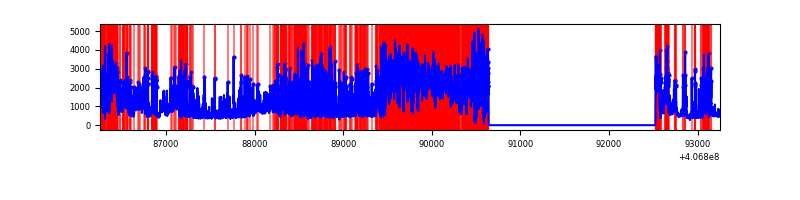 |
Top three noisy pixels from each quadrant. If the there are fewer than three noisy pixels in the level2.evt file, extra rows are filled as -1
| Pixel properties | Quadrant properties | ||||||
|---|---|---|---|---|---|---|---|
| Quadrant | DetID | PixID | Counts | Sigma | Mean | Median | Sigma |
| A | 10 | 83 | 386897 | 3261.78 | 584 | 572 | 118.4 |
| A | 15 | 174 | 67957 | 568.94 | 584 | 572 | 118.4 |
| A | 13 | 248 | 66549 | 557.05 | 584 | 572 | 118.4 |
| B | 4 | 251 | 5567688 | 55792.4 | 514 | 500 | 99.8 |
| B | 4 | 171 | 258847 | 2589.06 | 514 | 500 | 99.8 |
| B | 12 | 111 | 12440 | 119.66 | 514 | 500 | 99.8 |
| C | 15 | 214 | 209742 | 1583.43 | 567 | 570 | 132.1 |
| C | 14 | 254 | 91110 | 685.39 | 567 | 570 | 132.1 |
| C | 1 | 23 | 80220 | 602.95 | 567 | 570 | 132.1 |
| D | 12 | 227 | 3759488 | 31157.39 | 483 | 468 | 120.6 |
| D | 10 | 118 | 537467 | 4451.02 | 483 | 468 | 120.6 |
| D | 5 | 222 | 458819 | 3799.13 | 483 | 468 | 120.6 |
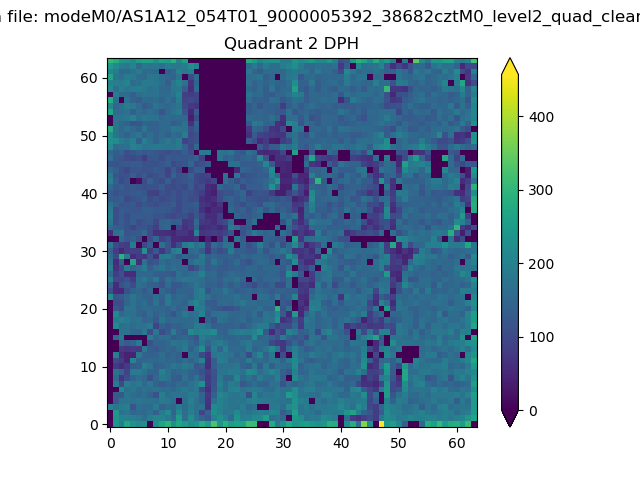
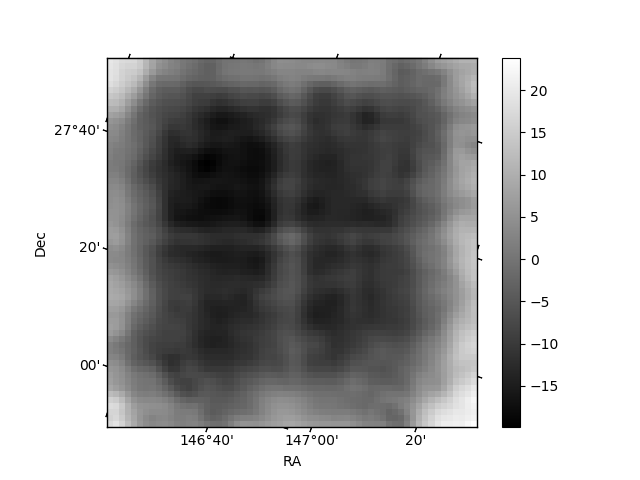
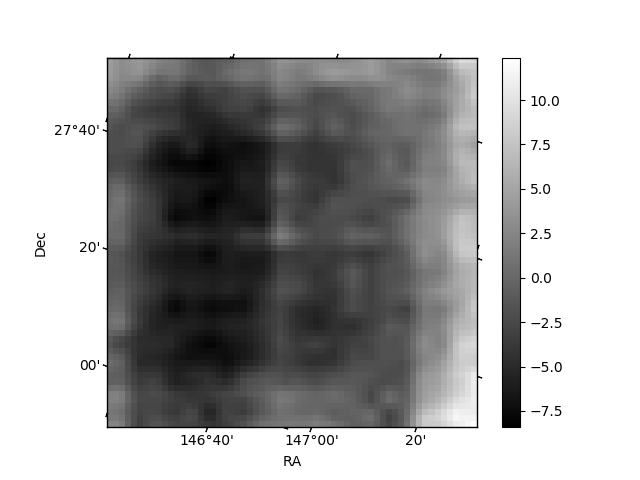
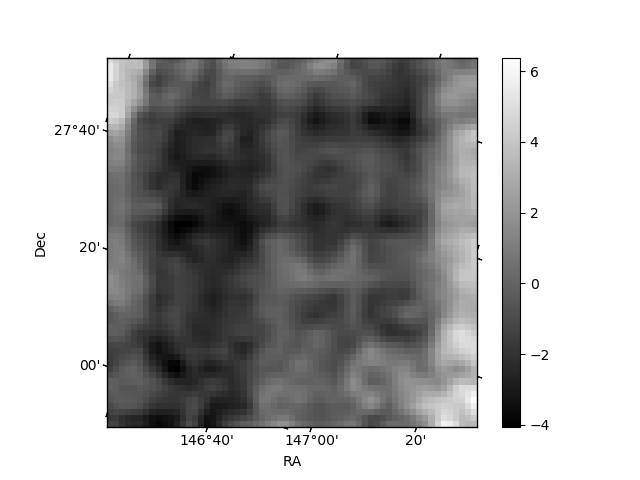
Histogram calculated using DETX and DETY for each event in the final _common_clean file
| Quadrant A | 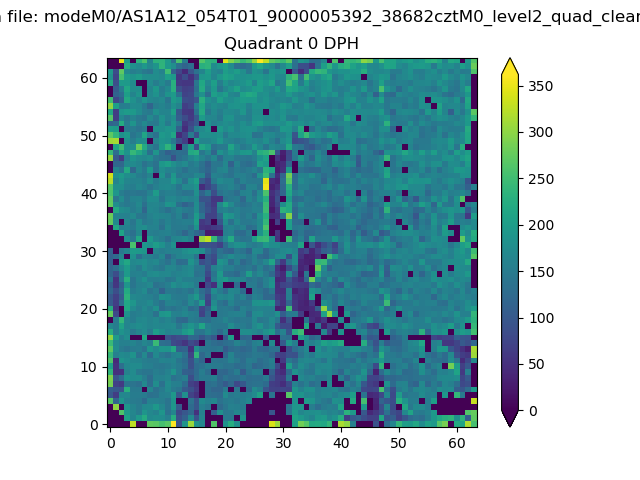 |
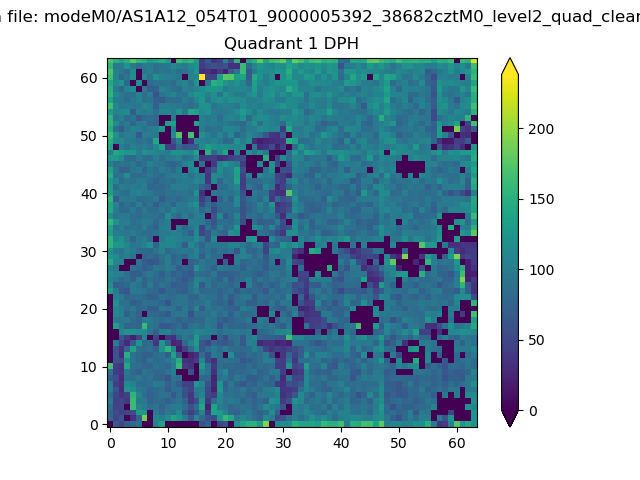 |
Quadrant B |
|---|---|---|---|
| Quadrant D | 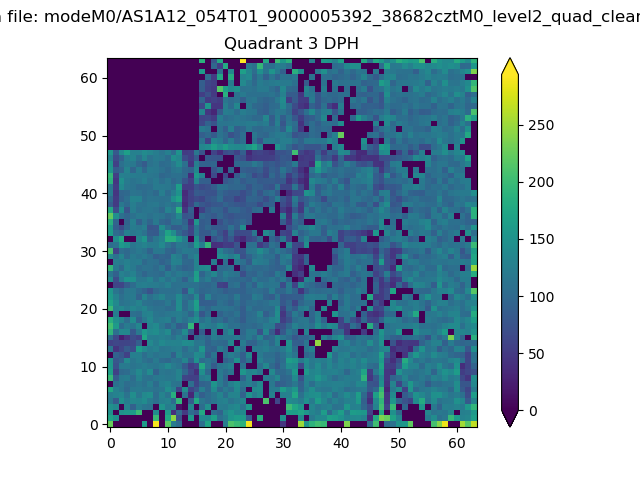 |
 |
Quadrant C |
| Plot type | Count rate plots | Images |
|---|---|---|
| Comparison with Poisson distribution Blue bars denote a histogram of data divided into 1 sec bins. Red curve is a Poisson curve with rate = median count rate of data. |
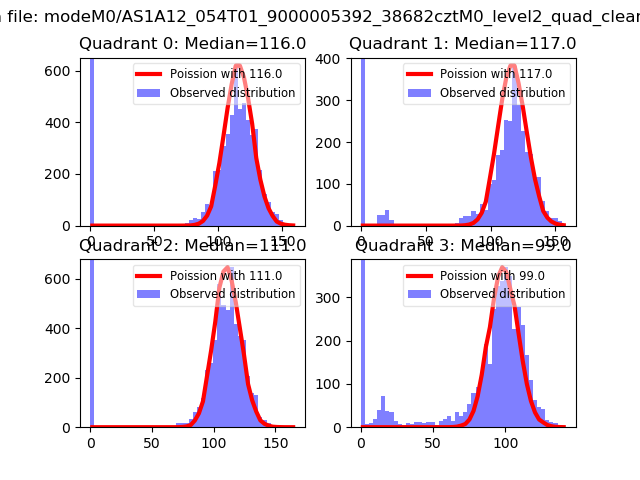 |
 |
| Quadrant-wise count rates Data is divided into 100 sec bins |
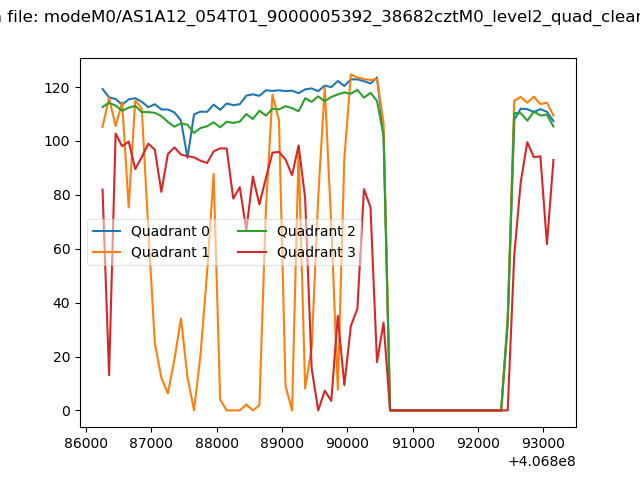 |
|
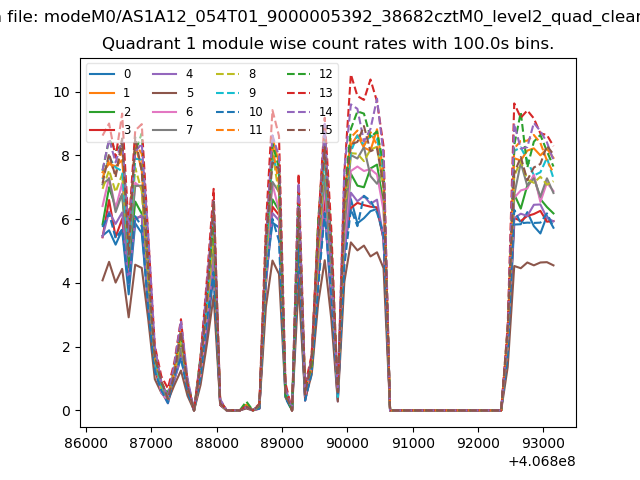
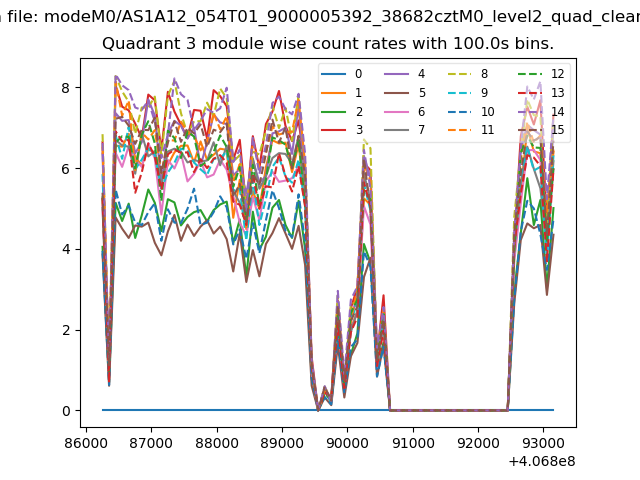
| Module-wise count rates for Quadrant A Data is divided into 100 sec bins |
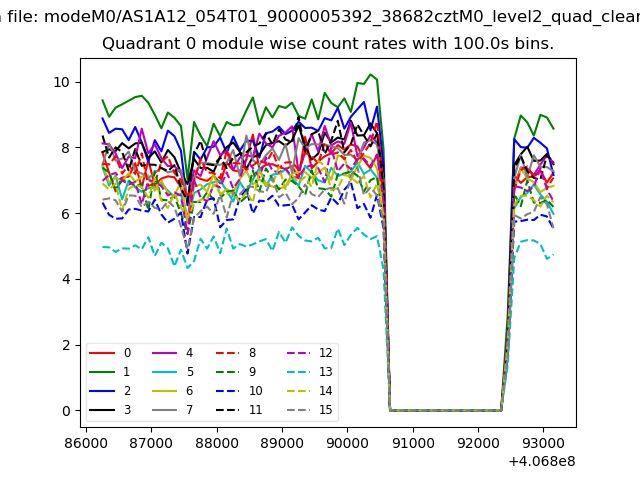 |
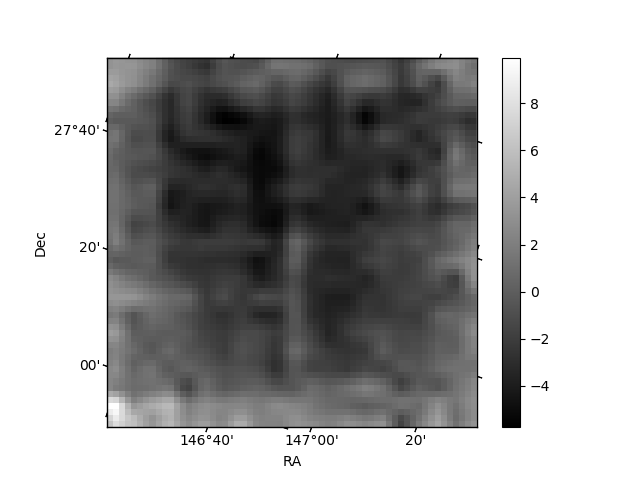 |
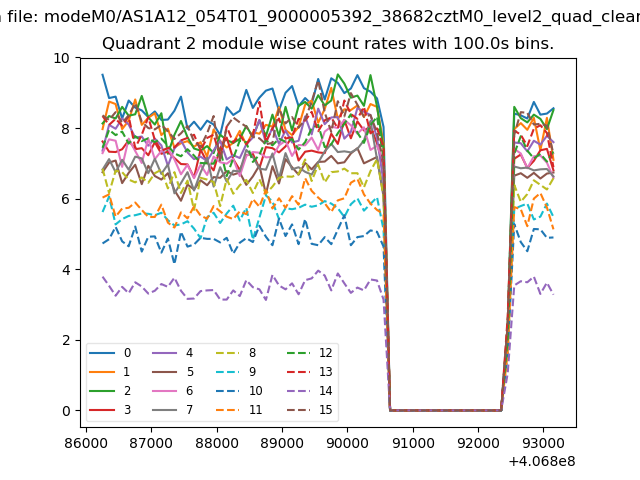
| Module-wise count rates for Quadrant B Data is divided into 100 sec bins |
 |
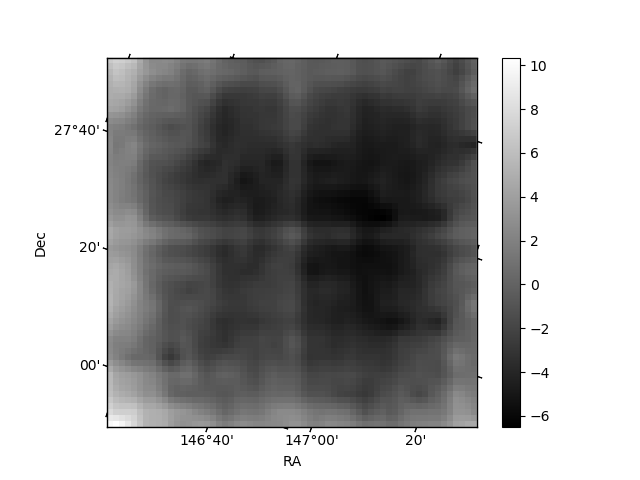 |
| Module-wise count rates for Quadrant C Data is divided into 100 sec bins |
 |
 |
| Module-wise count rates for Quadrant D Data is divided into 100 sec bins |
 |
 |
| Parameter | Plot |
|---|---|
| CZT HV Monitor | 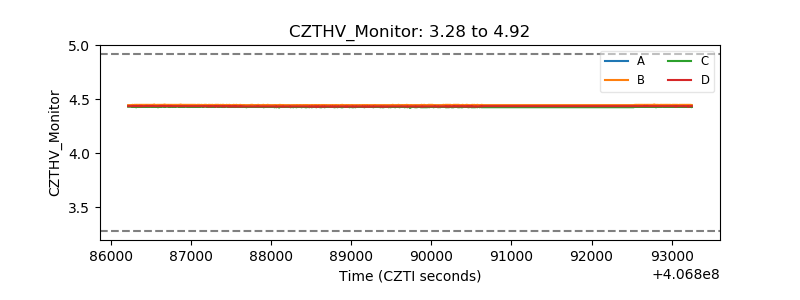 |
| D_VDD | 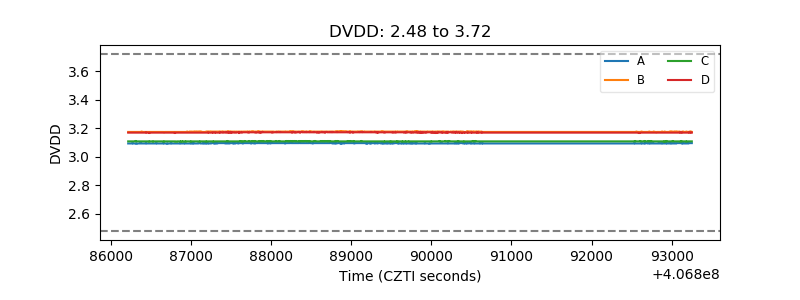 |
| Temperature 1 | 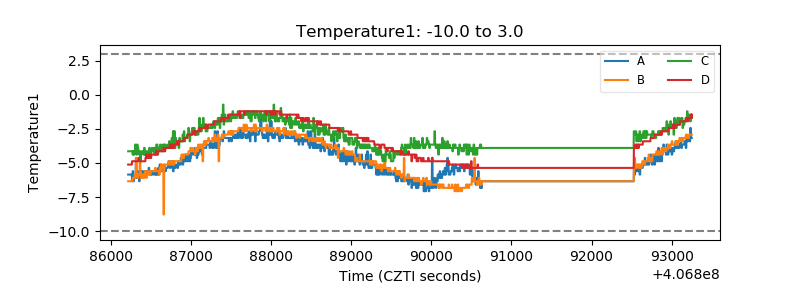 |
| Veto HV Monitor | 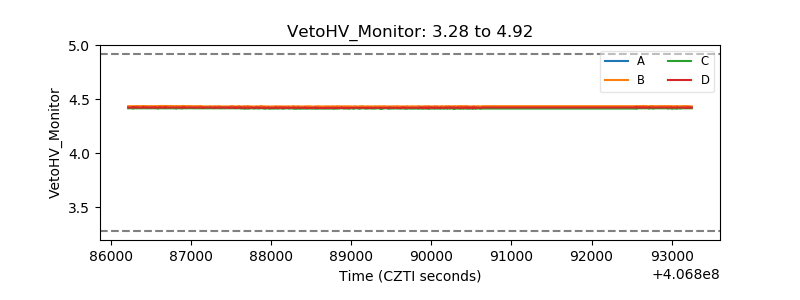 |
| Veto LLD | 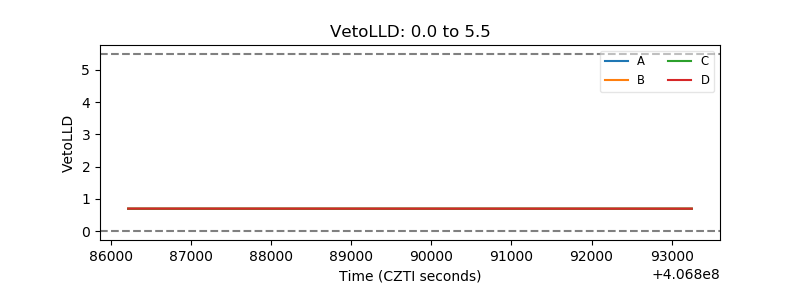 |
| Alpha Counter | 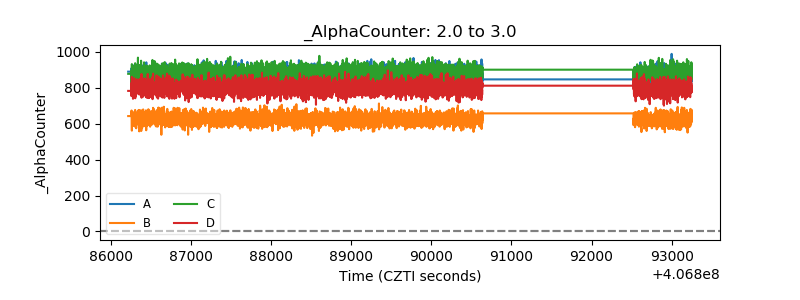 |
| _CPM_Rate | 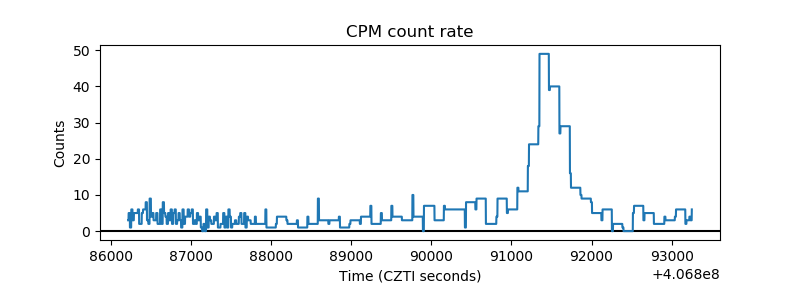 |
| CZT Counter | 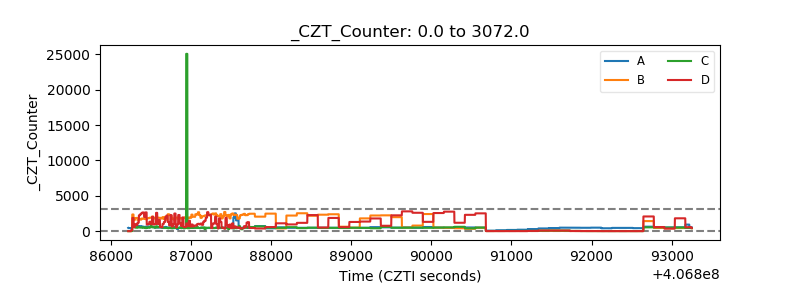 |
| +2.5 Volts monitor | 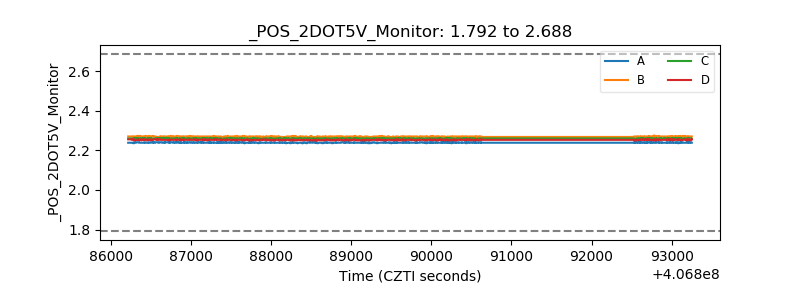 |
| +5 Volts monitor | 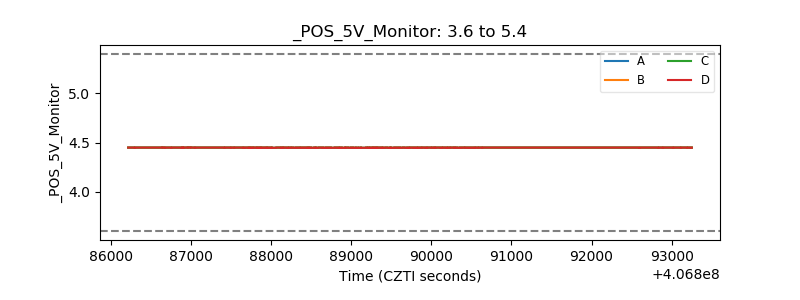 |
| _ROLL_ROT | 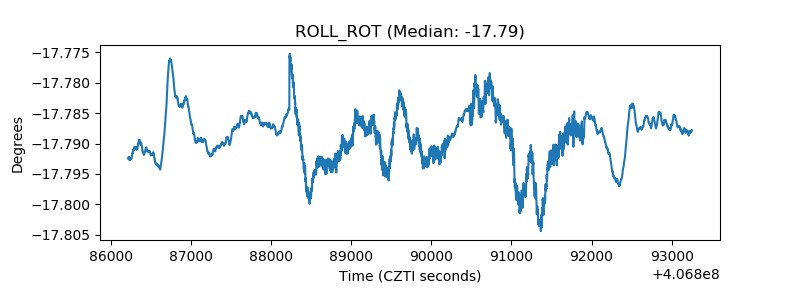 |
| _Roll_DEC | 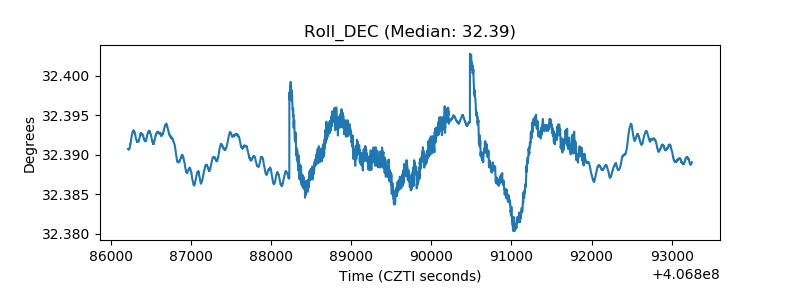 |
| _Roll_RA | 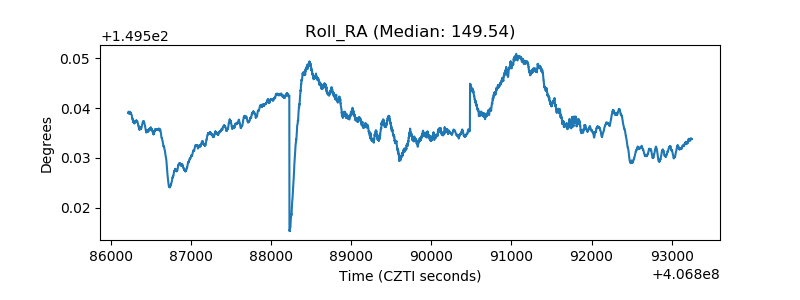 |
| Veto Counter | 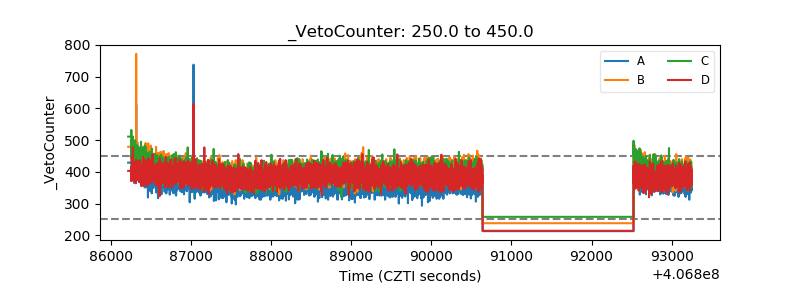 |