| Param | Original file | Final file |
|---|---|---|
| Filename | modeM0/AS1A12_054T01_9000005392_38683cztM0_level2.fits | modeM0/AS1A12_054T01_9000005392_38683cztM0_level2_quad_clean.evt |
| Size (bytes) | 388,779,840 | 90,976,320 |
| Size | 370.8 MB | 86.8 MB |
| Events in quadrant A | 3,061,060 | 618,784 |
| Events in quadrant B | 3,810,995 | 620,753 |
| Events in quadrant C | 2,666,957 | 600,617 |
| Events in quadrant D | 4,424,310 | 529,240 |
| Mode M9 | |||
|---|---|---|---|
| Quadrant | BADHDUFLAG | Total packets | Discarded packets |
| A | 0 | 15 | 0 |
| B | 0 | 15 | 0 |
| C | 0 | 15 | 0 |
| D | 0 | 15 | 0 |
| Mode SS | |||
|---|---|---|---|
| Quadrant | BADHDUFLAG | Total packets | Discarded packets |
| A | 0 | 112 | 0 |
| B | 0 | 112 | 0 |
| C | 0 | 112 | 0 |
| D | 0 | 112 | 0 |
| Mode M0 | |||
|---|---|---|---|
| Quadrant | BADHDUFLAG | Total packets | Discarded packets |
| A | 0 | 12327 | 3 |
| B | 0 | 14873 | 2 |
| C | 0 | 11255 | 2 |
| D | 0 | 16865 | 2 |
| Quadrant | Total seconds | Saturated seconds | Saturation percentage |
|---|---|---|---|
| A | 5504 | 59 | 1.071948% |
| B | 5504 | 228 | 4.142442% |
| C | 5504 | 4 | 0.072674% |
| D | 5504 | 361 | 6.558866% |
Noise dominated data is calculated using 1-second bins in cleaned event files. If a bin has >2000 counts, and if more than 50% of those come from <1% of pixels, then it is considered to be noise-dominated and hence unusable.
| Quadrant | # 1 sec bins | Bins with >0 counts | Bins with >2000 counts | High rate bins dominated by noise | Noise dominated (total time) | Noise dominated (detector-on time) | Marked lightcurve |
|---|---|---|---|---|---|---|---|
| A | 7026 | 5505 | 46 | 46 | 0.65% | 0.84% | 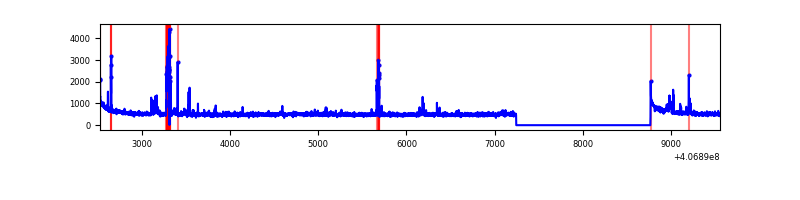 |
| B | 7026 | 5505 | 216 | 216 | 3.07% | 3.92% | 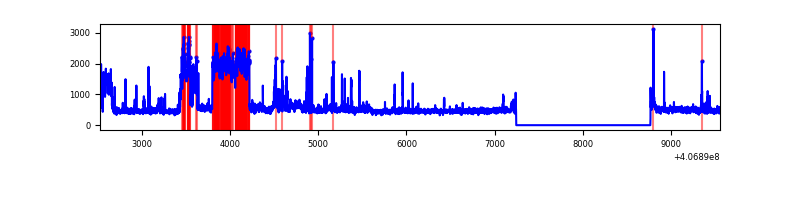 |
| C | 7026 | 5505 | 3 | 3 | 0.04% | 0.05% | 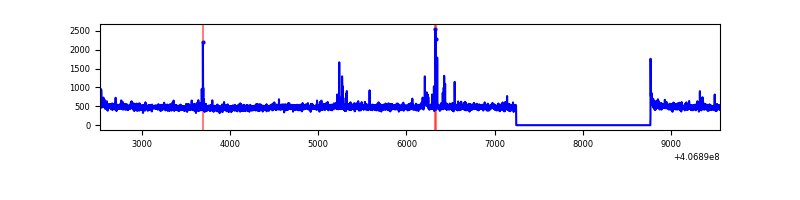 |
| D | 7026 | 5505 | 294 | 294 | 4.18% | 5.34% | 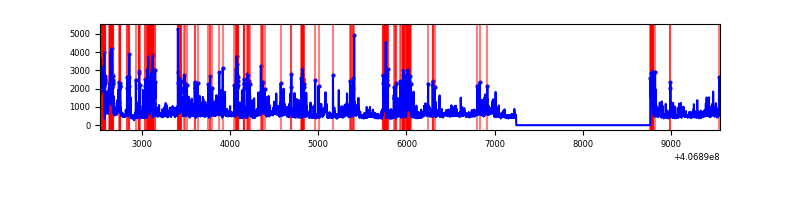 |
Top three noisy pixels from each quadrant. If the there are fewer than three noisy pixels in the level2.evt file, extra rows are filled as -1
| Pixel properties | Quadrant properties | ||||||
|---|---|---|---|---|---|---|---|
| Quadrant | DetID | PixID | Counts | Sigma | Mean | Median | Sigma |
| A | 10 | 83 | 408559 | 3206.24 | 621 | 608 | 127.2 |
| A | 15 | 174 | 142487 | 1115.08 | 621 | 608 | 127.2 |
| A | 13 | 248 | 90761 | 708.55 | 621 | 608 | 127.2 |
| B | 4 | 251 | 1168221 | 9794.19 | 614 | 596 | 119.2 |
| B | 4 | 171 | 142275 | 1188.42 | 614 | 596 | 119.2 |
| B | 4 | 170 | 30352 | 249.59 | 614 | 596 | 119.2 |
| C | 15 | 214 | 223158 | 1579.95 | 605 | 609 | 140.9 |
| C | 15 | 208 | 44972 | 314.95 | 605 | 609 | 140.9 |
| C | 0 | 10 | 16350 | 111.75 | 605 | 609 | 140.9 |
| D | 12 | 227 | 454262 | 3086.19 | 591 | 571 | 147.0 |
| D | 10 | 118 | 381887 | 2593.86 | 591 | 571 | 147.0 |
| D | 2 | 16 | 337820 | 2294.1 | 591 | 571 | 147.0 |
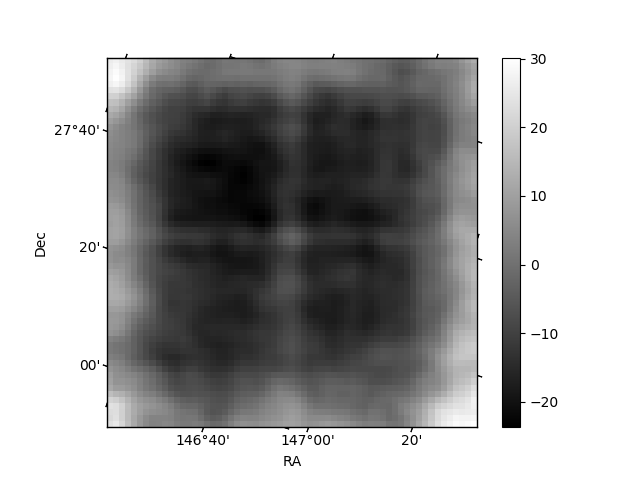
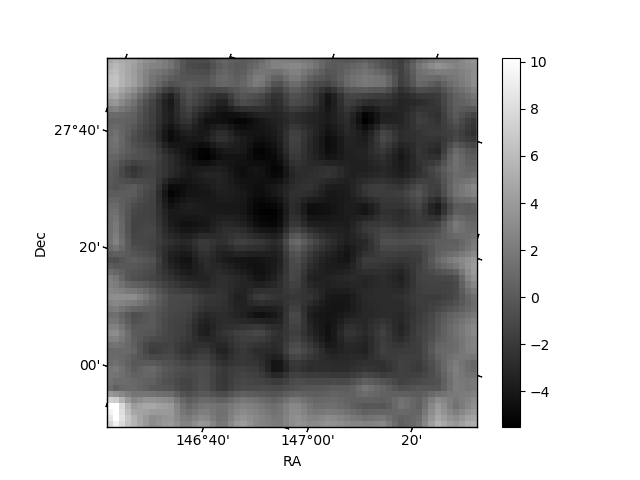
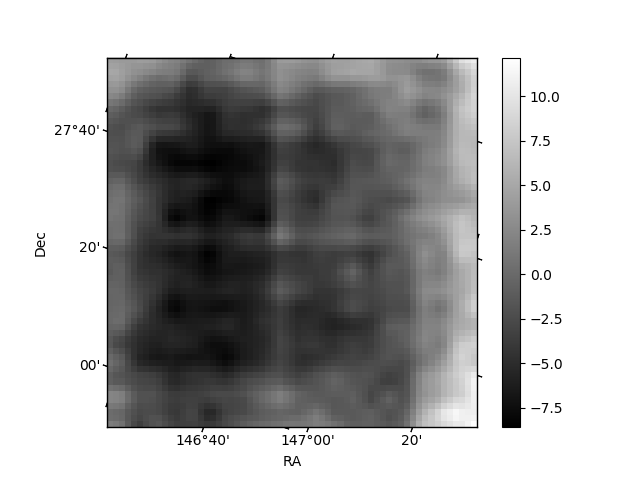
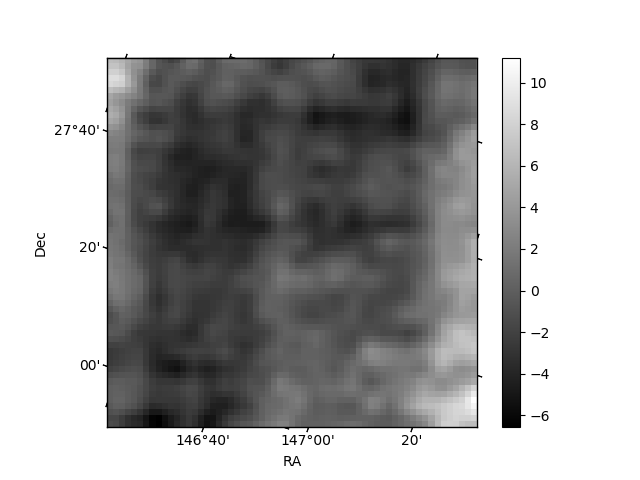
Histogram calculated using DETX and DETY for each event in the final _common_clean file
| Quadrant A | 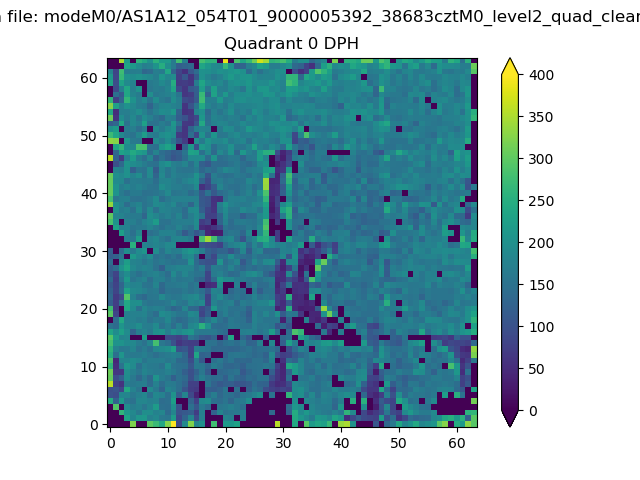 |
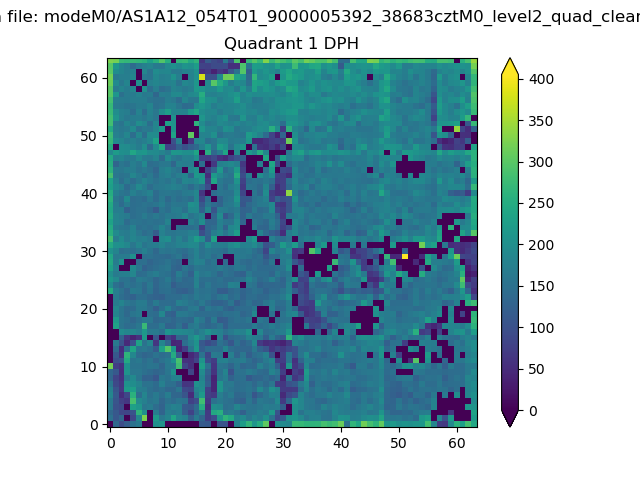 |
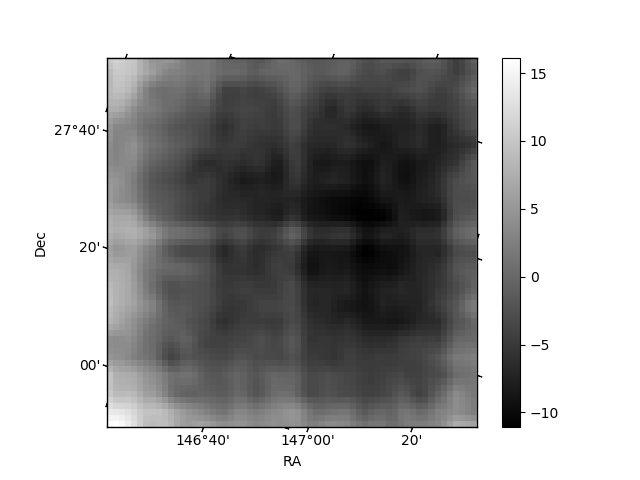
Quadrant B |
|---|---|---|---|
| Quadrant D | 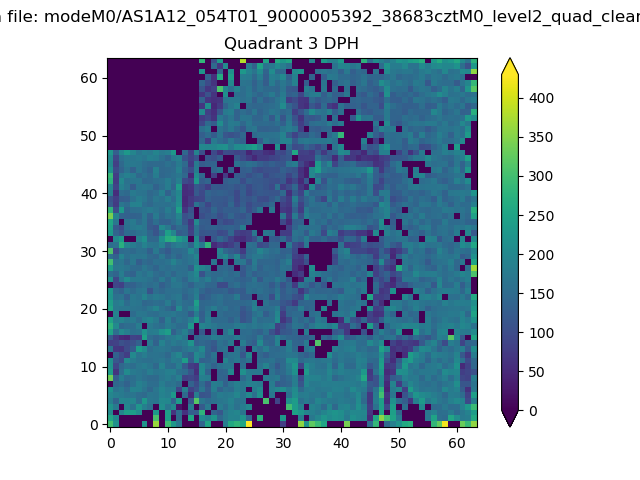 |
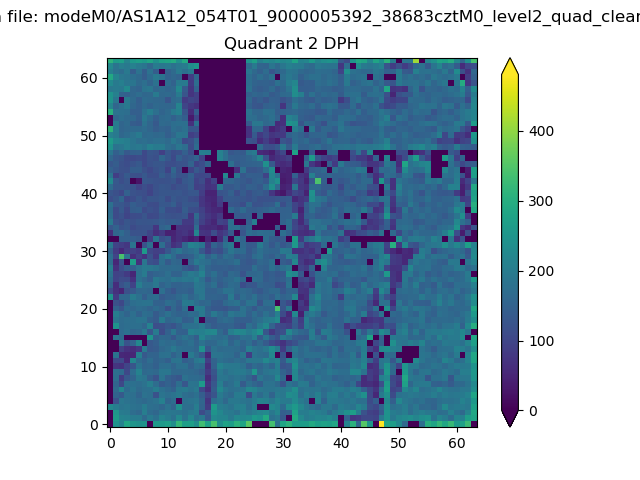 |
Quadrant C |
| Plot type | Count rate plots | Images |
|---|---|---|
| Comparison with Poisson distribution Blue bars denote a histogram of data divided into 1 sec bins. Red curve is a Poisson curve with rate = median count rate of data. |
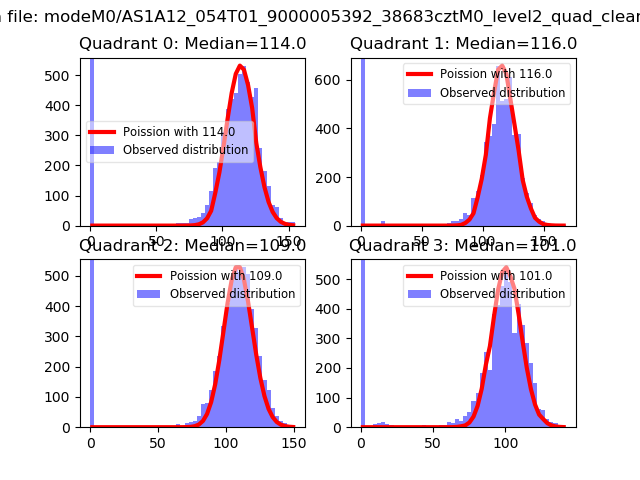 |
 |
| Quadrant-wise count rates Data is divided into 100 sec bins |
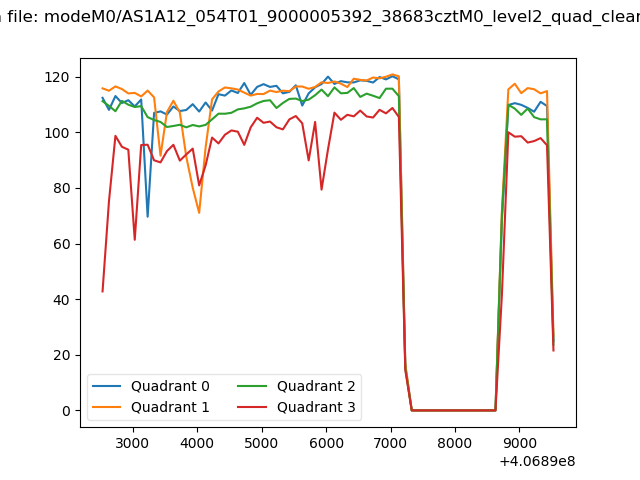 |
|
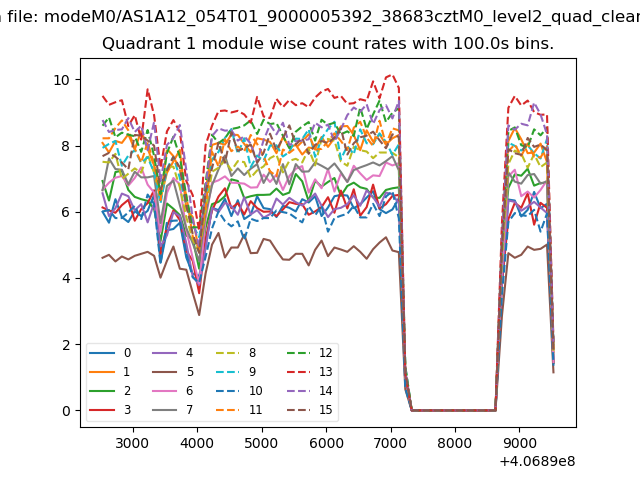
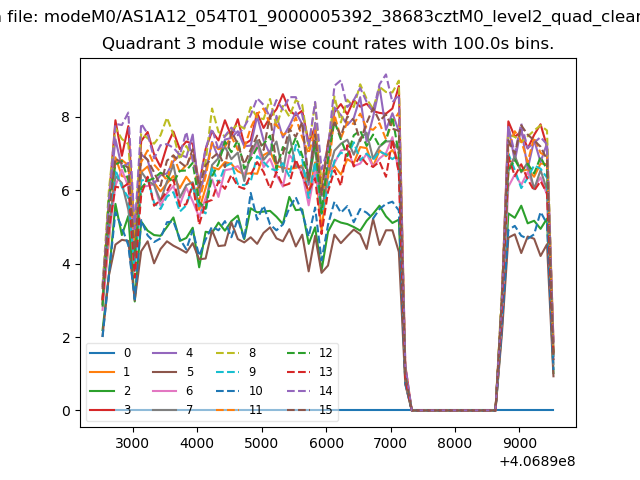
| Module-wise count rates for Quadrant A Data is divided into 100 sec bins |
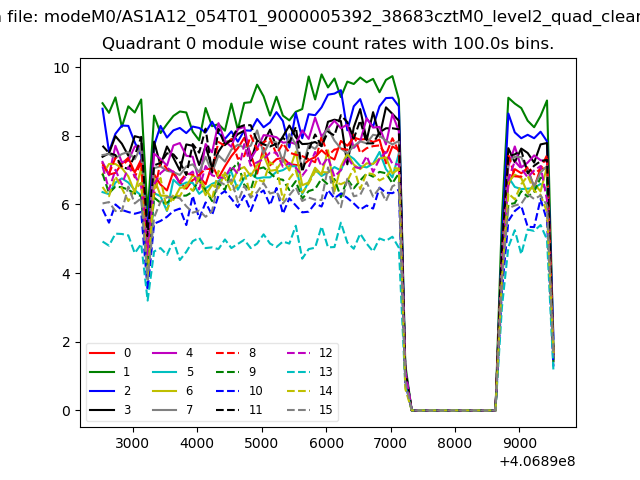 |
 |
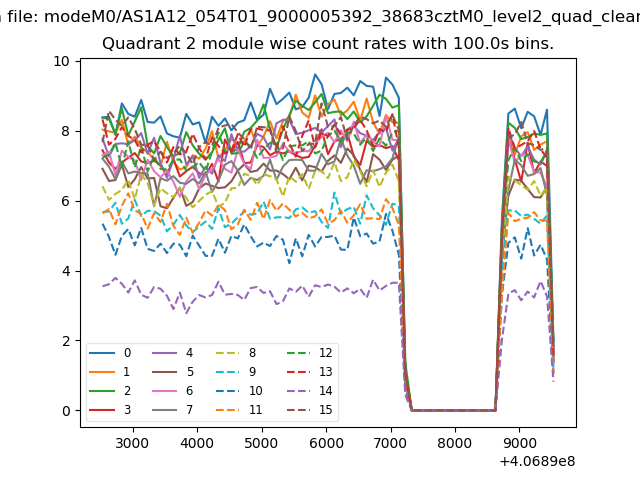
| Module-wise count rates for Quadrant B Data is divided into 100 sec bins |
 |
 |
| Module-wise count rates for Quadrant C Data is divided into 100 sec bins |
 |
 |
| Module-wise count rates for Quadrant D Data is divided into 100 sec bins |
 |
 |
| Parameter | Plot |
|---|---|
| CZT HV Monitor | 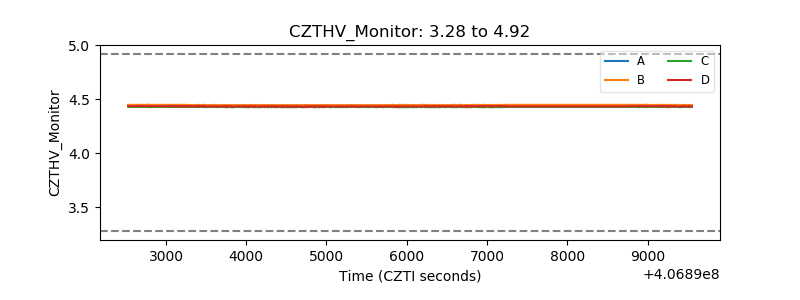 |
| D_VDD | 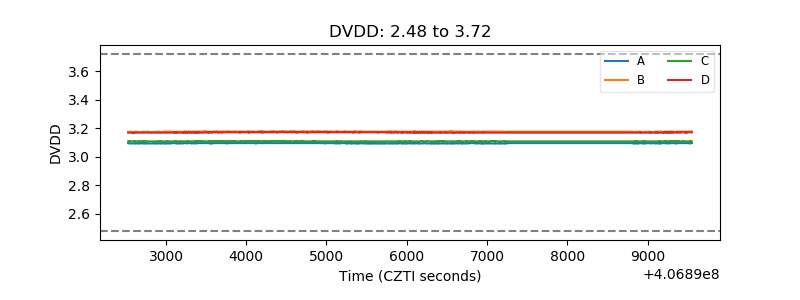 |
| Temperature 1 | 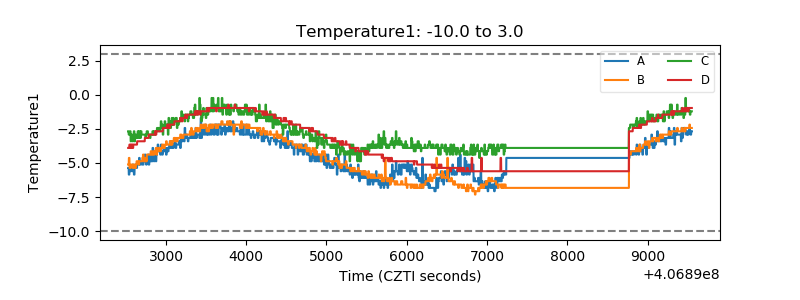 |
| Veto HV Monitor | 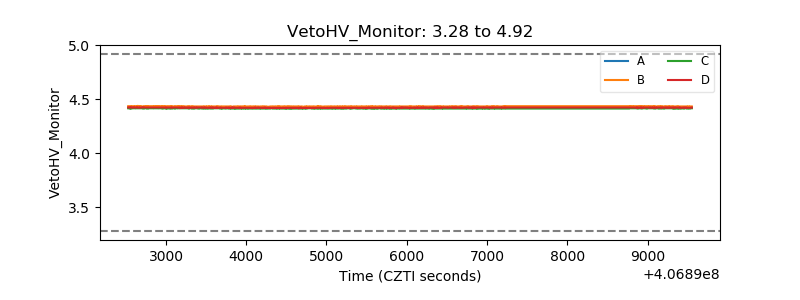 |
| Veto LLD | 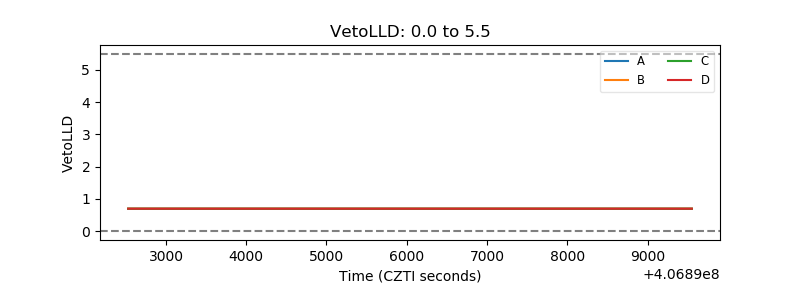 |
| Alpha Counter | 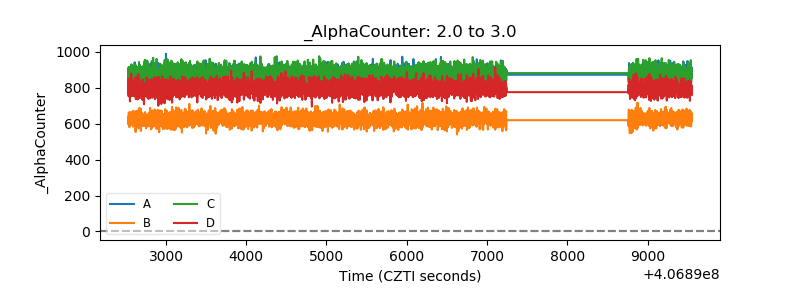 |
| _CPM_Rate | 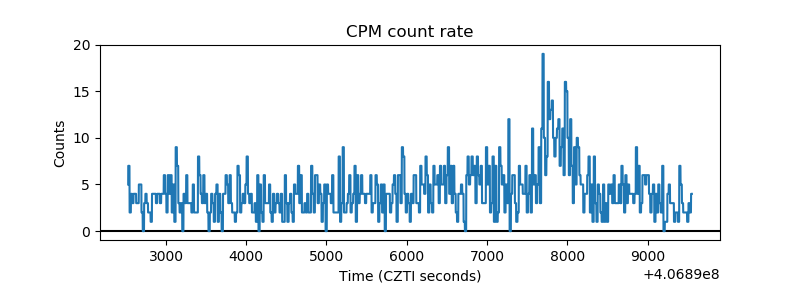 |
| CZT Counter | 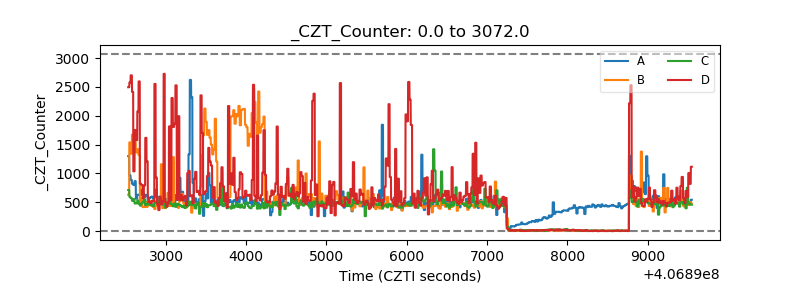 |
| +2.5 Volts monitor | 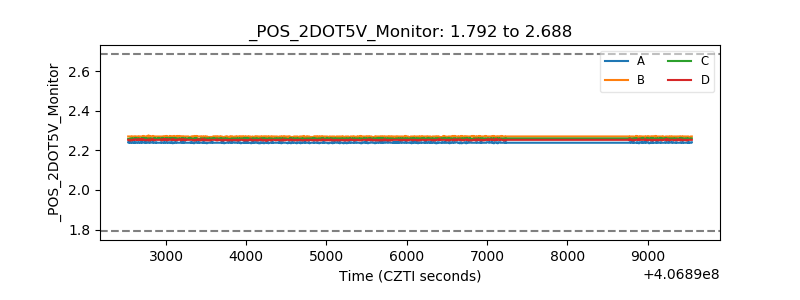 |
| +5 Volts monitor | 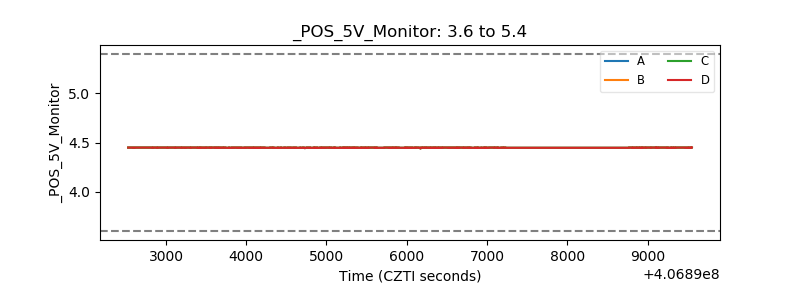 |
| _ROLL_ROT | 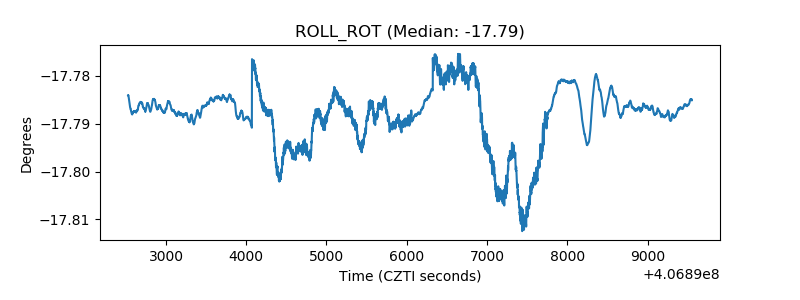 |
| _Roll_DEC | 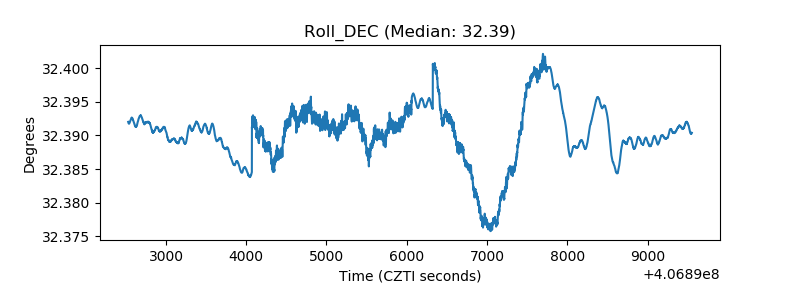 |
| _Roll_RA | 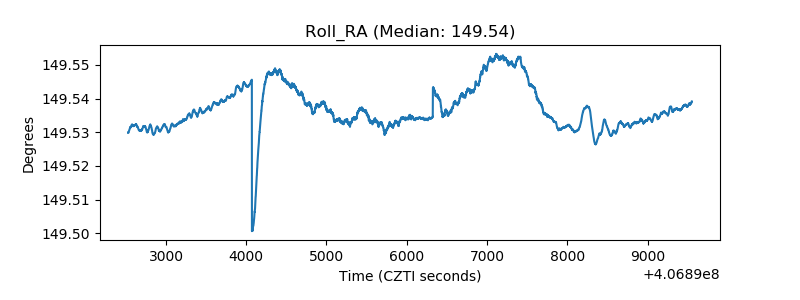 |
| Veto Counter | 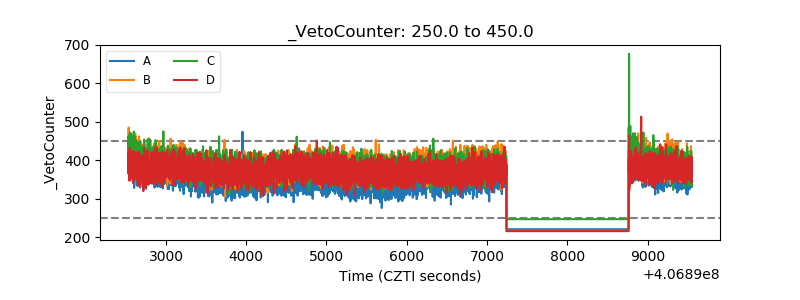 |