| Param | Original file | Final file |
|---|---|---|
| Filename | modeM0/AS1A12_054T01_9000005392_38684cztM0_level2.fits | modeM0/AS1A12_054T01_9000005392_38684cztM0_level2_quad_clean.evt |
| Size (bytes) | 428,676,480 | 95,040,000 |
| Size | 408.8 MB | 90.6 MB |
| Events in quadrant A | 3,157,873 | 657,959 |
| Events in quadrant B | 2,940,131 | 668,881 |
| Events in quadrant C | 2,837,929 | 631,044 |
| Events in quadrant D | 6,476,168 | 509,691 |
| Mode M9 | |||
|---|---|---|---|
| Quadrant | BADHDUFLAG | Total packets | Discarded packets |
| A | 0 | 15 | 0 |
| B | 0 | 15 | 0 |
| C | 0 | 15 | 0 |
| D | 0 | 16 | 0 |
| Mode SS | |||
|---|---|---|---|
| Quadrant | BADHDUFLAG | Total packets | Discarded packets |
| A | 0 | 120 | 0 |
| B | 0 | 120 | 0 |
| C | 0 | 120 | 0 |
| D | 0 | 120 | 0 |
| Mode M0 | |||
|---|---|---|---|
| Quadrant | BADHDUFLAG | Total packets | Discarded packets |
| A | 0 | 12878 | 3 |
| B | 0 | 12593 | 2 |
| C | 0 | 11997 | 2 |
| D | 0 | 23306 | 2 |
| Quadrant | Total seconds | Saturated seconds | Saturation percentage |
|---|---|---|---|
| A | 5865 | 35 | 0.596760% |
| B | 5865 | 30 | 0.511509% |
| C | 5865 | 13 | 0.221654% |
| D | 5865 | 935 | 15.942029% |
Noise dominated data is calculated using 1-second bins in cleaned event files. If a bin has >2000 counts, and if more than 50% of those come from <1% of pixels, then it is considered to be noise-dominated and hence unusable.
| Quadrant | # 1 sec bins | Bins with >0 counts | Bins with >2000 counts | High rate bins dominated by noise | Noise dominated (total time) | Noise dominated (detector-on time) | Marked lightcurve |
|---|---|---|---|---|---|---|---|
| A | 7177 | 5866 | 22 | 22 | 0.31% | 0.38% | 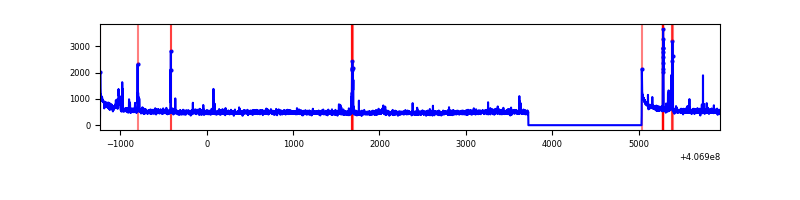 |
| B | 7177 | 5866 | 10 | 10 | 0.14% | 0.17% | 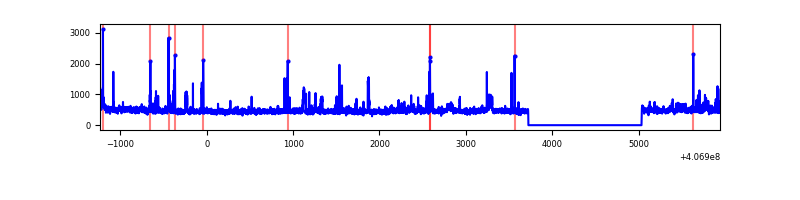 |
| C | 7177 | 5866 | 7 | 7 | 0.10% | 0.12% | 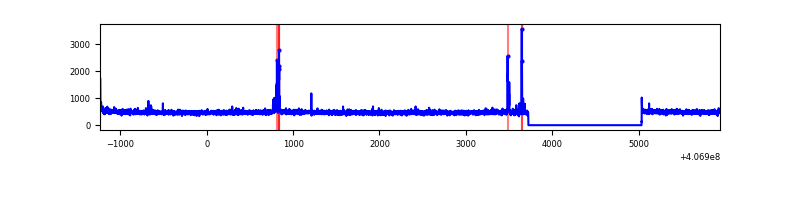 |
| D | 7177 | 5866 | 896 | 896 | 12.48% | 15.27% | 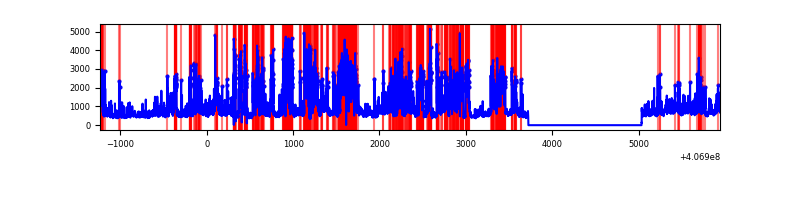 |
Top three noisy pixels from each quadrant. If the there are fewer than three noisy pixels in the level2.evt file, extra rows are filled as -1
| Pixel properties | Quadrant properties | ||||||
|---|---|---|---|---|---|---|---|
| Quadrant | DetID | PixID | Counts | Sigma | Mean | Median | Sigma |
| A | 10 | 83 | 428685 | 3166.54 | 663 | 649 | 135.2 |
| A | 13 | 248 | 89776 | 659.35 | 663 | 649 | 135.2 |
| A | 15 | 174 | 69849 | 511.93 | 663 | 649 | 135.2 |
| B | 4 | 251 | 169208 | 1314.73 | 658 | 641 | 128.2 |
| B | 4 | 171 | 86843 | 672.33 | 658 | 641 | 128.2 |
| B | 5 | 184 | 71926 | 555.98 | 658 | 641 | 128.2 |
| C | 15 | 214 | 237739 | 1561.49 | 645 | 649 | 151.8 |
| C | 14 | 254 | 44241 | 287.1 | 645 | 649 | 151.8 |
| C | 5 | 237 | 22085 | 141.18 | 645 | 649 | 151.8 |
| D | 12 | 227 | 3228668 | 21900.61 | 591 | 571 | 147.4 |
| D | 2 | 16 | 247753 | 1676.97 | 591 | 571 | 147.4 |
| D | 14 | 52 | 142584 | 963.47 | 591 | 571 | 147.4 |
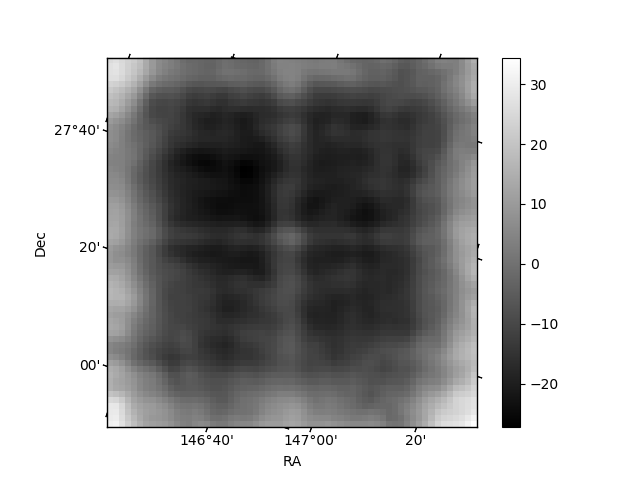
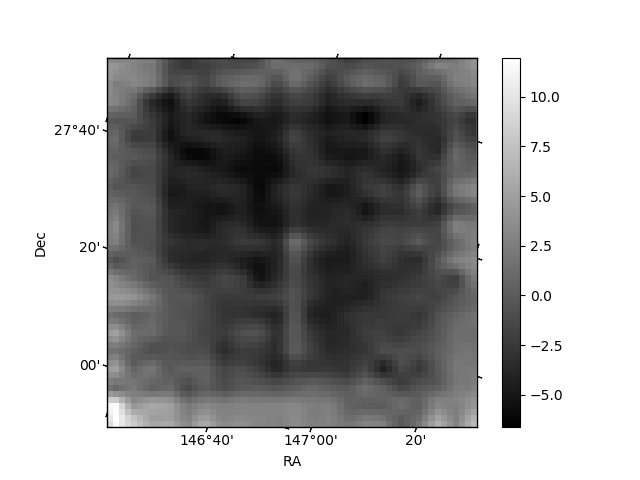
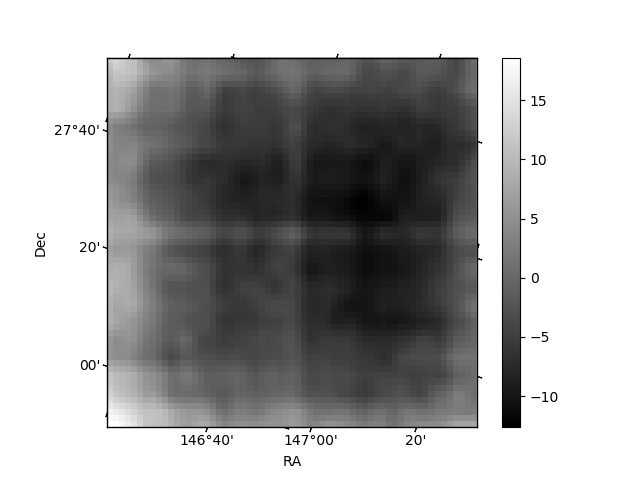
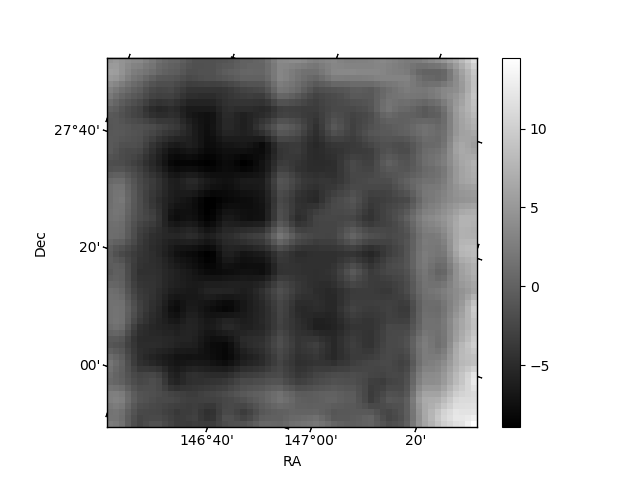
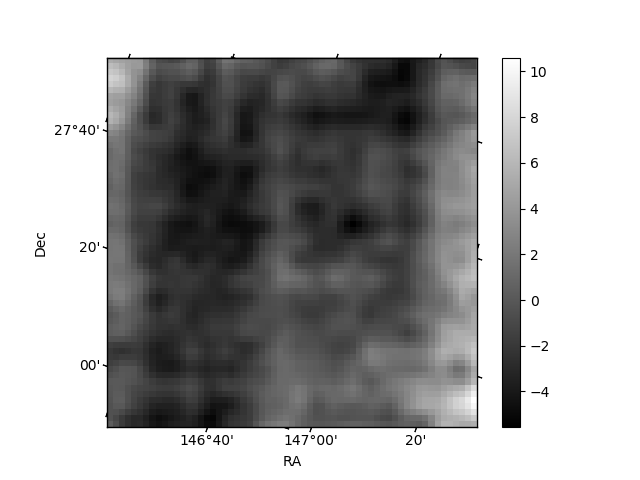
Histogram calculated using DETX and DETY for each event in the final _common_clean file
| Quadrant A | 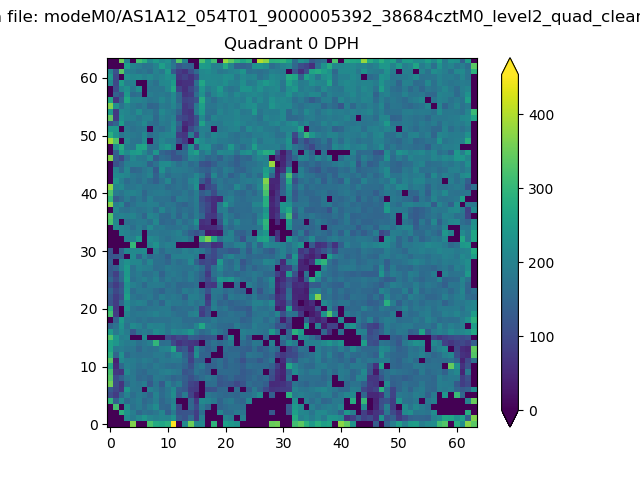 |
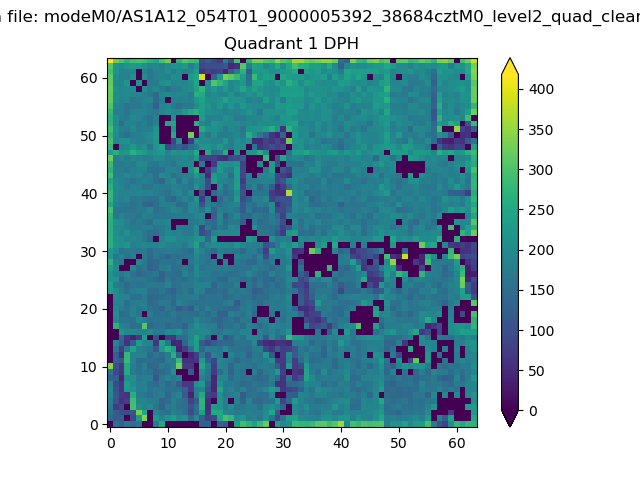 |
Quadrant B |
|---|---|---|---|
| Quadrant D | 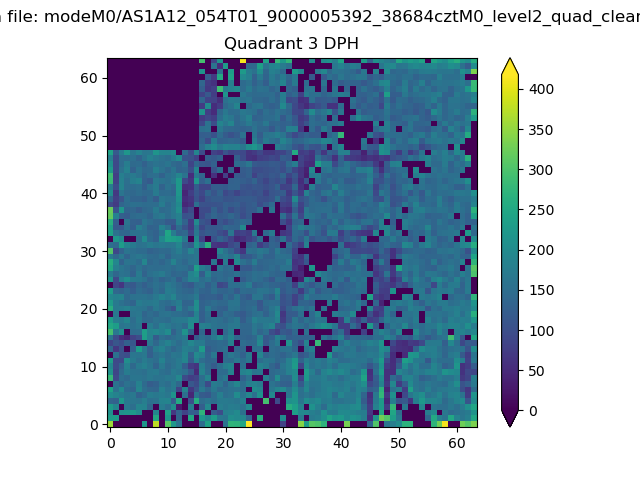 |
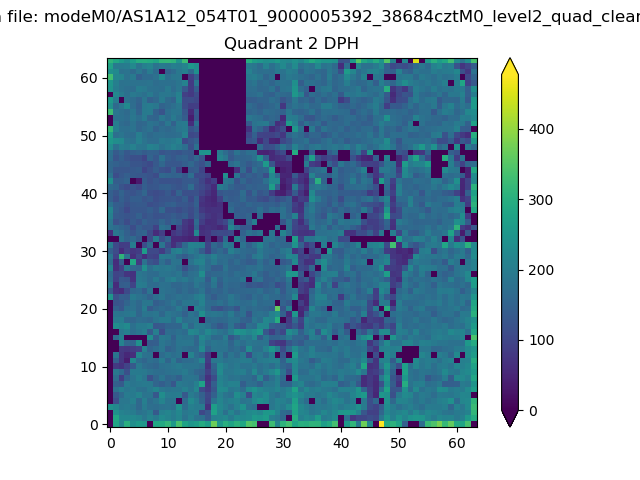 |
Quadrant C |
| Plot type | Count rate plots | Images |
|---|---|---|
| Comparison with Poisson distribution Blue bars denote a histogram of data divided into 1 sec bins. Red curve is a Poisson curve with rate = median count rate of data. |
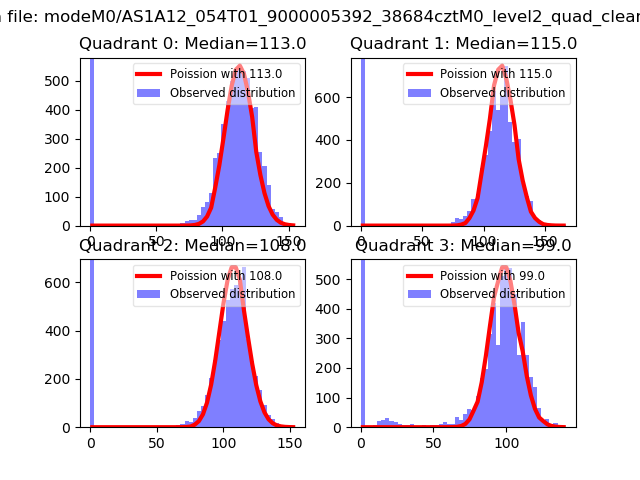 |
 |
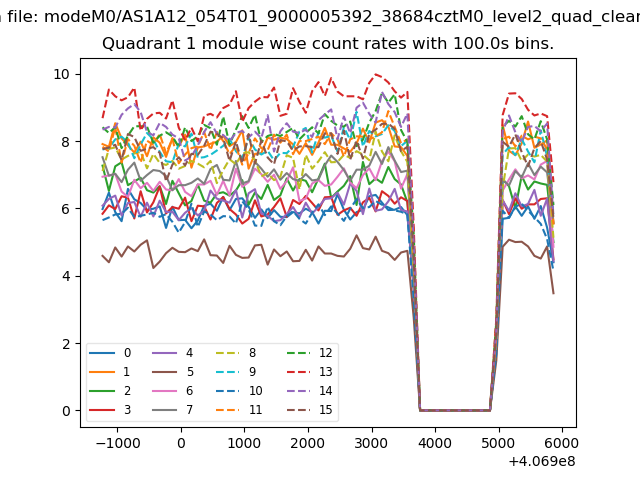
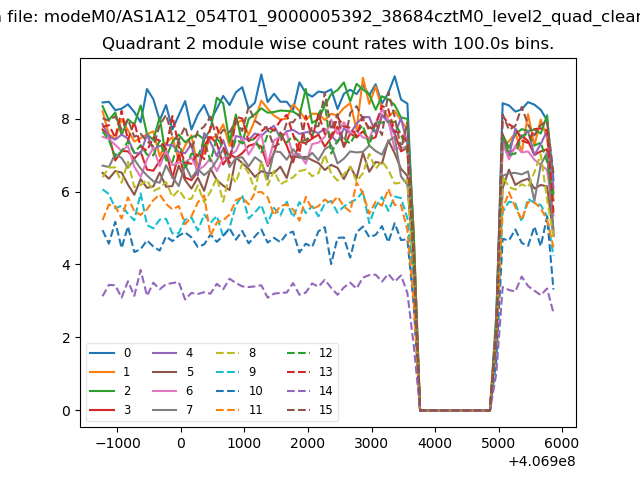
| Quadrant-wise count rates Data is divided into 100 sec bins |
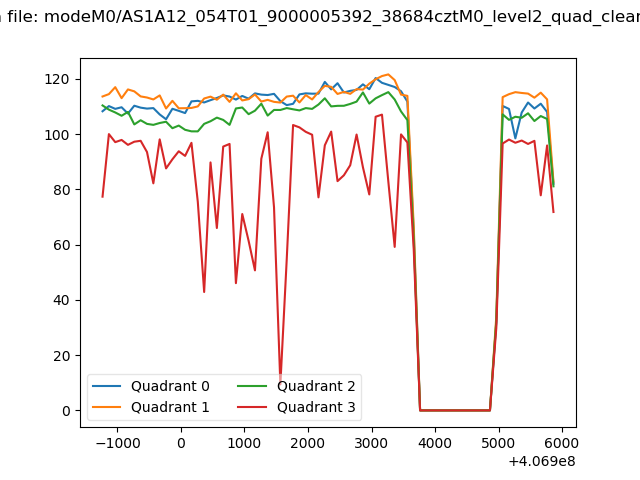 |
|
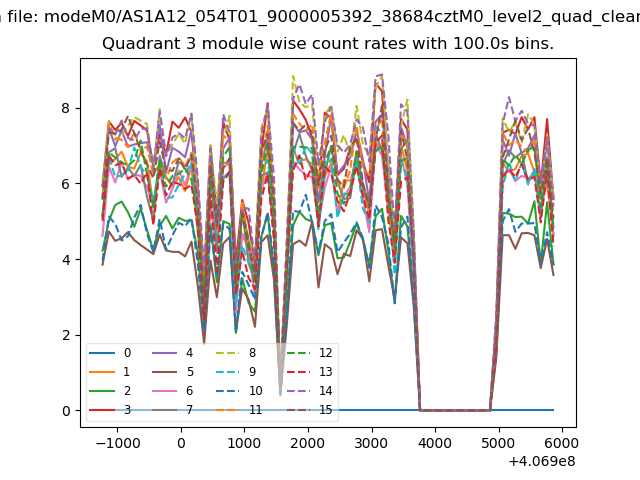
| Module-wise count rates for Quadrant A Data is divided into 100 sec bins |
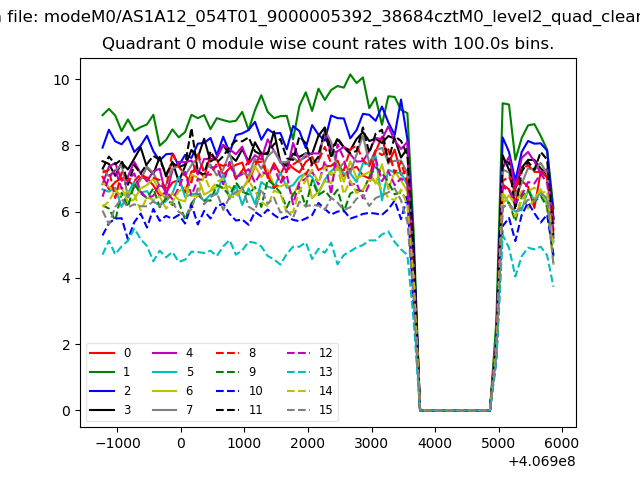 |
 |
| Module-wise count rates for Quadrant B Data is divided into 100 sec bins |
 |
 |
| Module-wise count rates for Quadrant C Data is divided into 100 sec bins |
 |
 |
| Module-wise count rates for Quadrant D Data is divided into 100 sec bins |
 |
 |
| Parameter | Plot |
|---|---|
| CZT HV Monitor | 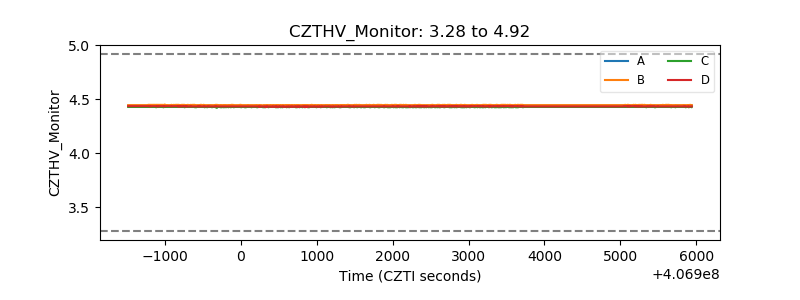 |
| D_VDD | 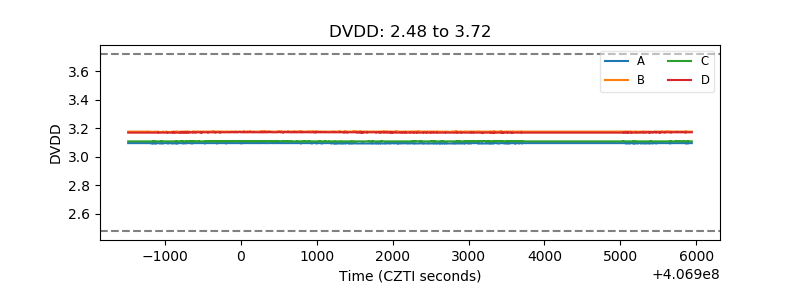 |
| Temperature 1 | 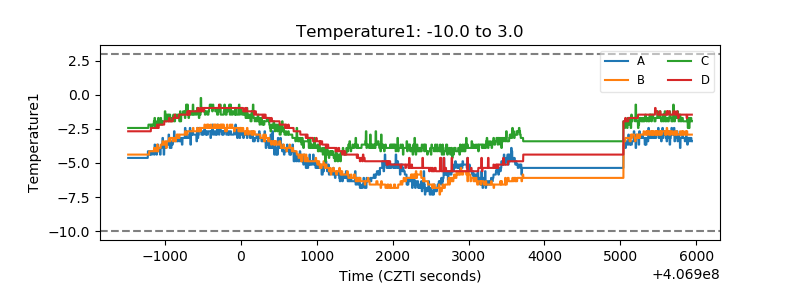 |
| Veto HV Monitor | 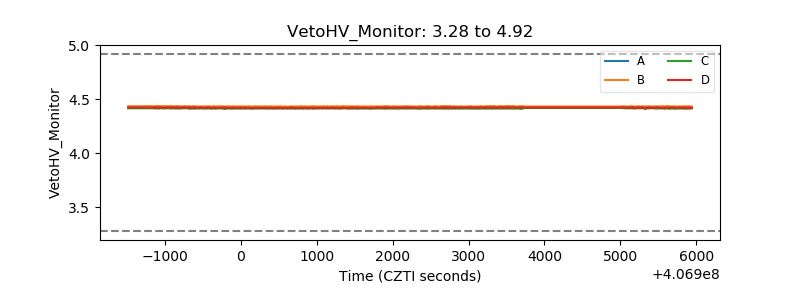 |
| Veto LLD | 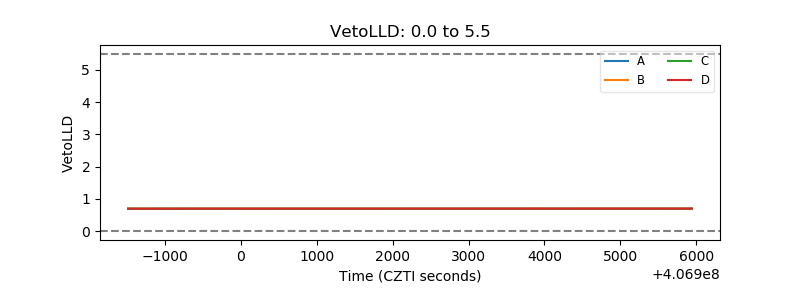 |
| Alpha Counter | 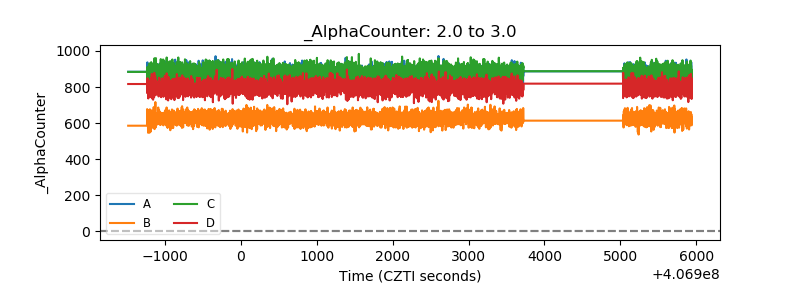 |
| _CPM_Rate | 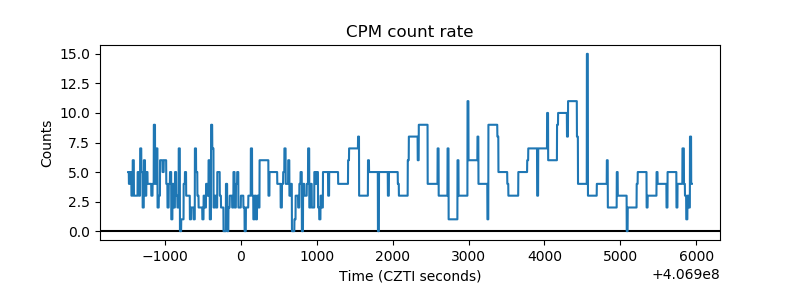 |
| CZT Counter | 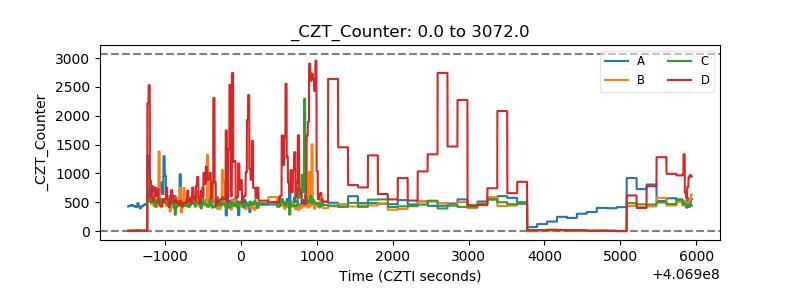 |
| +2.5 Volts monitor | 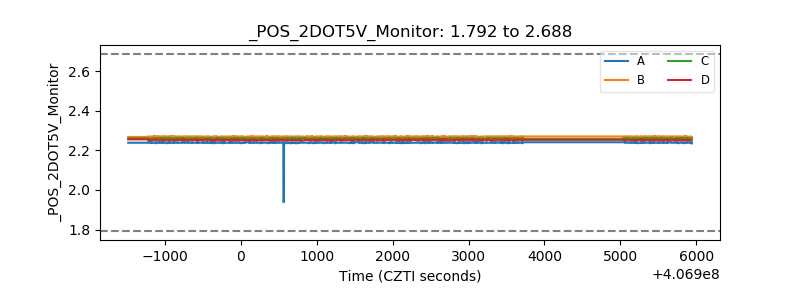 |
| +5 Volts monitor | 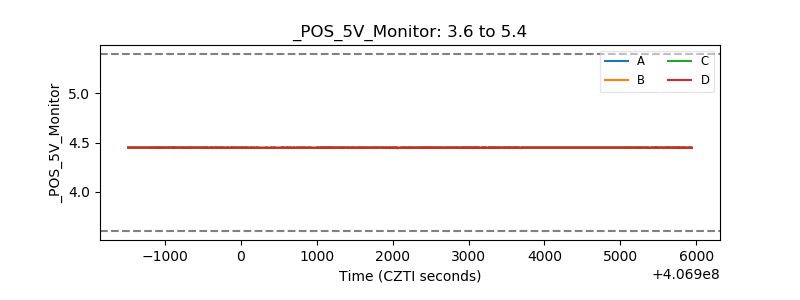 |
| _ROLL_ROT | 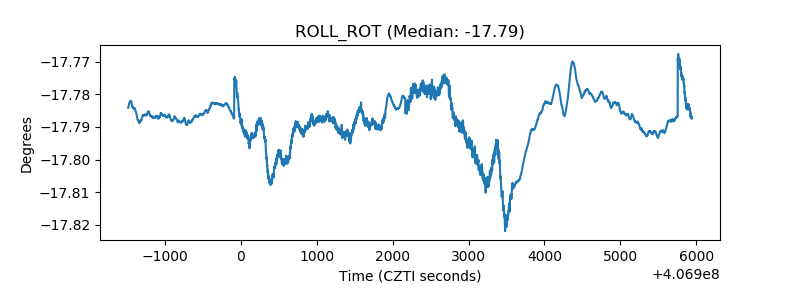 |
| _Roll_DEC | 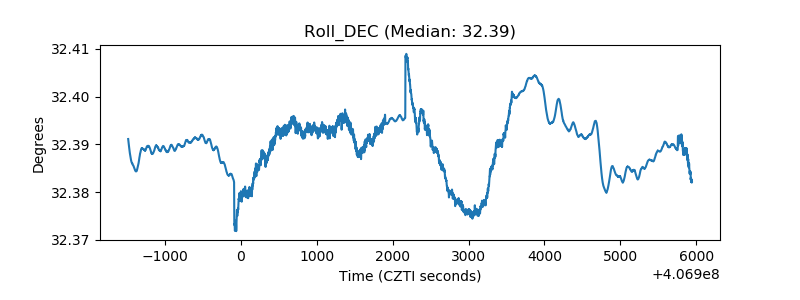 |
| _Roll_RA | 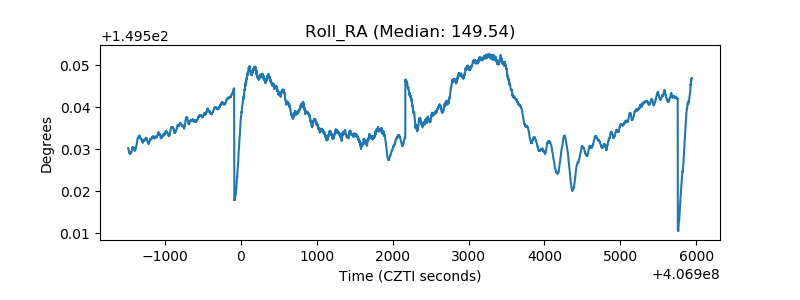 |
| Veto Counter | 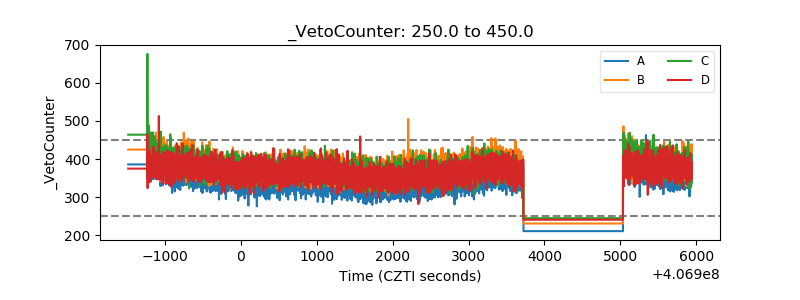 |