| Param | Original file | Final file |
|---|---|---|
| Filename | modeM0/AS1A12_054T01_9000005392_38687cztM0_level2.fits | modeM0/AS1A12_054T01_9000005392_38687cztM0_level2_quad_clean.evt |
| Size (bytes) | 1,142,568,000 | 226,932,480 |
| Size | 1.1 GB | 216.4 MB |
| Events in quadrant A | 8,434,722 | 1,553,998 |
| Events in quadrant B | 13,875,859 | 1,458,756 |
| Events in quadrant C | 7,386,286 | 1,524,086 |
| Events in quadrant D | 11,481,357 | 1,336,947 |
| Mode M9 | |||
|---|---|---|---|
| Quadrant | BADHDUFLAG | Total packets | Discarded packets |
| A | 0 | 32 | 0 |
| B | 0 | 32 | 0 |
| C | 0 | 32 | 0 |
| D | 0 | 33 | 0 |
| Mode SS | |||
|---|---|---|---|
| Quadrant | BADHDUFLAG | Total packets | Discarded packets |
| A | 0 | 294 | 0 |
| B | 0 | 294 | 0 |
| C | 0 | 294 | 0 |
| D | 0 | 294 | 0 |
| Mode M0 | |||
|---|---|---|---|
| Quadrant | BADHDUFLAG | Total packets | Discarded packets |
| A | 0 | 34117 | 4 |
| B | 0 | 51187 | 3 |
| C | 0 | 30954 | 3 |
| D | 0 | 44185 | 3 |
| Quadrant | Total seconds | Saturated seconds | Saturation percentage |
|---|---|---|---|
| A | 14434 | 444 | 3.076070% |
| B | 14434 | 1834 | 12.706111% |
| C | 14434 | 185 | 1.281696% |
| D | 14434 | 1082 | 7.496190% |
Noise dominated data is calculated using 1-second bins in cleaned event files. If a bin has >2000 counts, and if more than 50% of those come from <1% of pixels, then it is considered to be noise-dominated and hence unusable.
| Quadrant | # 1 sec bins | Bins with >0 counts | Bins with >2000 counts | High rate bins dominated by noise | Noise dominated (total time) | Noise dominated (detector-on time) | Marked lightcurve |
|---|---|---|---|---|---|---|---|
| A | 17059 | 14436 | 361 | 361 | 2.12% | 2.50% | 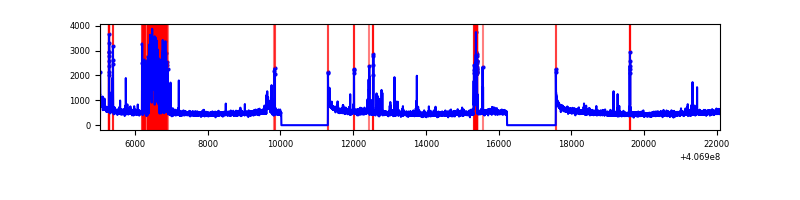 |
| B | 17059 | 14436 | 1211 | 1211 | 7.10% | 8.39% | 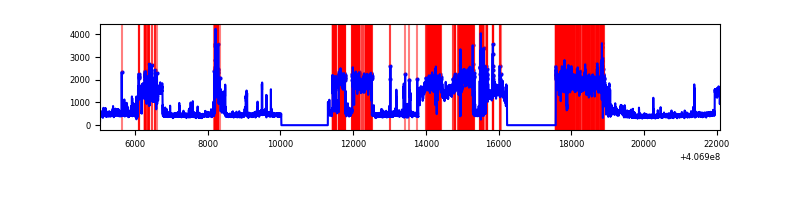 |
| C | 17059 | 14436 | 147 | 147 | 0.86% | 1.02% | 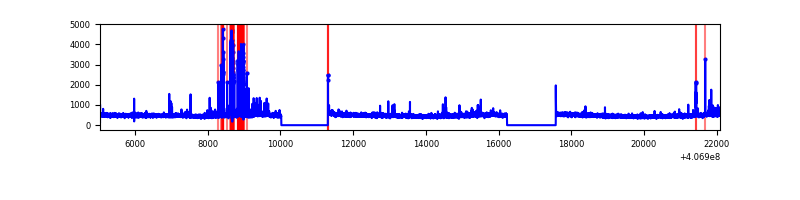 |
| D | 17059 | 14436 | 908 | 908 | 5.32% | 6.29% | 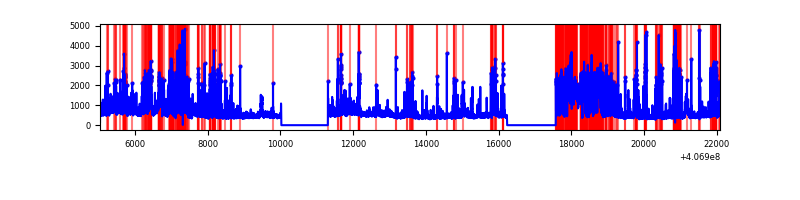 |
Top three noisy pixels from each quadrant. If the there are fewer than three noisy pixels in the level2.evt file, extra rows are filled as -1
| Pixel properties | Quadrant properties | ||||||
|---|---|---|---|---|---|---|---|
| Quadrant | DetID | PixID | Counts | Sigma | Mean | Median | Sigma |
| A | 13 | 248 | 1288516 | 4030.06 | 1594 | 1562 | 319.3 |
| A | 10 | 83 | 888186 | 2776.44 | 1594 | 1562 | 319.3 |
| A | 15 | 174 | 42213 | 127.3 | 1594 | 1562 | 319.3 |
| B | 4 | 251 | 6820259 | 22932.01 | 1558 | 1514 | 297.3 |
| B | 5 | 184 | 400586 | 1342.11 | 1558 | 1514 | 297.3 |
| B | 4 | 170 | 285911 | 956.45 | 1558 | 1514 | 297.3 |
| C | 14 | 254 | 673538 | 1852.78 | 1556 | 1566 | 362.7 |
| C | 15 | 214 | 566116 | 1556.6 | 1556 | 1566 | 362.7 |
| C | 0 | 10 | 29008 | 75.66 | 1556 | 1566 | 362.7 |
| D | 2 | 16 | 2090313 | 5584.41 | 1526 | 1487 | 374.0 |
| D | 12 | 227 | 1563500 | 4175.99 | 1526 | 1487 | 374.0 |
| D | 10 | 118 | 534828 | 1425.87 | 1526 | 1487 | 374.0 |
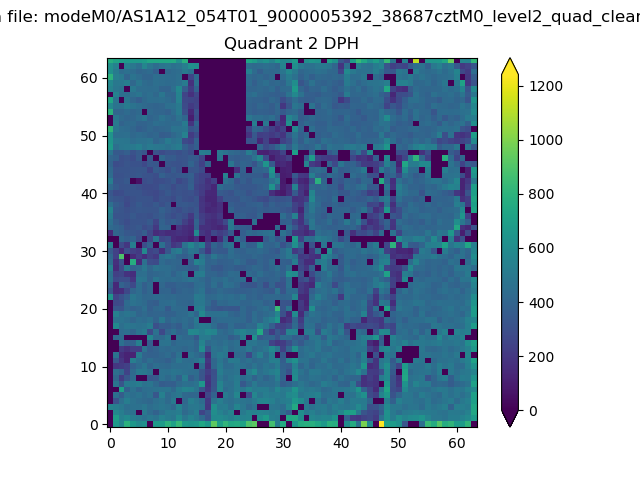
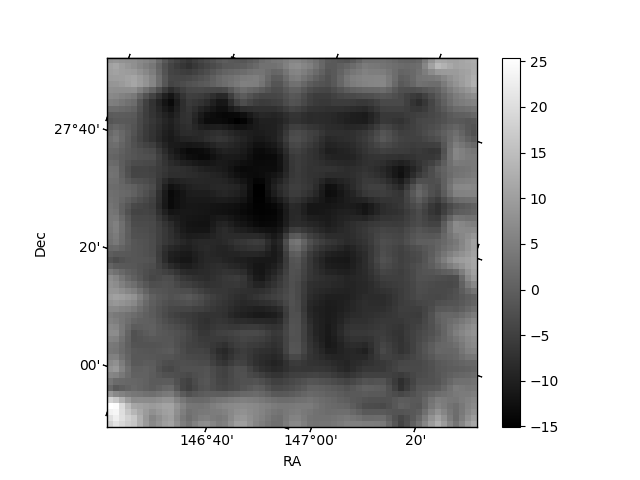
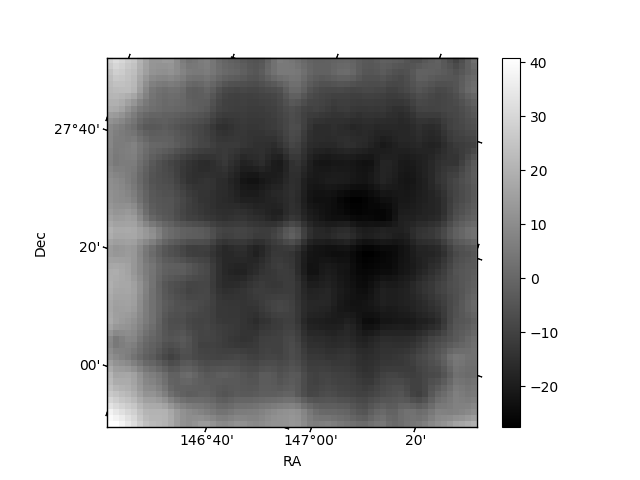
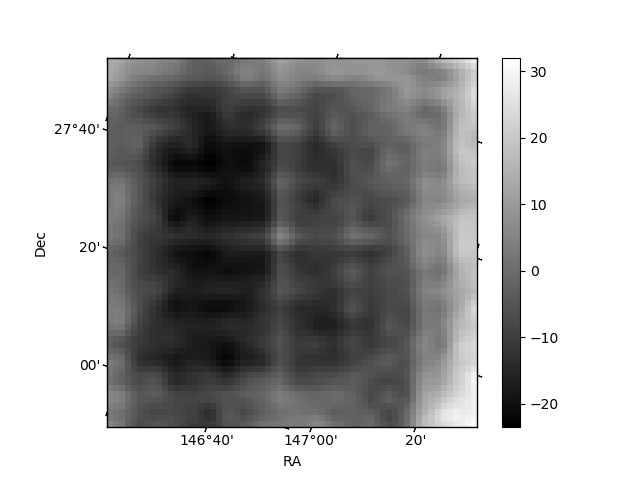
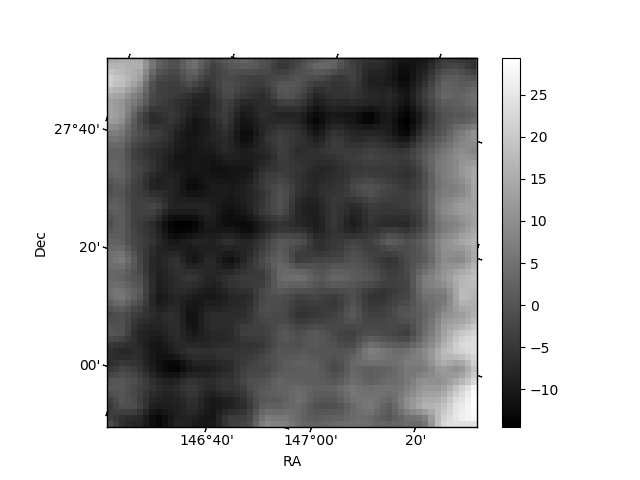
Histogram calculated using DETX and DETY for each event in the final _common_clean file
| Quadrant A | 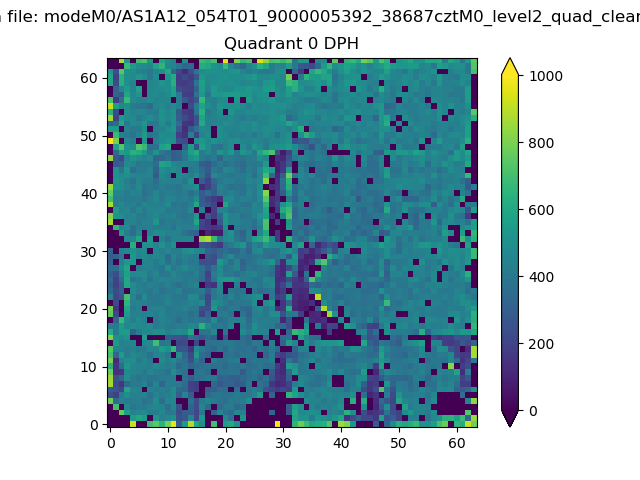 |
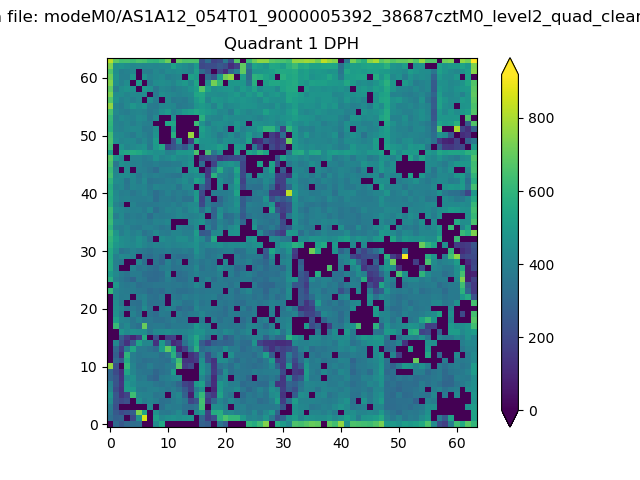 |
Quadrant B |
|---|---|---|---|
| Quadrant D | 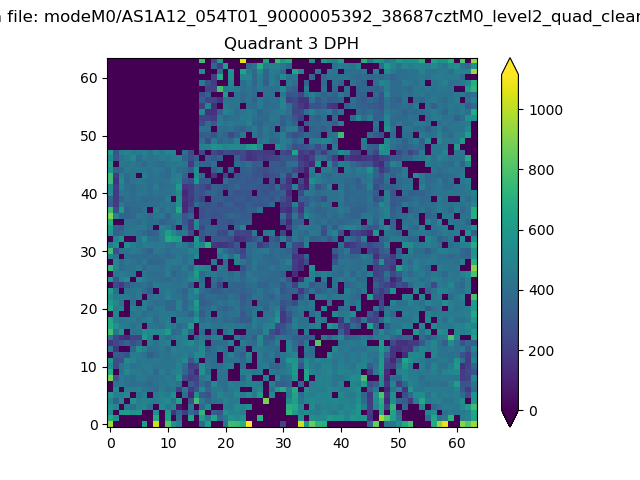 |
 |
Quadrant C |
| Plot type | Count rate plots | Images |
|---|---|---|
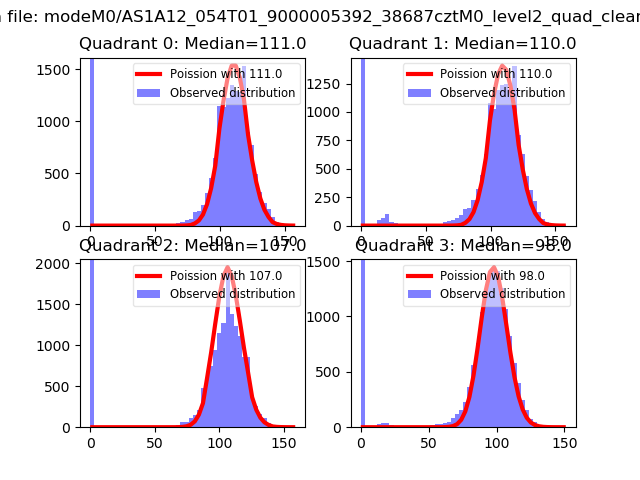
| Comparison with Poisson distribution Blue bars denote a histogram of data divided into 1 sec bins. Red curve is a Poisson curve with rate = median count rate of data. |
 |
 |
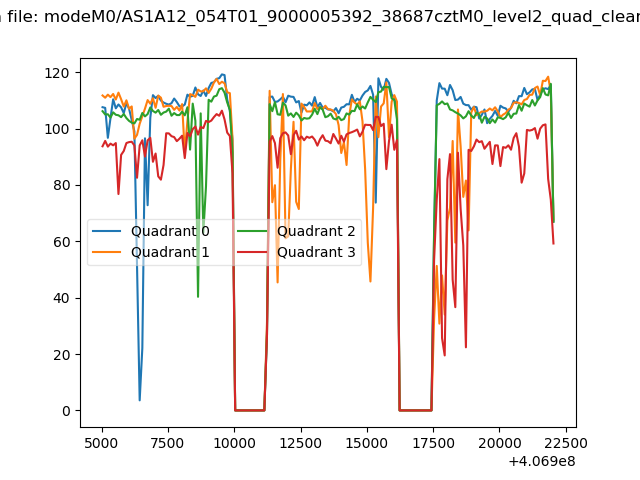
| Quadrant-wise count rates Data is divided into 100 sec bins |
 |
|
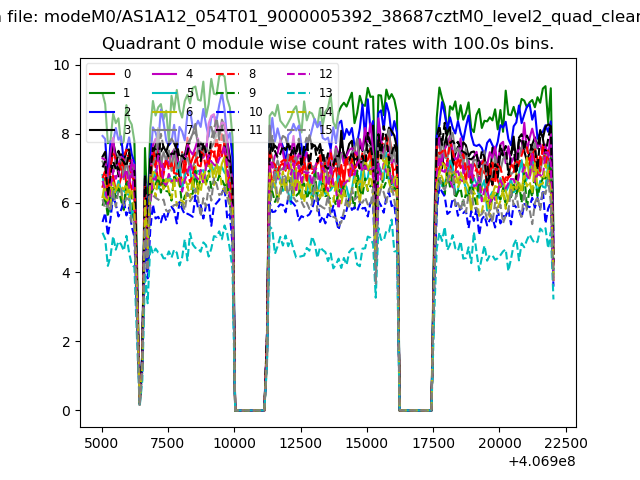
| Module-wise count rates for Quadrant A Data is divided into 100 sec bins |
 |
 |
| Module-wise count rates for Quadrant B Data is divided into 100 sec bins |
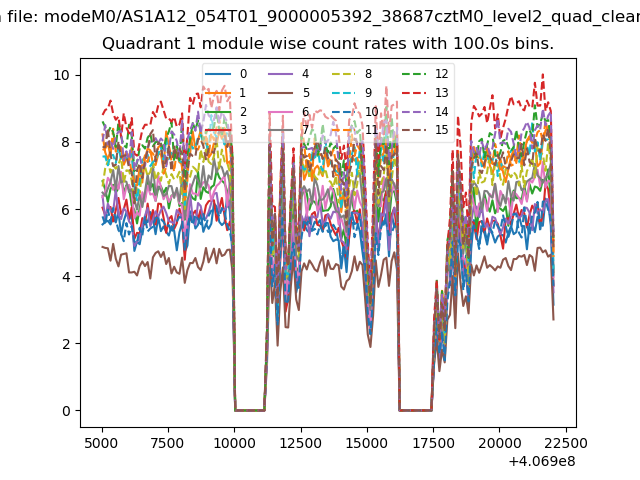 |
 |
| Module-wise count rates for Quadrant C Data is divided into 100 sec bins |
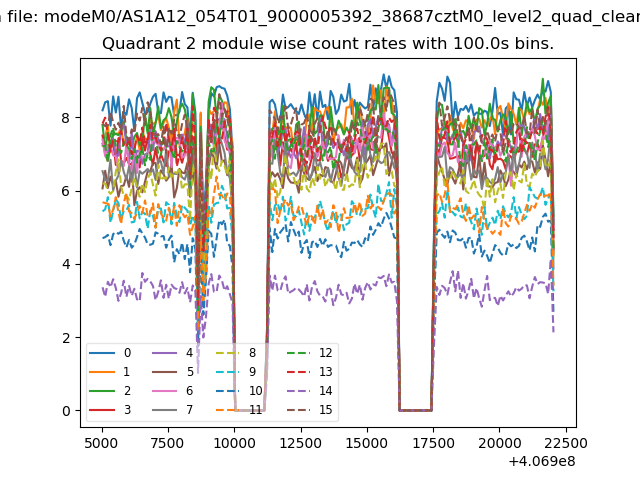 |
 |
| Module-wise count rates for Quadrant D Data is divided into 100 sec bins |
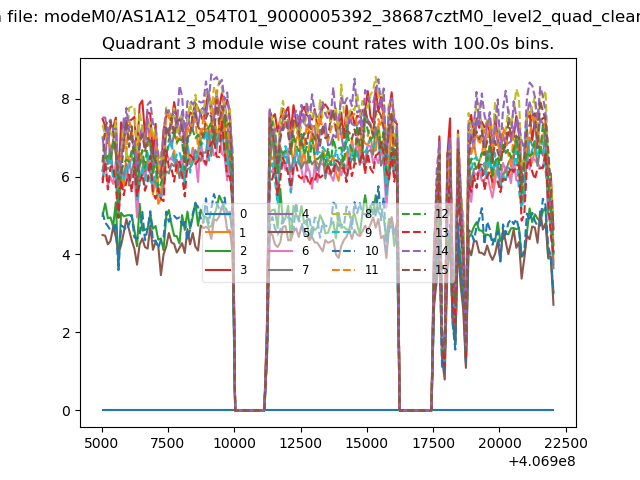 |
 |
| Parameter | Plot |
|---|---|
| CZT HV Monitor | 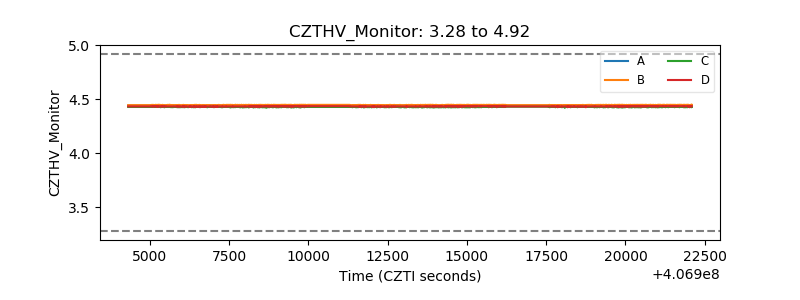 |
| D_VDD | 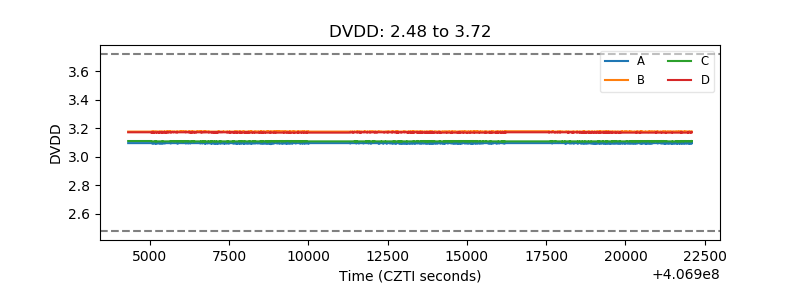 |
| Temperature 1 | 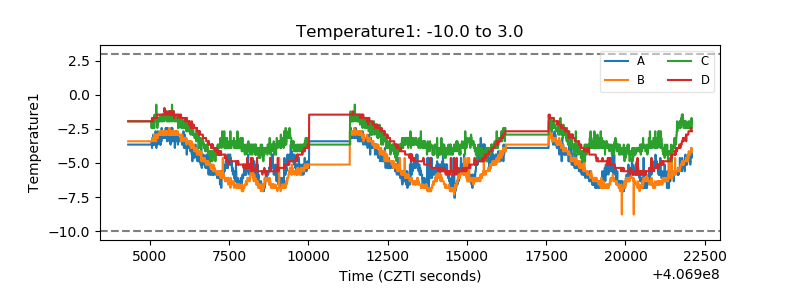 |
| Veto HV Monitor | 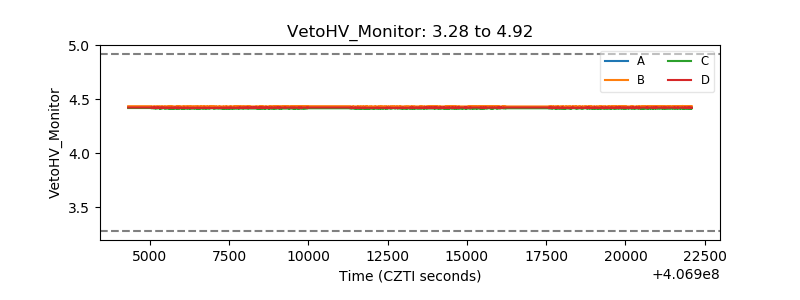 |
| Veto LLD | 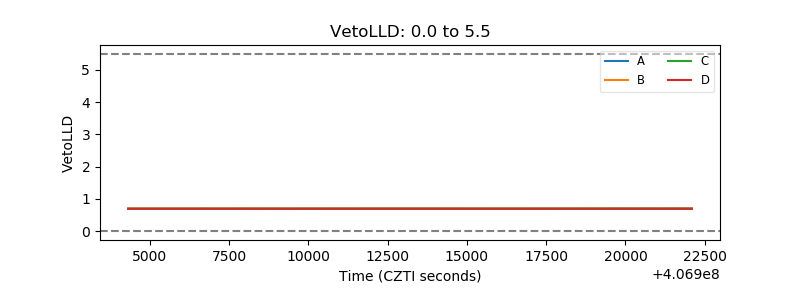 |
| Alpha Counter | 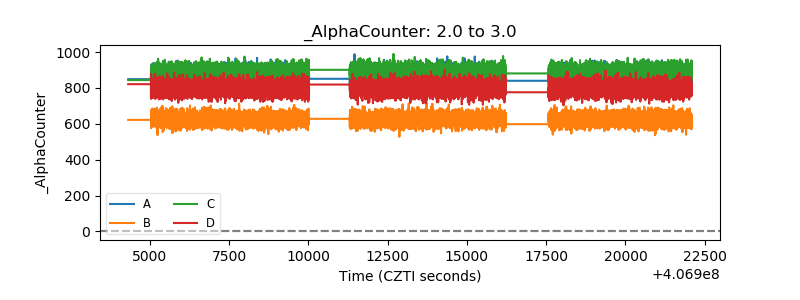 |
| _CPM_Rate | 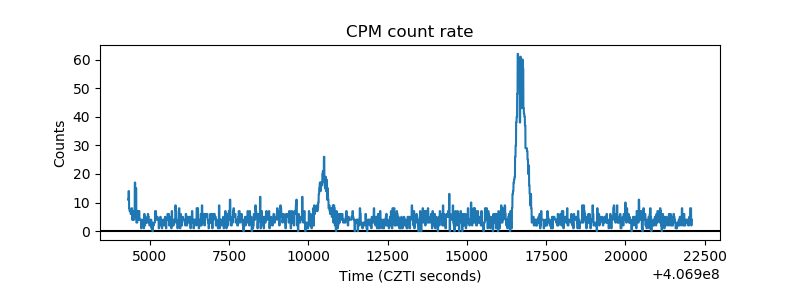 |
| CZT Counter | 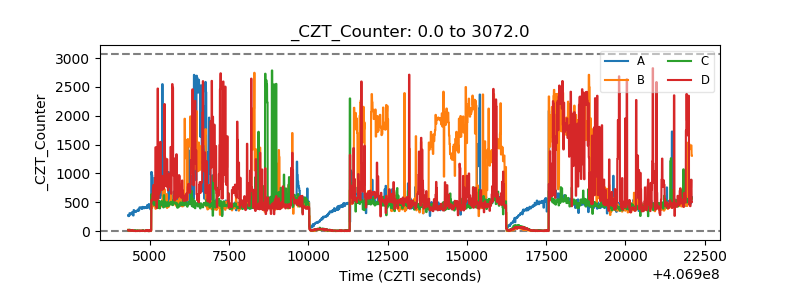 |
| +2.5 Volts monitor |  |
| +5 Volts monitor | 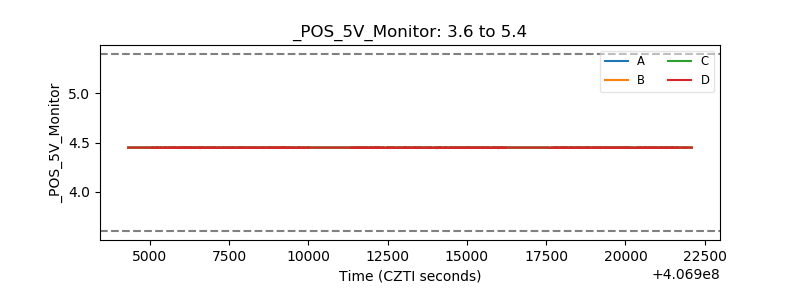 |
| _ROLL_ROT | 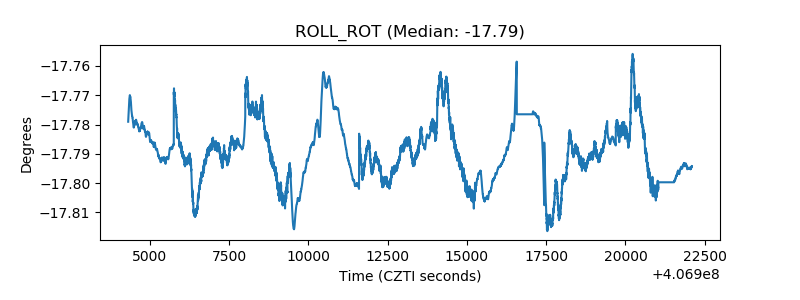 |
| _Roll_DEC | 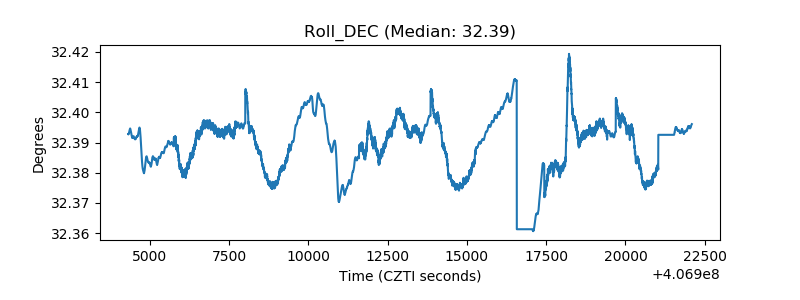 |
| _Roll_RA | 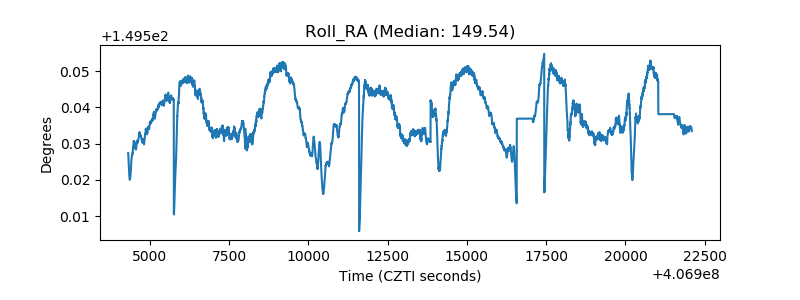 |
| Veto Counter | 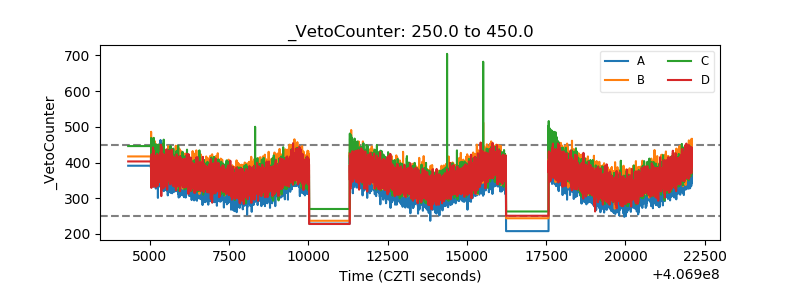 |