| Param | Original file | Final file |
|---|---|---|
| Filename | modeM0/AS1A12_054T01_9000005392_38688cztM0_level2.fits | modeM0/AS1A12_054T01_9000005392_38688cztM0_level2_quad_clean.evt |
| Size (bytes) | 656,202,240 | 102,839,040 |
| Size | 625.8 MB | 98.1 MB |
| Events in quadrant A | 3,621,706 | 737,438 |
| Events in quadrant B | 6,519,417 | 731,356 |
| Events in quadrant C | 3,419,689 | 711,172 |
| Events in quadrant D | 10,227,396 | 481,223 |
| Mode M9 | |||
|---|---|---|---|
| Quadrant | BADHDUFLAG | Total packets | Discarded packets |
| A | 0 | 30 | 0 |
| B | 0 | 30 | 0 |
| C | 0 | 30 | 0 |
| D | 0 | 30 | 0 |
| Mode SS | |||
|---|---|---|---|
| Quadrant | BADHDUFLAG | Total packets | Discarded packets |
| A | 0 | 132 | 0 |
| B | 0 | 132 | 0 |
| C | 0 | 132 | 0 |
| D | 0 | 132 | 0 |
| Mode M0 | |||
|---|---|---|---|
| Quadrant | BADHDUFLAG | Total packets | Discarded packets |
| A | 0 | 14797 | 3 |
| B | 0 | 23792 | 2 |
| C | 0 | 14142 | 2 |
| D | 0 | 34828 | 2 |
| Quadrant | Total seconds | Saturated seconds | Saturation percentage |
|---|---|---|---|
| A | 6492 | 42 | 0.646950% |
| B | 6492 | 323 | 4.975354% |
| C | 6492 | 35 | 0.539125% |
| D | 6492 | 2141 | 32.979051% |
Noise dominated data is calculated using 1-second bins in cleaned event files. If a bin has >2000 counts, and if more than 50% of those come from <1% of pixels, then it is considered to be noise-dominated and hence unusable.
| Quadrant | # 1 sec bins | Bins with >0 counts | Bins with >2000 counts | High rate bins dominated by noise | Noise dominated (total time) | Noise dominated (detector-on time) | Marked lightcurve |
|---|---|---|---|---|---|---|---|
| A | 9477 | 6494 | 28 | 28 | 0.30% | 0.43% | 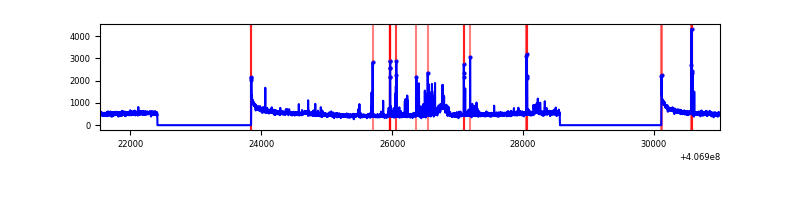 |
| B | 9477 | 6493 | 51 | 51 | 0.54% | 0.79% | 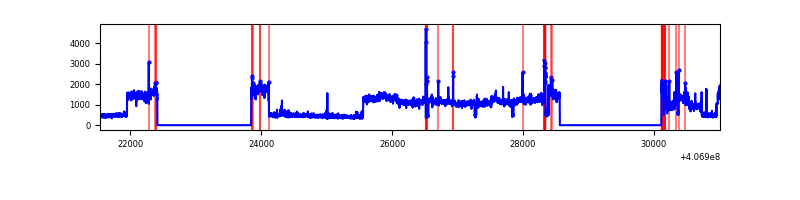 |
| C | 9477 | 6493 | 25 | 25 | 0.26% | 0.39% | 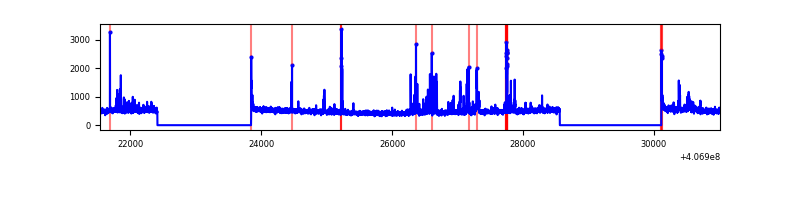 |
| D | 9477 | 6493 | 1971 | 1971 | 20.80% | 30.36% | 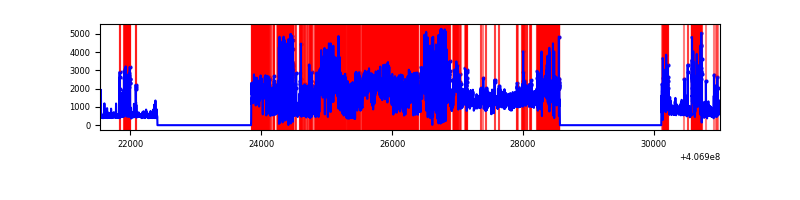 |
Top three noisy pixels from each quadrant. If the there are fewer than three noisy pixels in the level2.evt file, extra rows are filled as -1
| Pixel properties | Quadrant properties | ||||||
|---|---|---|---|---|---|---|---|
| Quadrant | DetID | PixID | Counts | Sigma | Mean | Median | Sigma |
| A | 10 | 83 | 434342 | 2861.78 | 743 | 726 | 151.5 |
| A | 13 | 248 | 213986 | 1407.47 | 743 | 726 | 151.5 |
| A | 15 | 174 | 59580 | 388.42 | 743 | 726 | 151.5 |
| B | 4 | 251 | 3518249 | 25004.62 | 726 | 707 | 140.7 |
| B | 4 | 171 | 80202 | 565.09 | 726 | 707 | 140.7 |
| B | 5 | 184 | 21956 | 151.05 | 726 | 707 | 140.7 |
| C | 14 | 254 | 264827 | 1553.51 | 721 | 724 | 170.0 |
| C | 15 | 214 | 263641 | 1546.53 | 721 | 724 | 170.0 |
| C | 15 | 208 | 40693 | 235.11 | 721 | 724 | 170.0 |
| D | 2 | 16 | 2918696 | 19207.58 | 616 | 597 | 151.9 |
| D | 5 | 222 | 2330105 | 15333.35 | 616 | 597 | 151.9 |
| D | 12 | 227 | 1894175 | 12463.96 | 616 | 597 | 151.9 |
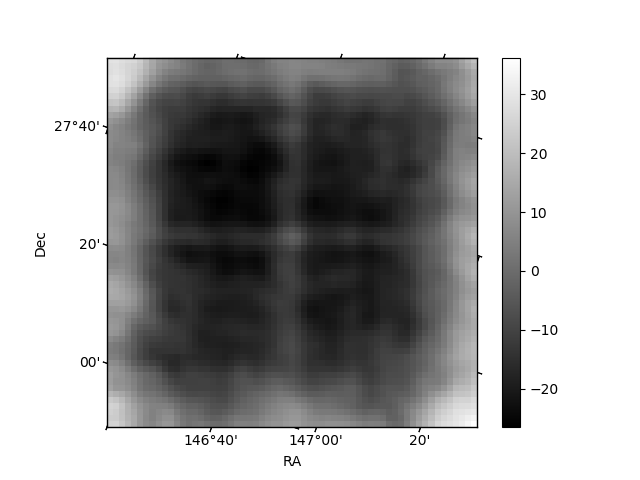
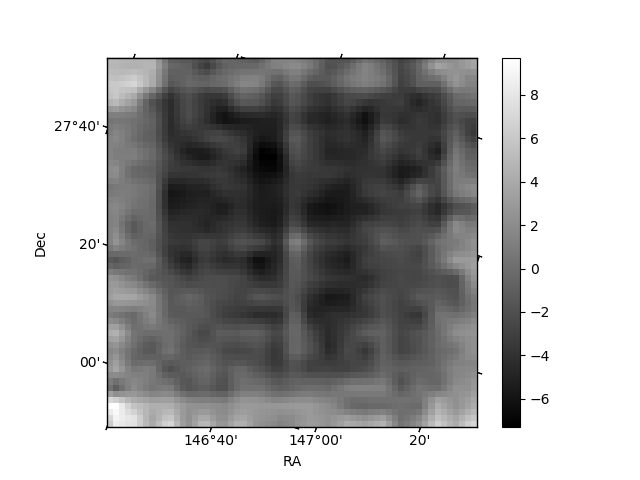
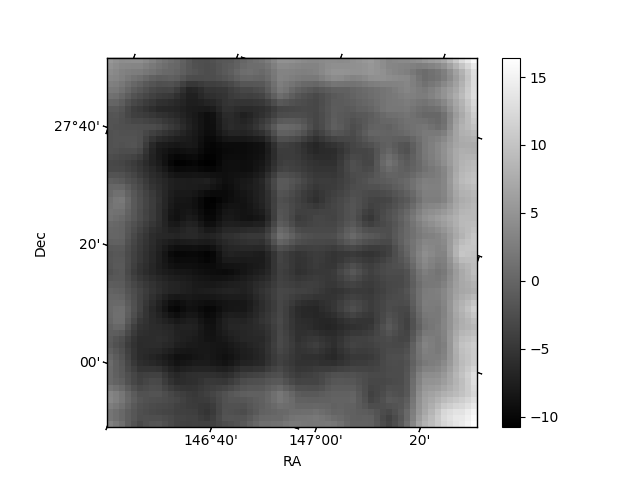
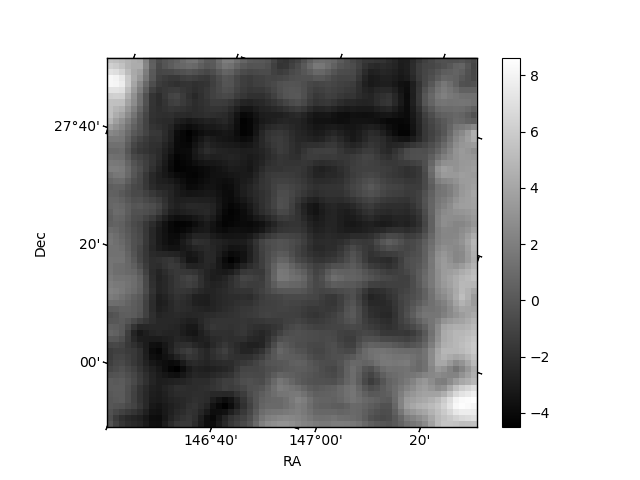
Histogram calculated using DETX and DETY for each event in the final _common_clean file
| Quadrant A | 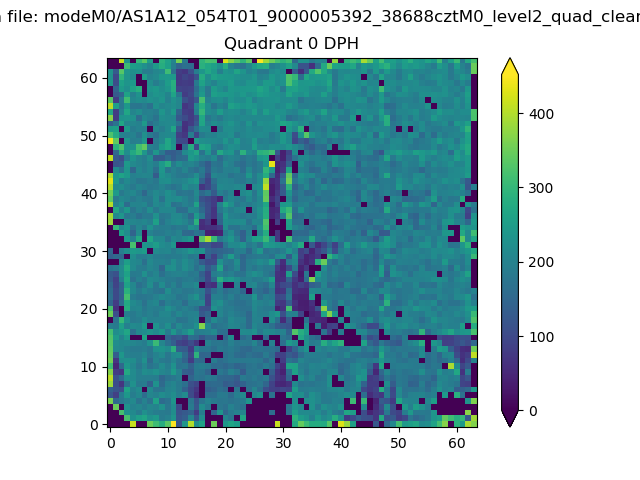 |
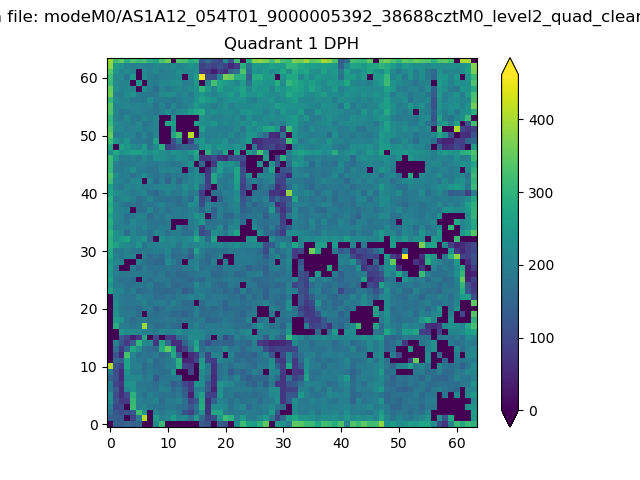 |
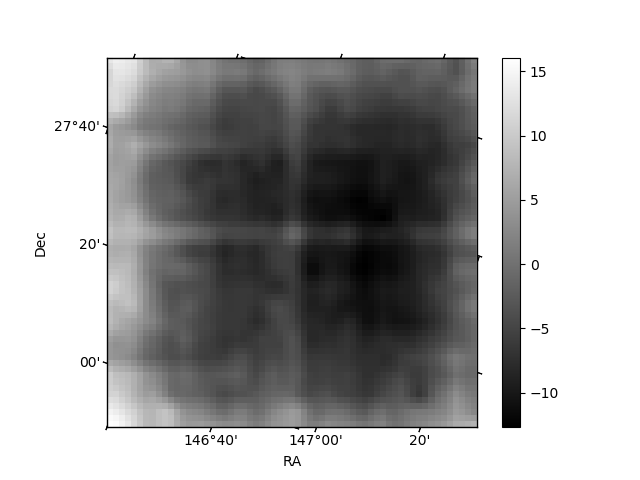
Quadrant B |
|---|---|---|---|
| Quadrant D | 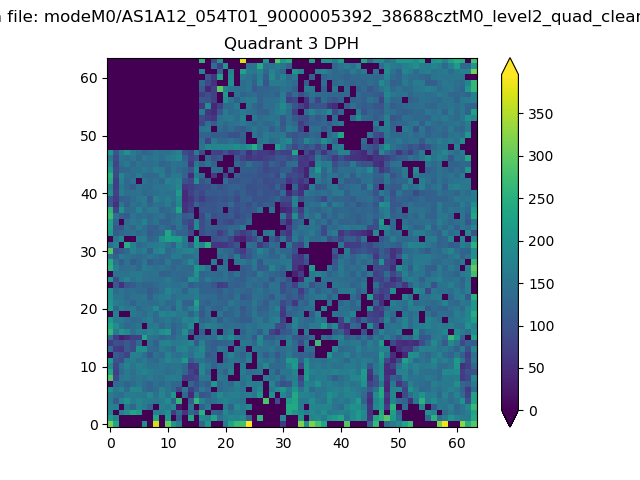 |
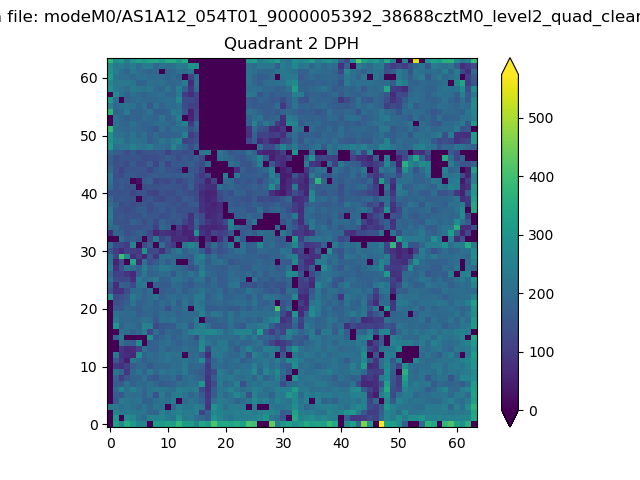 |
Quadrant C |
| Plot type | Count rate plots | Images |
|---|---|---|
| Comparison with Poisson distribution Blue bars denote a histogram of data divided into 1 sec bins. Red curve is a Poisson curve with rate = median count rate of data. |
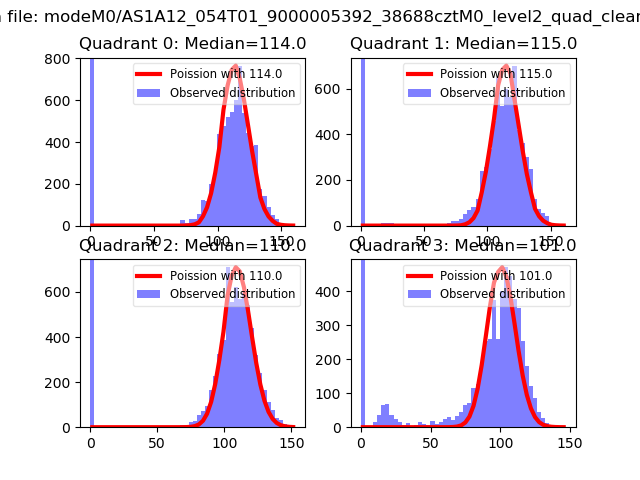 |
 |
| Quadrant-wise count rates Data is divided into 100 sec bins |
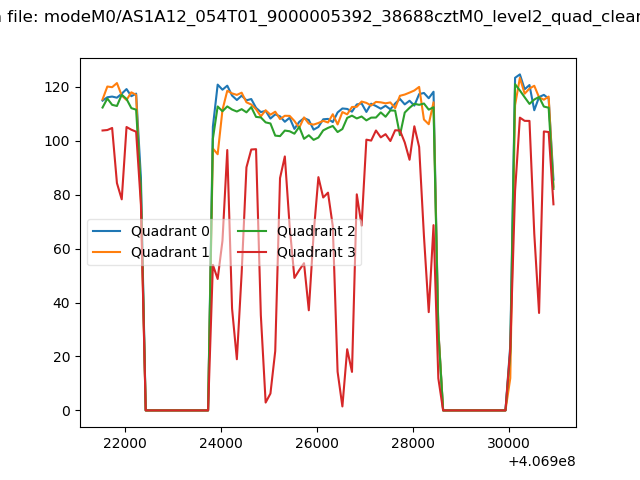 |
|
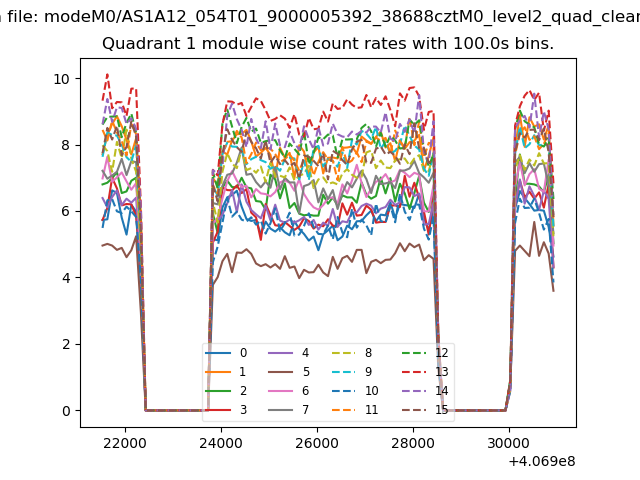
| Module-wise count rates for Quadrant A Data is divided into 100 sec bins |
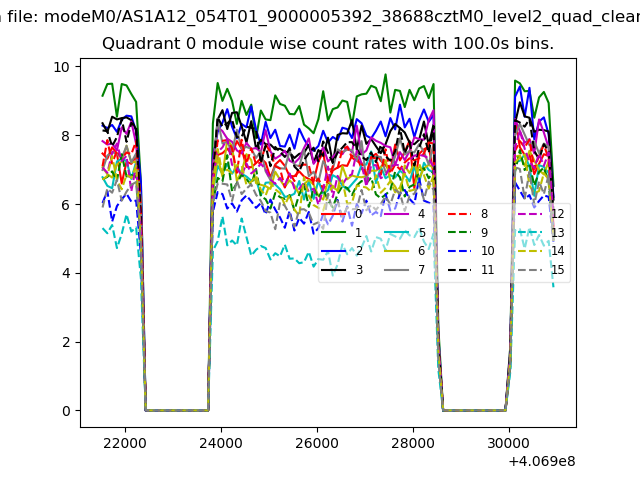 |
 |
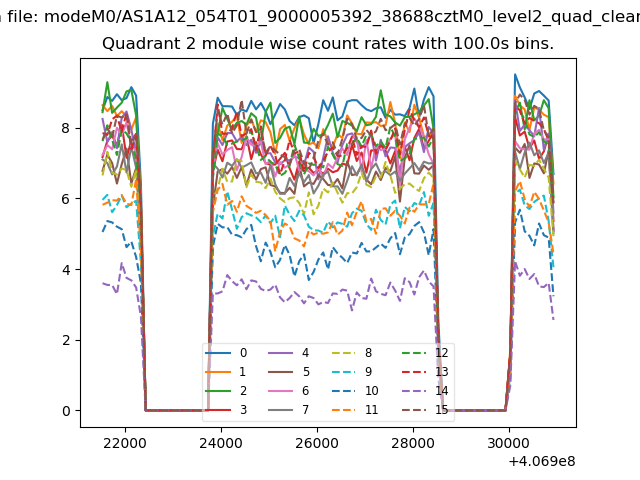
| Module-wise count rates for Quadrant B Data is divided into 100 sec bins |
 |
 |
| Module-wise count rates for Quadrant C Data is divided into 100 sec bins |
 |
 |
| Module-wise count rates for Quadrant D Data is divided into 100 sec bins |
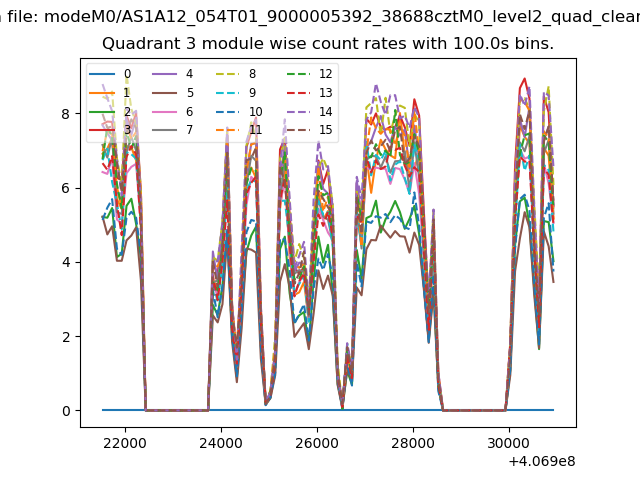 |
 |
| Parameter | Plot |
|---|---|
| CZT HV Monitor | 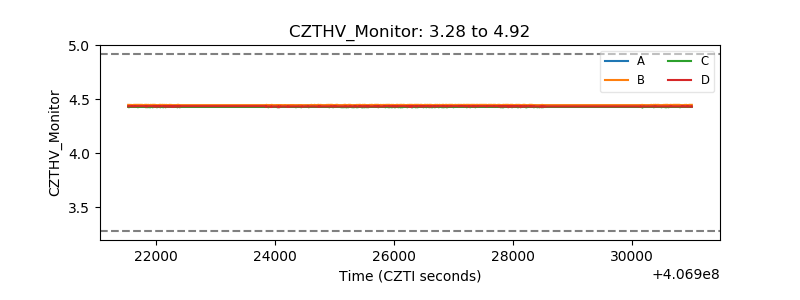 |
| D_VDD | 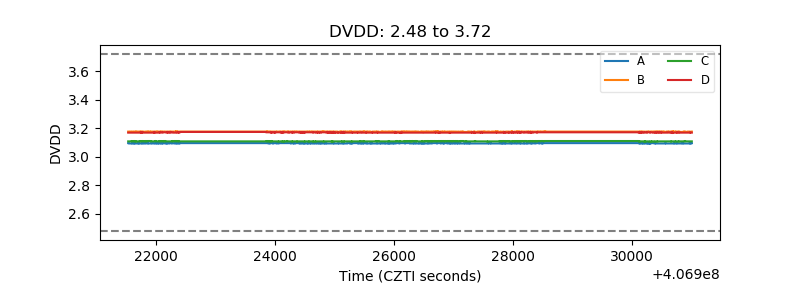 |
| Temperature 1 | 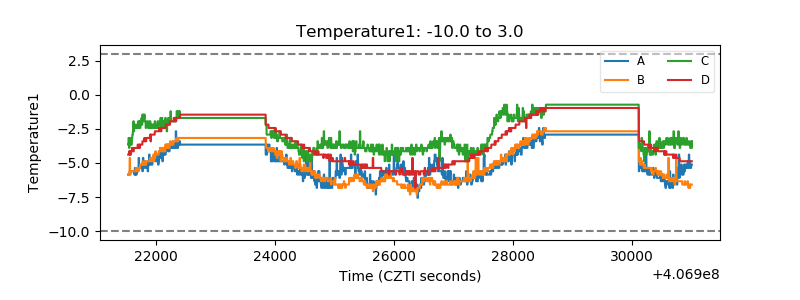 |
| Veto HV Monitor | 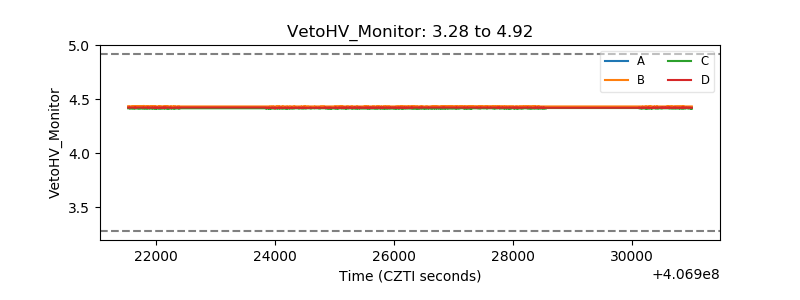 |
| Veto LLD | 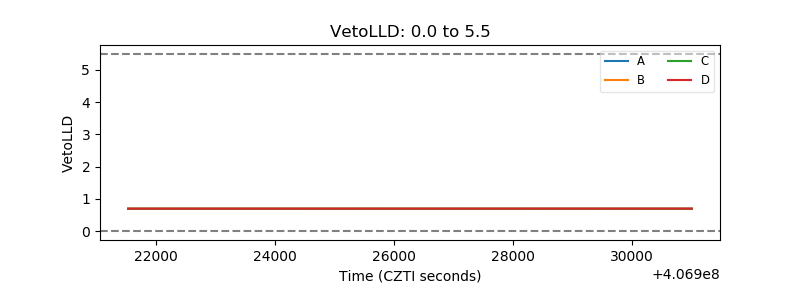 |
| Alpha Counter | 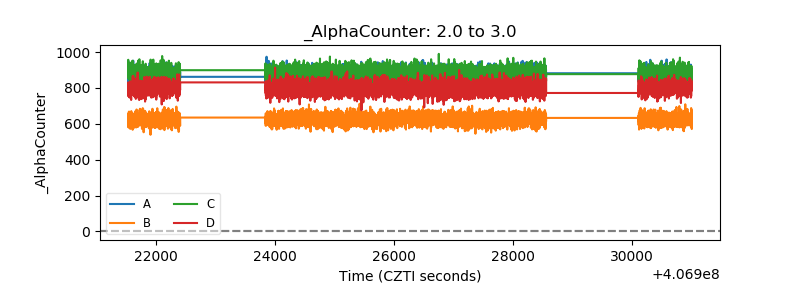 |
| _CPM_Rate | 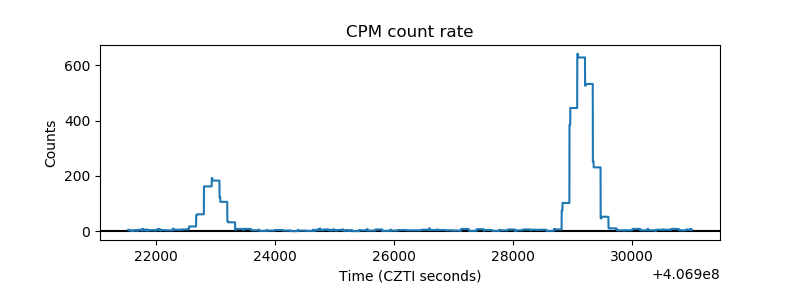 |
| CZT Counter | 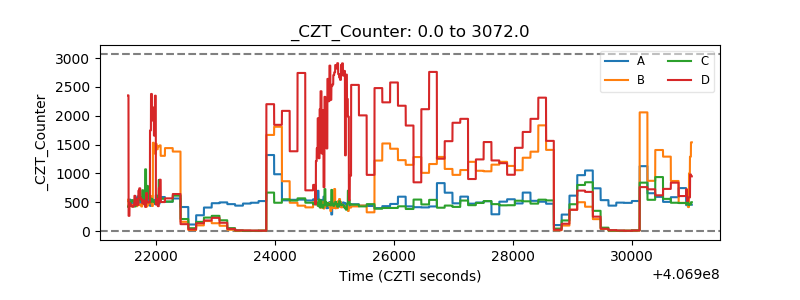 |
| +2.5 Volts monitor | 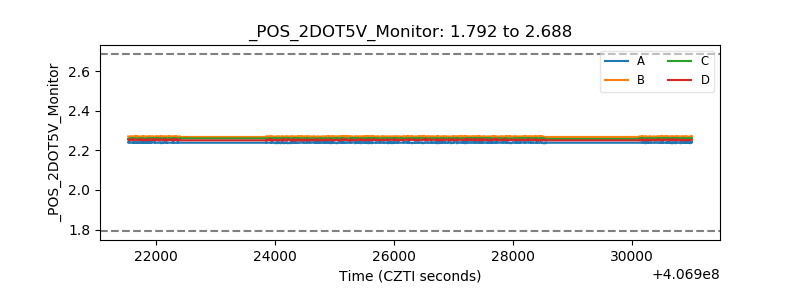 |
| +5 Volts monitor |  |
| _ROLL_ROT | 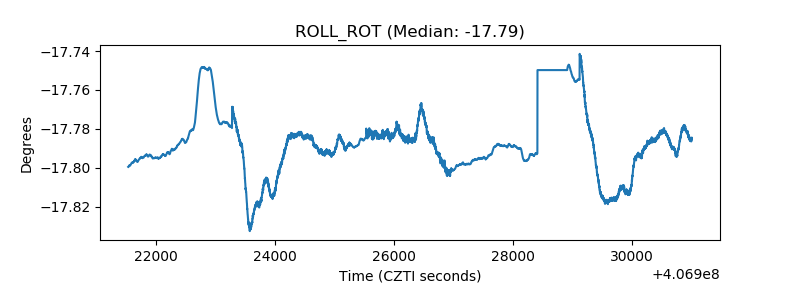 |
| _Roll_DEC | 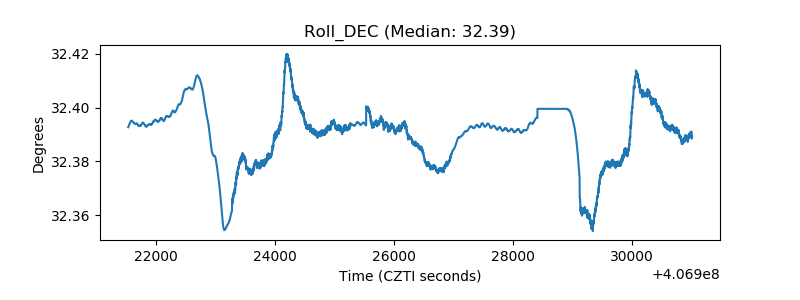 |
| _Roll_RA | 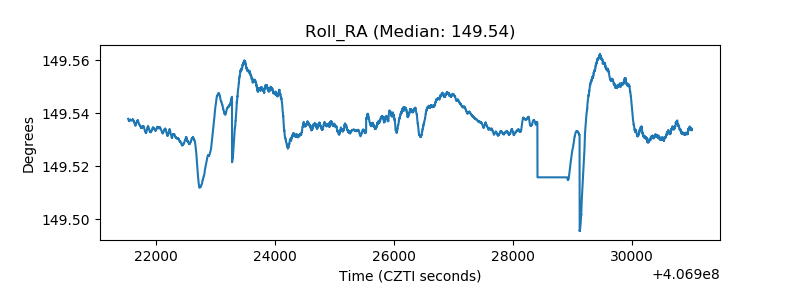 |
| Veto Counter | 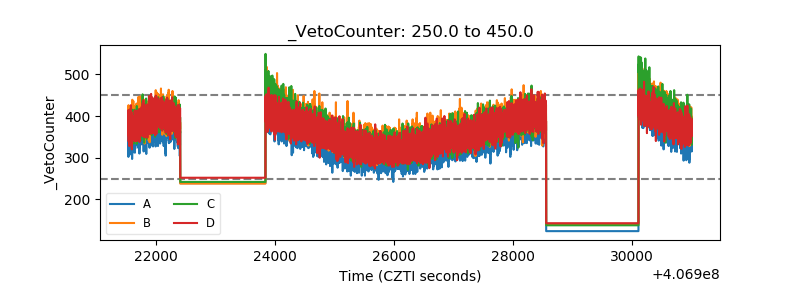 |