| Param | Original file | Final file |
|---|---|---|
| Filename | modeM0/AS1A12_054T01_9000005392_38689cztM0_level2.fits | modeM0/AS1A12_054T01_9000005392_38689cztM0_level2_quad_clean.evt |
| Size (bytes) | 388,488,960 | 91,209,600 |
| Size | 370.5 MB | 87.0 MB |
| Events in quadrant A | 2,812,114 | 625,786 |
| Events in quadrant B | 3,468,645 | 632,192 |
| Events in quadrant C | 3,033,506 | 607,087 |
| Events in quadrant D | 4,641,641 | 514,400 |
| Mode M9 | |||
|---|---|---|---|
| Quadrant | BADHDUFLAG | Total packets | Discarded packets |
| A | 0 | 28 | 0 |
| B | 0 | 28 | 0 |
| C | 0 | 28 | 0 |
| D | 0 | 29 | 0 |
| Mode SS | |||
|---|---|---|---|
| Quadrant | BADHDUFLAG | Total packets | Discarded packets |
| A | 0 | 112 | 0 |
| B | 0 | 112 | 0 |
| C | 0 | 112 | 0 |
| D | 0 | 112 | 0 |
| Mode M0 | |||
|---|---|---|---|
| Quadrant | BADHDUFLAG | Total packets | Discarded packets |
| A | 0 | 11786 | 3 |
| B | 0 | 13961 | 2 |
| C | 0 | 12442 | 2 |
| D | 0 | 17659 | 2 |
| Quadrant | Total seconds | Saturated seconds | Saturation percentage |
|---|---|---|---|
| A | 5457 | 21 | 0.384827% |
| B | 5457 | 125 | 2.290636% |
| C | 5457 | 48 | 0.879604% |
| D | 5457 | 583 | 10.683526% |
Noise dominated data is calculated using 1-second bins in cleaned event files. If a bin has >2000 counts, and if more than 50% of those come from <1% of pixels, then it is considered to be noise-dominated and hence unusable.
| Quadrant | # 1 sec bins | Bins with >0 counts | Bins with >2000 counts | High rate bins dominated by noise | Noise dominated (total time) | Noise dominated (detector-on time) | Marked lightcurve |
|---|---|---|---|---|---|---|---|
| A | 7158 | 5458 | 9 | 9 | 0.13% | 0.16% | 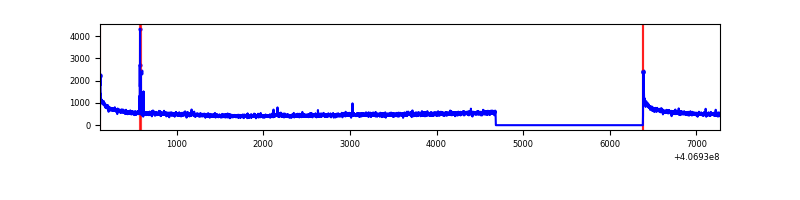 |
| B | 7157 | 5457 | 57 | 57 | 0.80% | 1.04% | 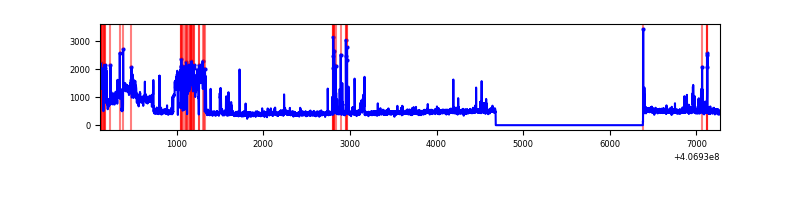 |
| C | 7157 | 5457 | 50 | 50 | 0.70% | 0.92% | 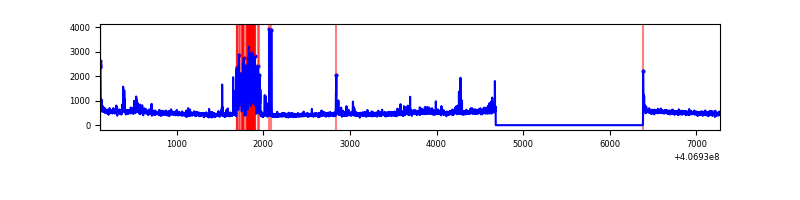 |
| D | 7157 | 5457 | 449 | 449 | 6.27% | 8.23% | 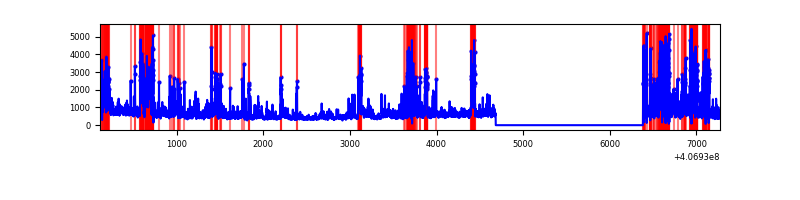 |
Top three noisy pixels from each quadrant. If the there are fewer than three noisy pixels in the level2.evt file, extra rows are filled as -1
| Pixel properties | Quadrant properties | ||||||
|---|---|---|---|---|---|---|---|
| Quadrant | DetID | PixID | Counts | Sigma | Mean | Median | Sigma |
| A | 10 | 83 | 392694 | 3170.15 | 612 | 602 | 123.7 |
| A | 4 | 0 | 23649 | 186.34 | 612 | 602 | 123.7 |
| A | 15 | 174 | 11896 | 91.31 | 612 | 602 | 123.7 |
| B | 4 | 251 | 822199 | 6950.23 | 607 | 591 | 118.2 |
| B | 5 | 184 | 124501 | 1048.19 | 607 | 591 | 118.2 |
| B | 4 | 171 | 82264 | 690.9 | 607 | 591 | 118.2 |
| C | 14 | 254 | 396101 | 2834.95 | 597 | 600 | 139.5 |
| C | 15 | 214 | 223269 | 1596.09 | 597 | 600 | 139.5 |
| C | 15 | 208 | 36095 | 254.43 | 597 | 600 | 139.5 |
| D | 2 | 16 | 869376 | 6345.43 | 560 | 546 | 136.9 |
| D | 12 | 227 | 540535 | 3943.76 | 560 | 546 | 136.9 |
| D | 1 | 47 | 316327 | 2306.28 | 560 | 546 | 136.9 |
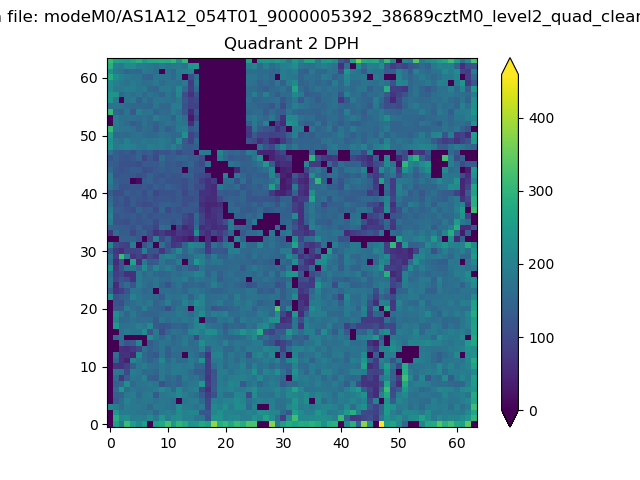
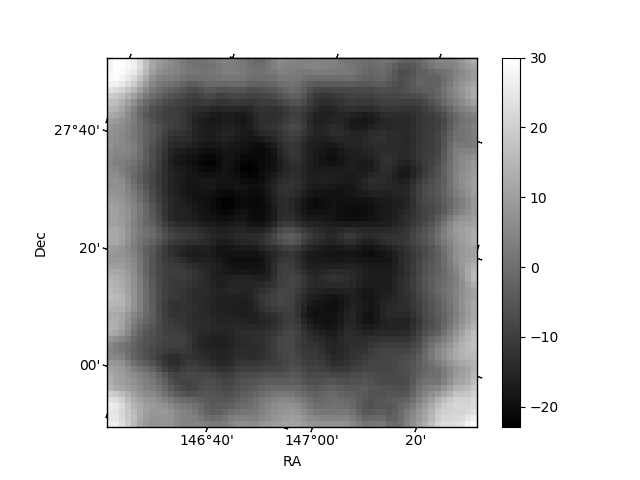
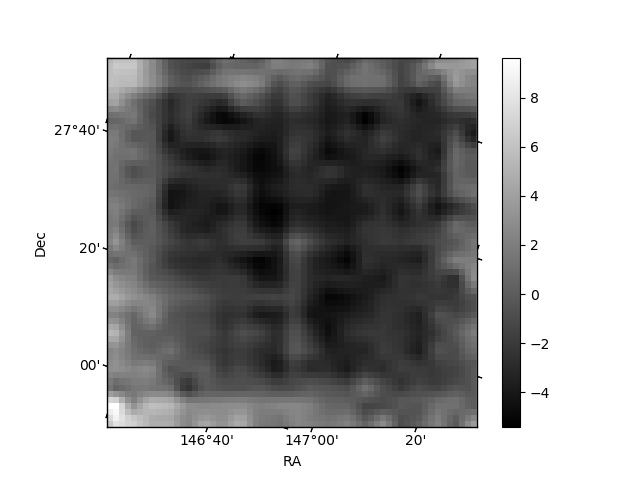
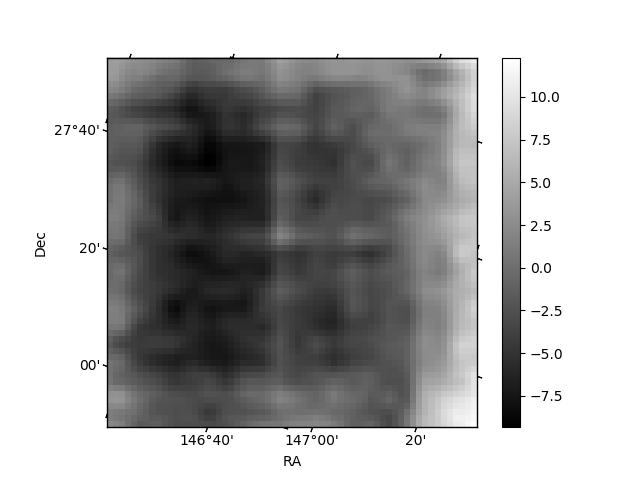
Histogram calculated using DETX and DETY for each event in the final _common_clean file
| Quadrant A | 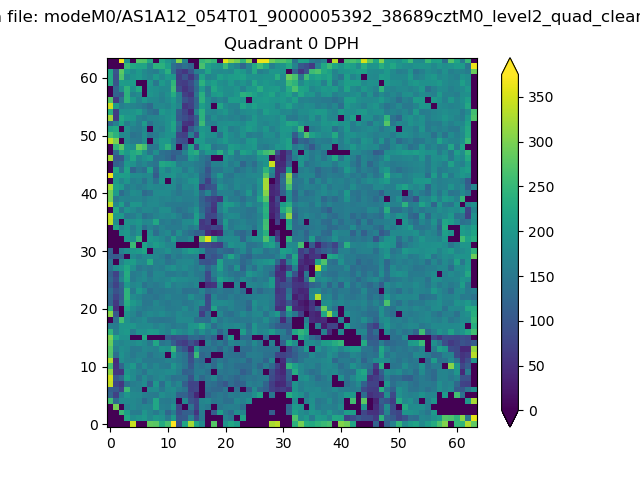 |
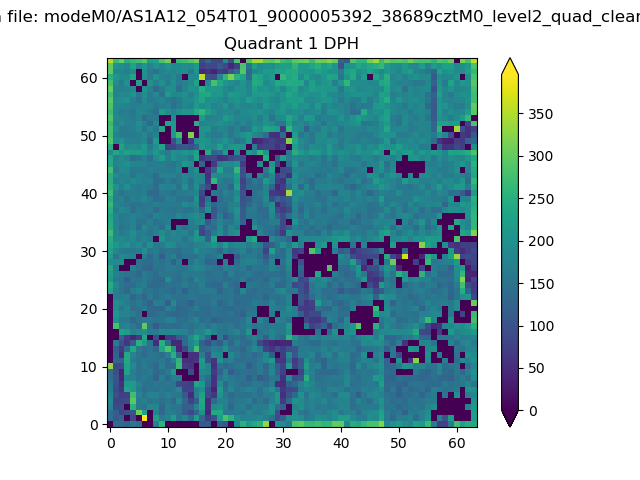 |
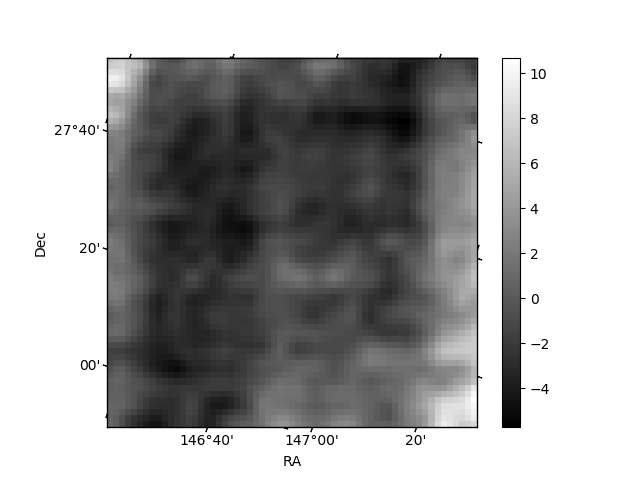
Quadrant B |
|---|---|---|---|
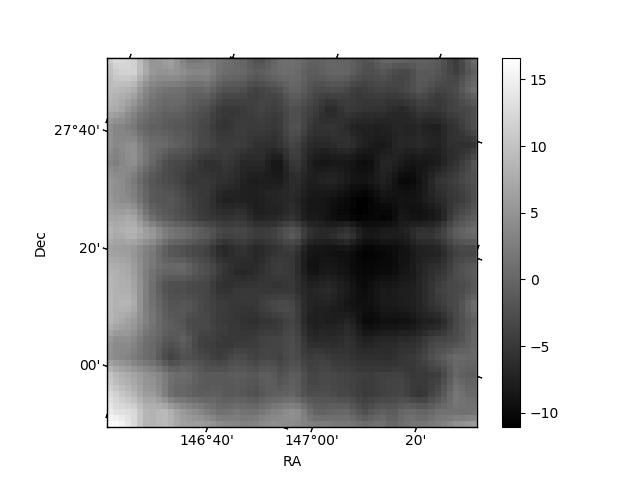
| Quadrant D | 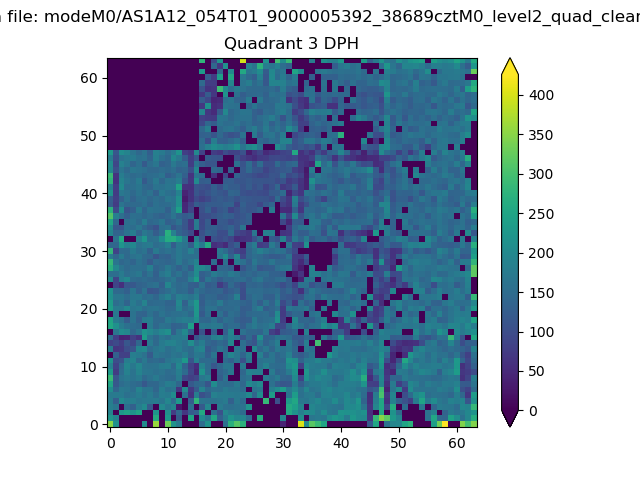 |
 |
Quadrant C |
| Plot type | Count rate plots | Images |
|---|---|---|
| Comparison with Poisson distribution Blue bars denote a histogram of data divided into 1 sec bins. Red curve is a Poisson curve with rate = median count rate of data. |
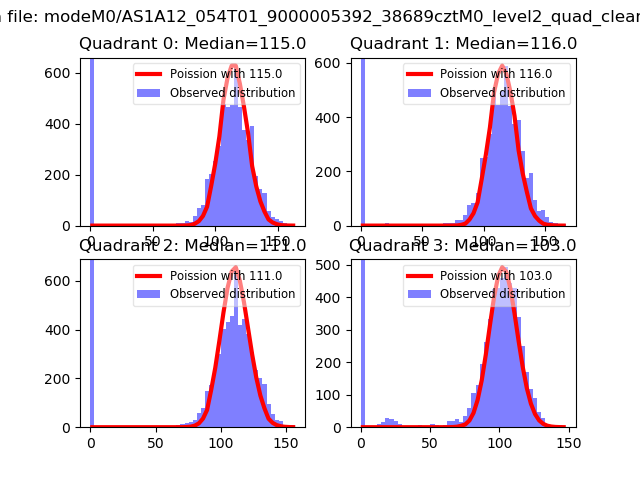 |
 |
| Quadrant-wise count rates Data is divided into 100 sec bins |
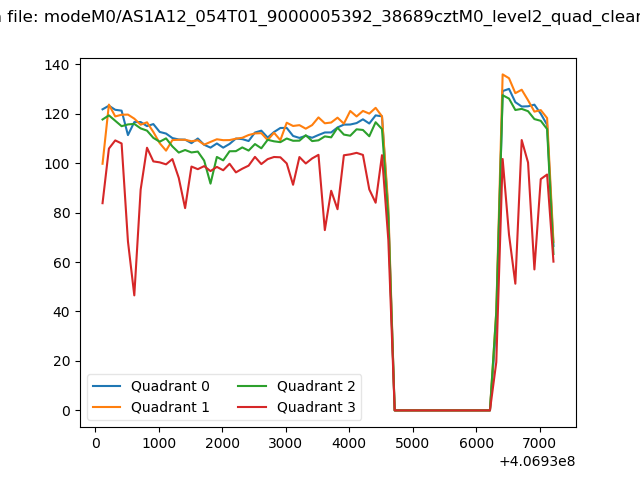 |
|
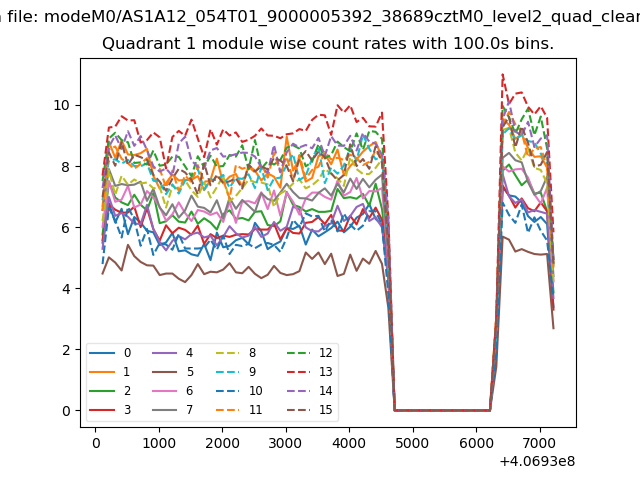
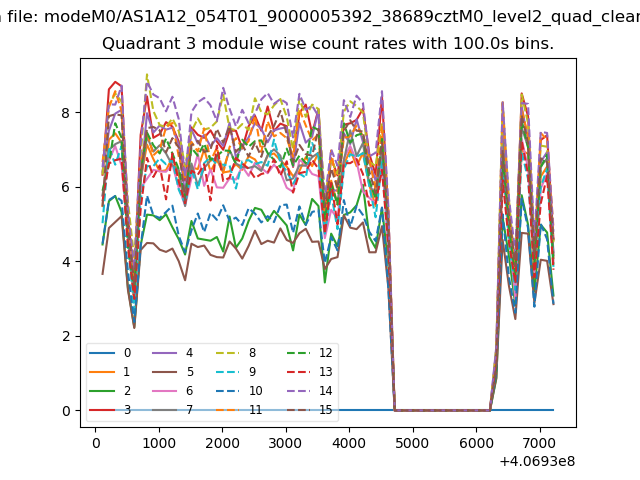
| Module-wise count rates for Quadrant A Data is divided into 100 sec bins |
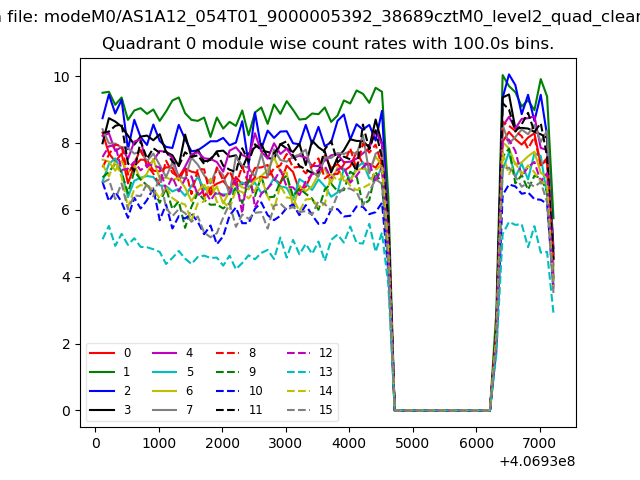 |
 |
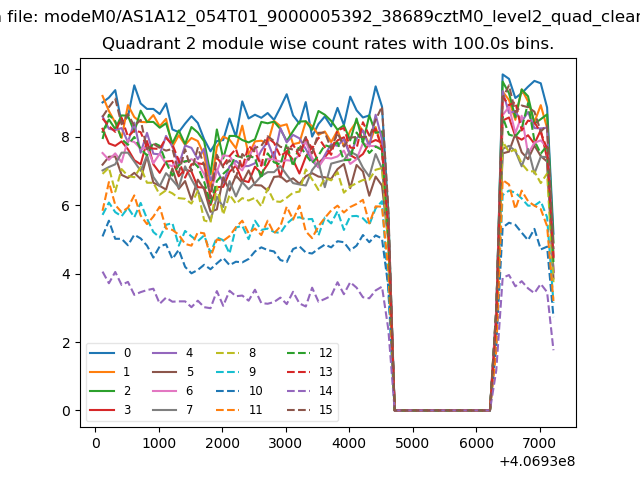
| Module-wise count rates for Quadrant B Data is divided into 100 sec bins |
 |
 |
| Module-wise count rates for Quadrant C Data is divided into 100 sec bins |
 |
 |
| Module-wise count rates for Quadrant D Data is divided into 100 sec bins |
 |
 |
| Parameter | Plot |
|---|---|
| CZT HV Monitor | 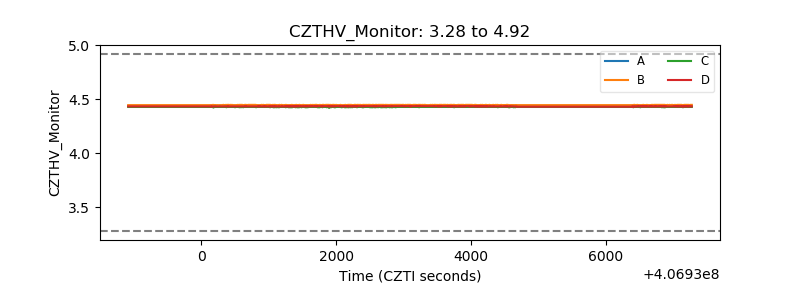 |
| D_VDD | 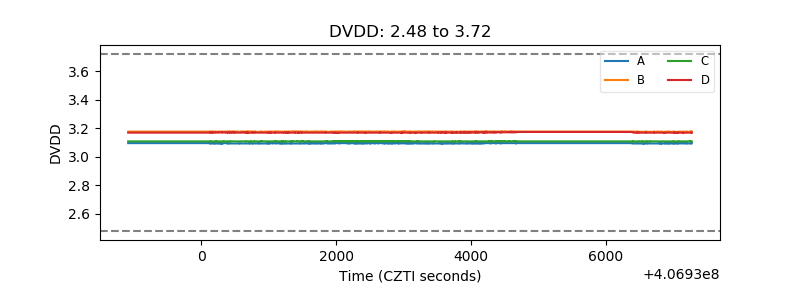 |
| Temperature 1 | 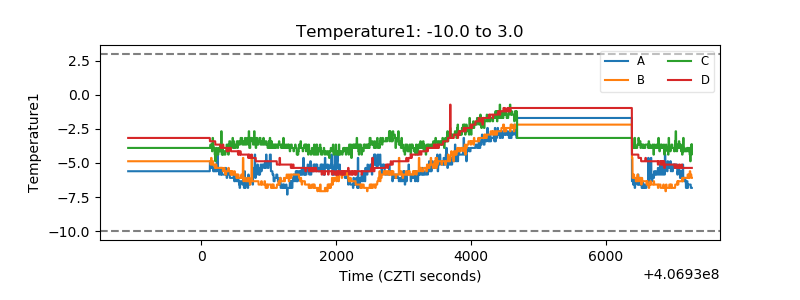 |
| Veto HV Monitor | 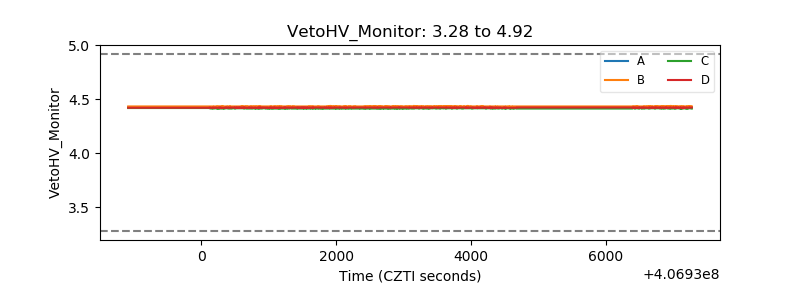 |
| Veto LLD | 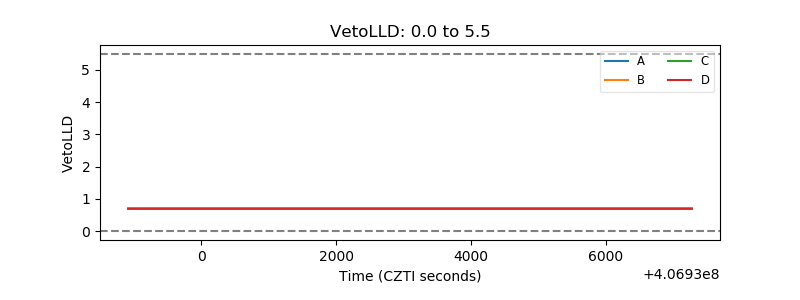 |
| Alpha Counter | 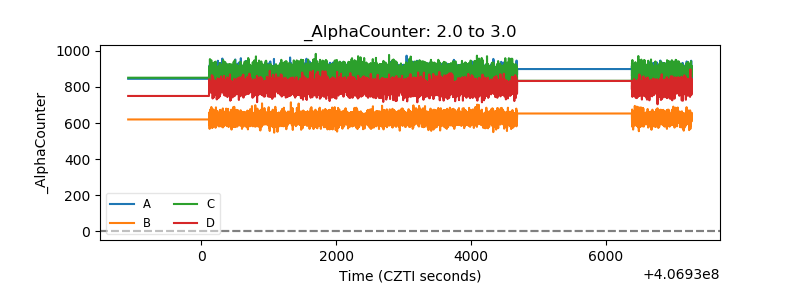 |
| _CPM_Rate | 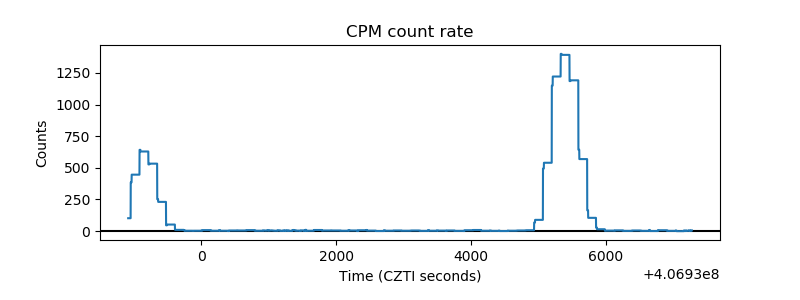 |
| CZT Counter | 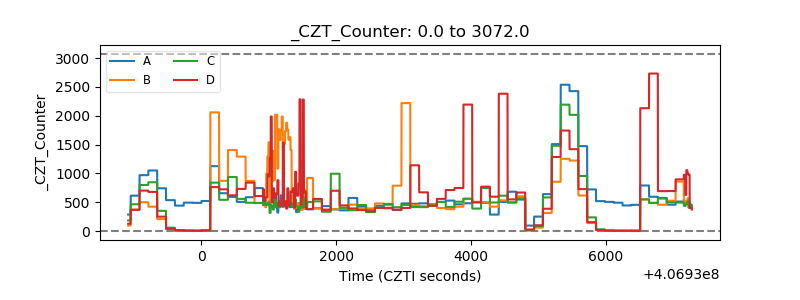 |
| +2.5 Volts monitor | 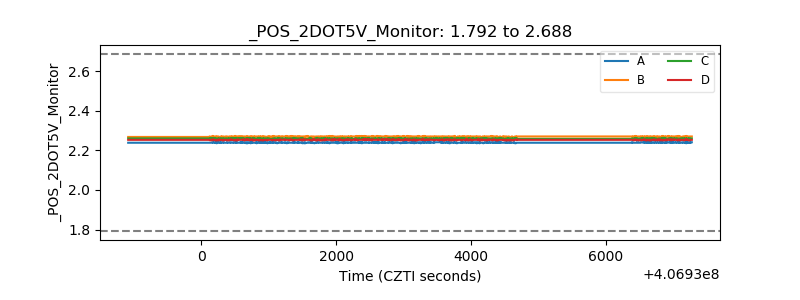 |
| +5 Volts monitor |  |
| _ROLL_ROT | 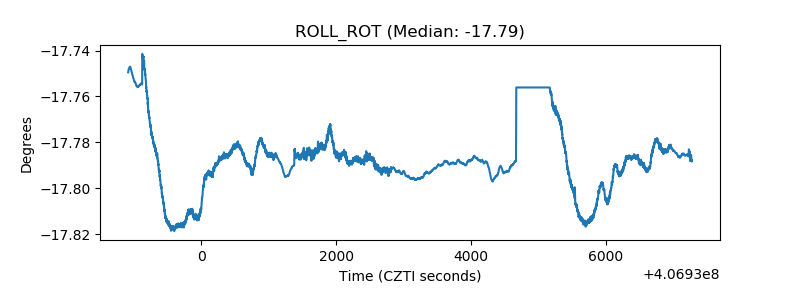 |
| _Roll_DEC | 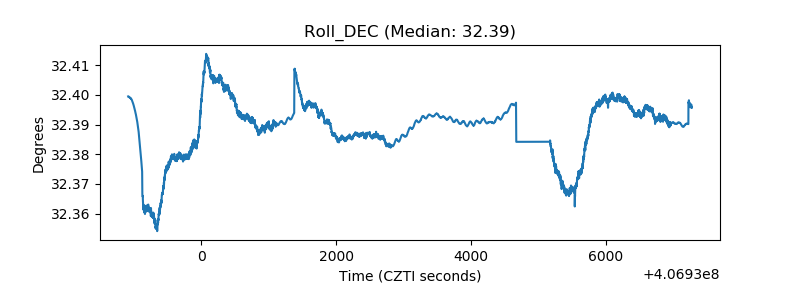 |
| _Roll_RA | 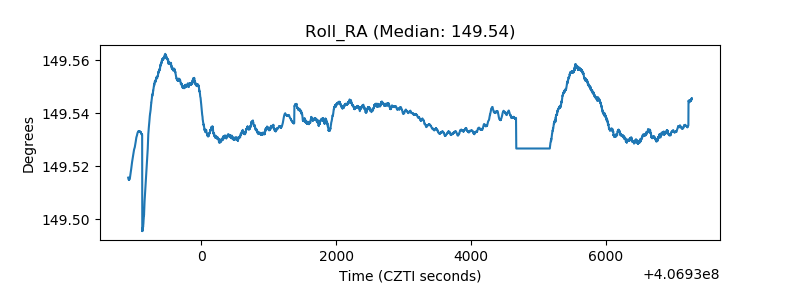 |
| Veto Counter | 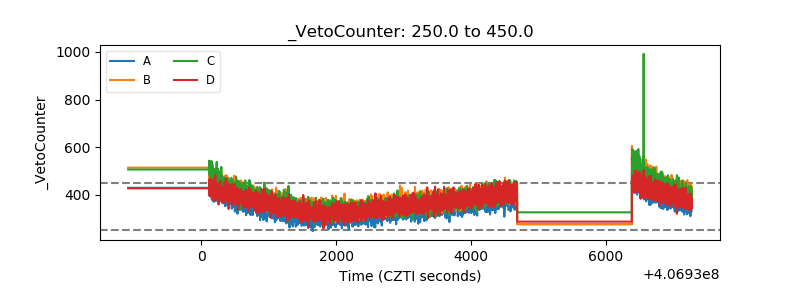 |