| Param | Original file | Final file |
|---|---|---|
| Filename | modeM0/AS1A12_054T01_9000005392_38691cztM0_level2.fits | modeM0/AS1A12_054T01_9000005392_38691cztM0_level2_quad_clean.evt |
| Size (bytes) | 341,979,840 | 90,797,760 |
| Size | 326.1 MB | 86.6 MB |
| Events in quadrant A | 2,771,633 | 624,104 |
| Events in quadrant B | 3,132,690 | 614,055 |
| Events in quadrant C | 2,770,304 | 605,718 |
| Events in quadrant D | 3,572,754 | 535,465 |
| Mode M9 | |||
|---|---|---|---|
| Quadrant | BADHDUFLAG | Total packets | Discarded packets |
| A | 0 | 29 | 0 |
| B | 0 | 29 | 0 |
| C | 0 | 29 | 0 |
| D | 0 | 30 | 0 |
| Mode SS | |||
|---|---|---|---|
| Quadrant | BADHDUFLAG | Total packets | Discarded packets |
| A | 0 | 108 | 0 |
| B | 0 | 108 | 0 |
| C | 0 | 108 | 0 |
| D | 0 | 108 | 0 |
| Mode M0 | |||
|---|---|---|---|
| Quadrant | BADHDUFLAG | Total packets | Discarded packets |
| A | 0 | 11540 | 3 |
| B | 0 | 12695 | 2 |
| C | 0 | 11604 | 2 |
| D | 0 | 14362 | 2 |
| Quadrant | Total seconds | Saturated seconds | Saturation percentage |
|---|---|---|---|
| A | 5283 | 23 | 0.435359% |
| B | 5283 | 242 | 4.580731% |
| C | 5283 | 23 | 0.435359% |
| D | 5283 | 281 | 5.318948% |
Noise dominated data is calculated using 1-second bins in cleaned event files. If a bin has >2000 counts, and if more than 50% of those come from <1% of pixels, then it is considered to be noise-dominated and hence unusable.
| Quadrant | # 1 sec bins | Bins with >0 counts | Bins with >2000 counts | High rate bins dominated by noise | Noise dominated (total time) | Noise dominated (detector-on time) | Marked lightcurve |
|---|---|---|---|---|---|---|---|
| A | 7107 | 5284 | 12 | 12 | 0.17% | 0.23% | 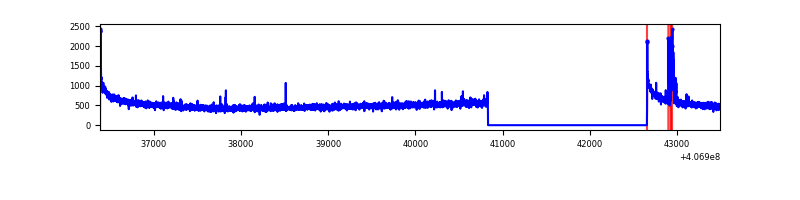 |
| B | 7107 | 5284 | 186 | 186 | 2.62% | 3.52% | 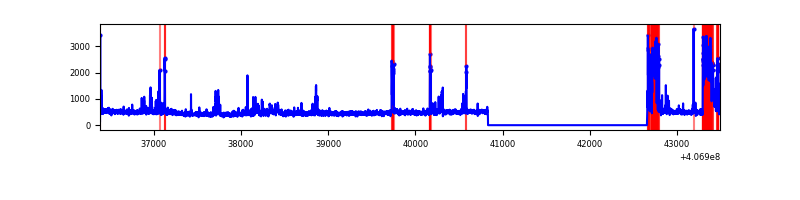 |
| C | 7107 | 5284 | 14 | 14 | 0.20% | 0.26% | 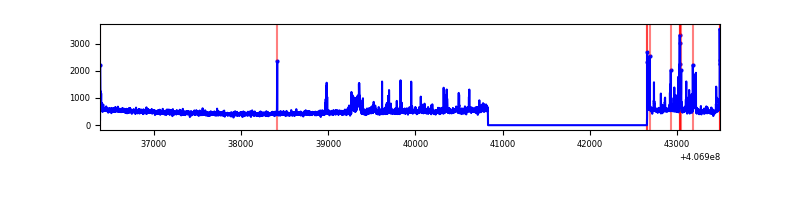 |
| D | 7107 | 5284 | 215 | 215 | 3.03% | 4.07% | 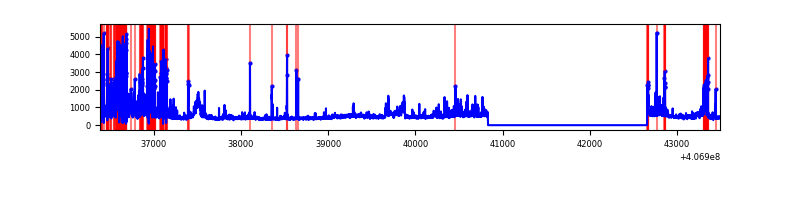 |
Top three noisy pixels from each quadrant. If the there are fewer than three noisy pixels in the level2.evt file, extra rows are filled as -1
| Pixel properties | Quadrant properties | ||||||
|---|---|---|---|---|---|---|---|
| Quadrant | DetID | PixID | Counts | Sigma | Mean | Median | Sigma |
| A | 10 | 83 | 383544 | 3137.63 | 598 | 587 | 122.1 |
| A | 13 | 248 | 58531 | 474.74 | 598 | 587 | 122.1 |
| A | 13 | 254 | 10097 | 77.92 | 598 | 587 | 122.1 |
| B | 4 | 171 | 412886 | 3679.68 | 585 | 570 | 112.1 |
| B | 5 | 184 | 350783 | 3125.45 | 585 | 570 | 112.1 |
| B | 4 | 251 | 23799 | 207.31 | 585 | 570 | 112.1 |
| C | 15 | 214 | 215614 | 1572.95 | 583 | 587 | 136.7 |
| C | 2 | 16 | 210998 | 1539.18 | 583 | 587 | 136.7 |
| C | 14 | 254 | 28117 | 201.39 | 583 | 587 | 136.7 |
| D | 2 | 16 | 496399 | 3617.66 | 560 | 544 | 137.1 |
| D | 12 | 227 | 199542 | 1451.85 | 560 | 544 | 137.1 |
| D | 5 | 222 | 193795 | 1409.92 | 560 | 544 | 137.1 |
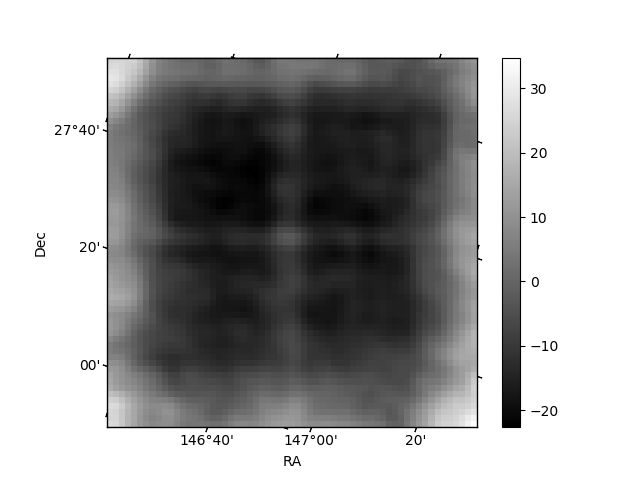
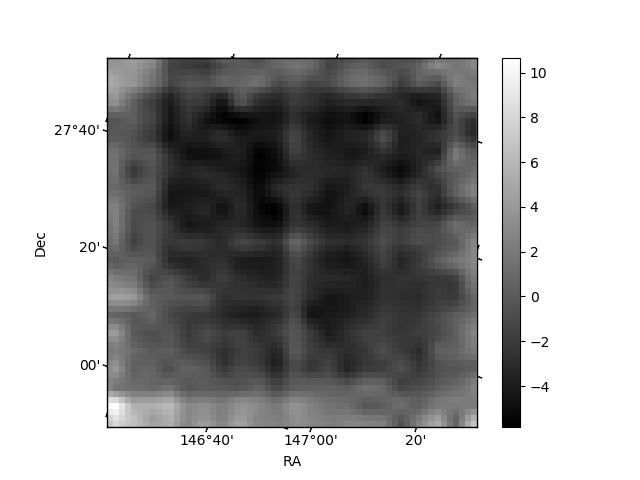
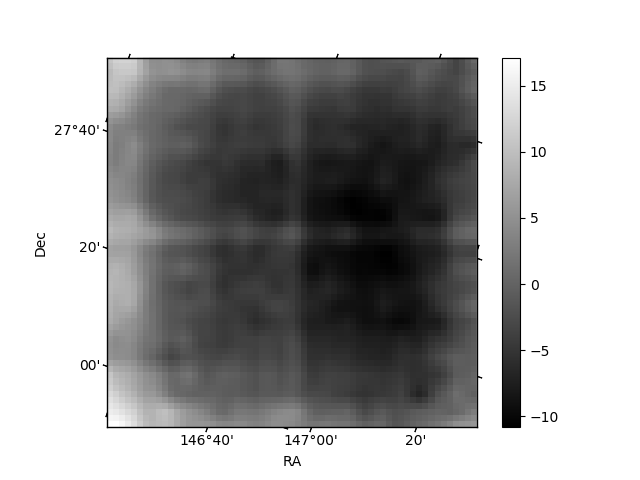
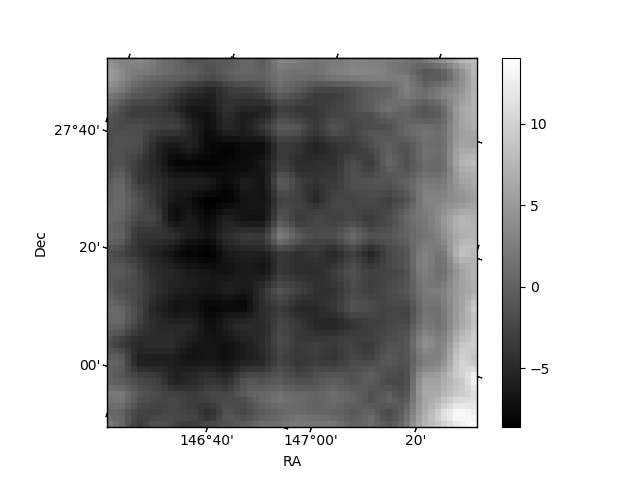
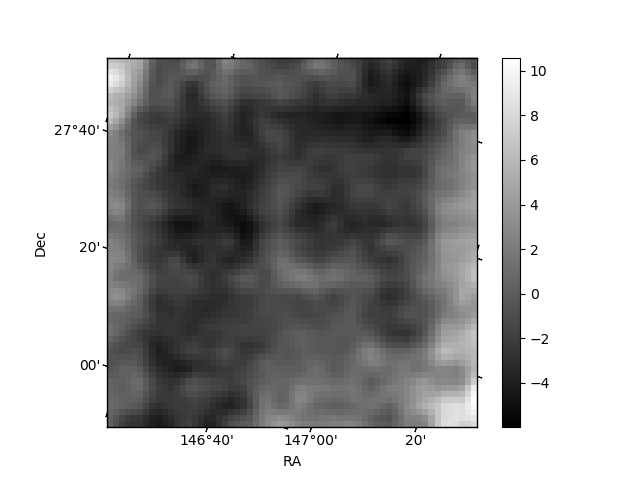
Histogram calculated using DETX and DETY for each event in the final _common_clean file
| Quadrant A | 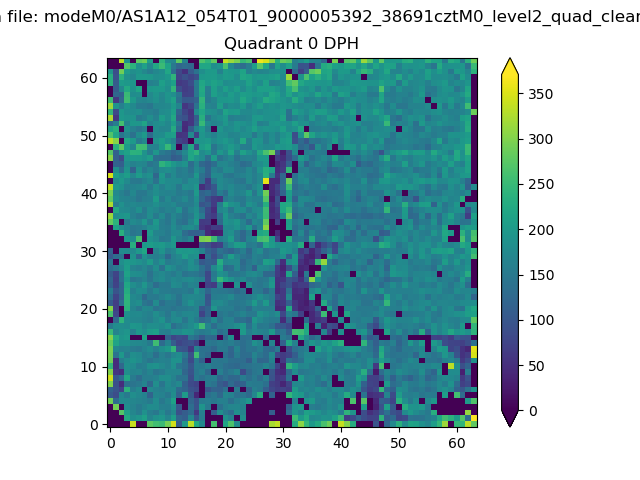 |
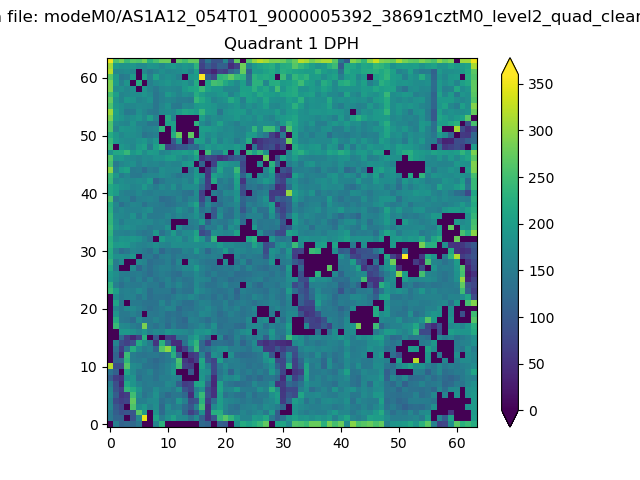 |
Quadrant B |
|---|---|---|---|
| Quadrant D | 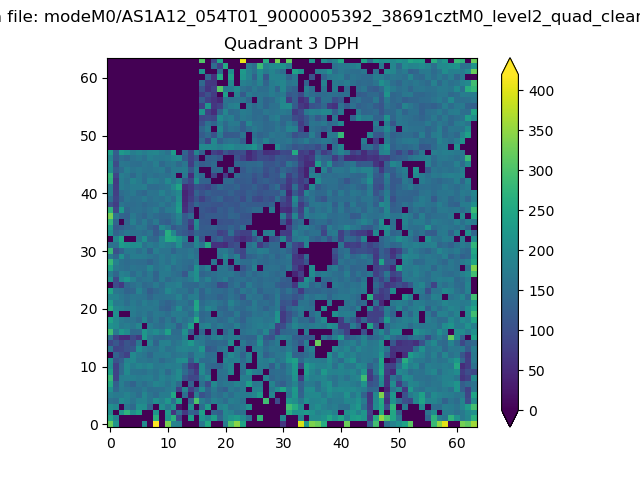 |
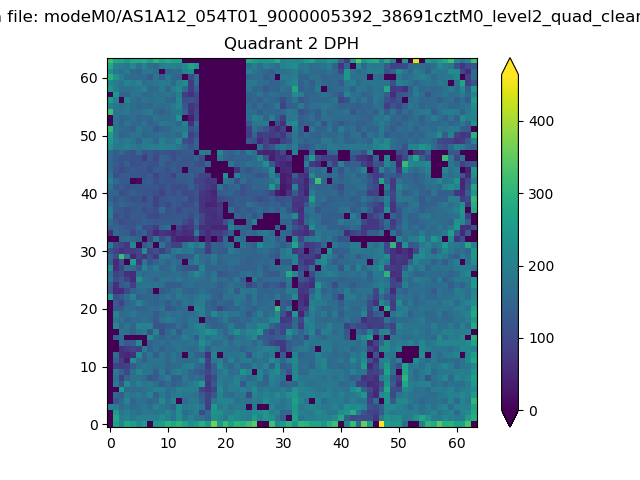 |
Quadrant C |
| Plot type | Count rate plots | Images |
|---|---|---|
| Comparison with Poisson distribution Blue bars denote a histogram of data divided into 1 sec bins. Red curve is a Poisson curve with rate = median count rate of data. |
 |
 |
| Quadrant-wise count rates Data is divided into 100 sec bins |
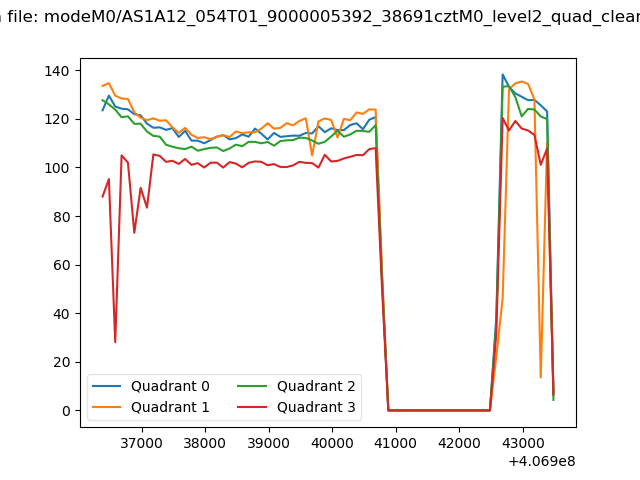 |
|
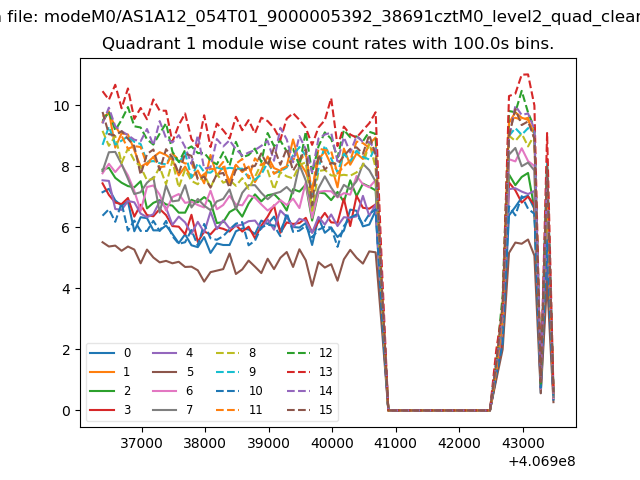
| Module-wise count rates for Quadrant A Data is divided into 100 sec bins |
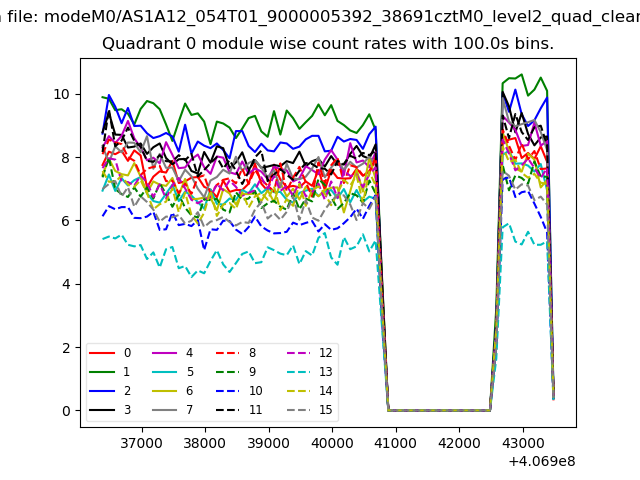 |
 |
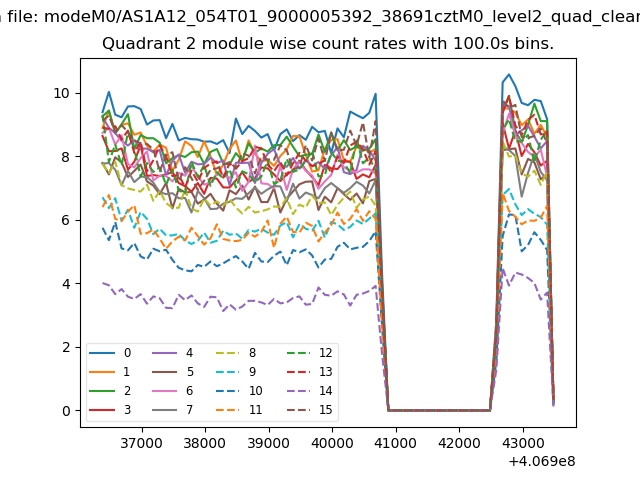
| Module-wise count rates for Quadrant B Data is divided into 100 sec bins |
 |
 |
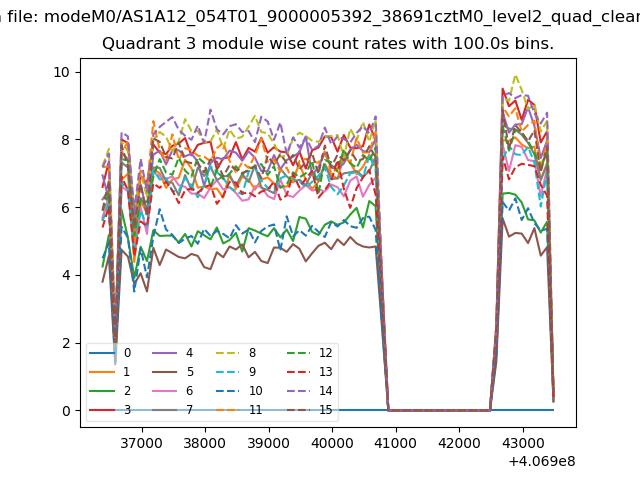
| Module-wise count rates for Quadrant C Data is divided into 100 sec bins |
 |
 |
| Module-wise count rates for Quadrant D Data is divided into 100 sec bins |
 |
 |
| Parameter | Plot |
|---|---|
| CZT HV Monitor | 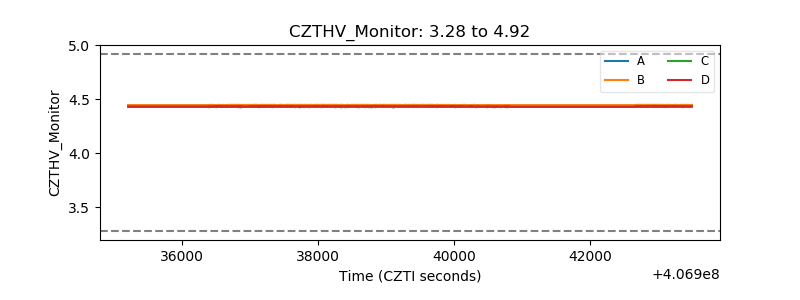 |
| D_VDD | 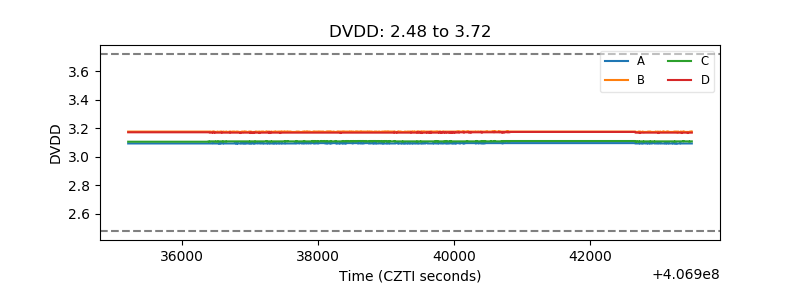 |
| Temperature 1 | 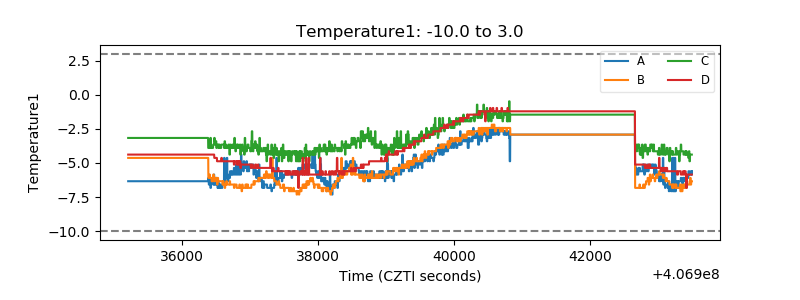 |
| Veto HV Monitor |  |
| Veto LLD | 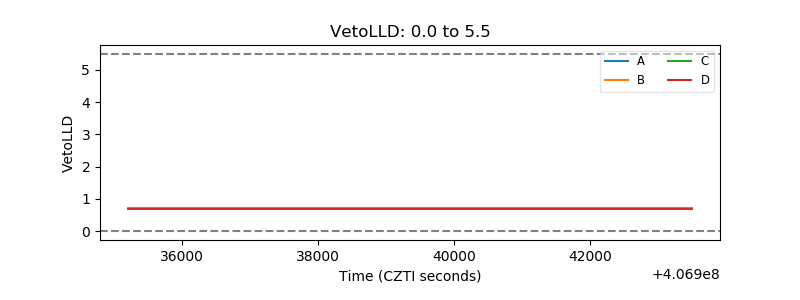 |
| Alpha Counter | 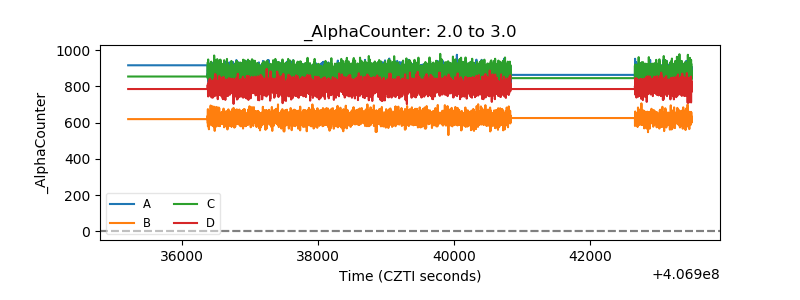 |
| _CPM_Rate | 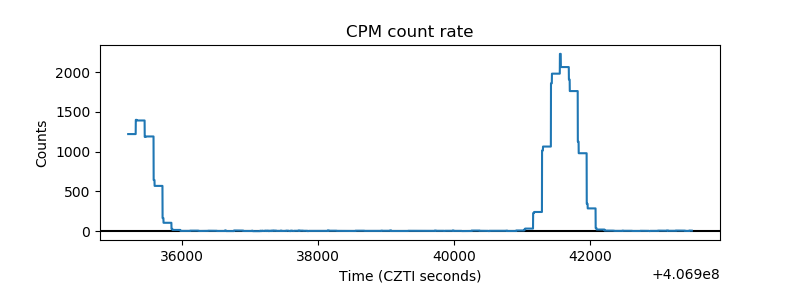 |
| CZT Counter | 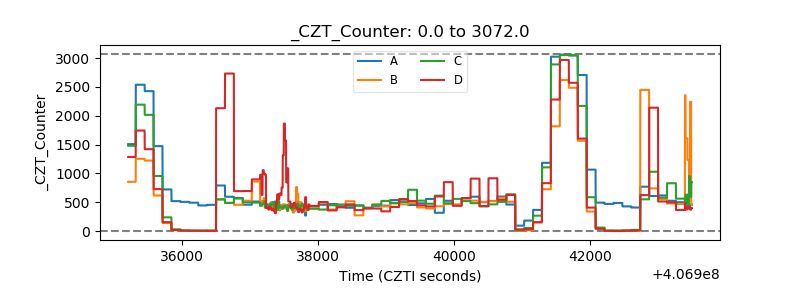 |
| +2.5 Volts monitor | 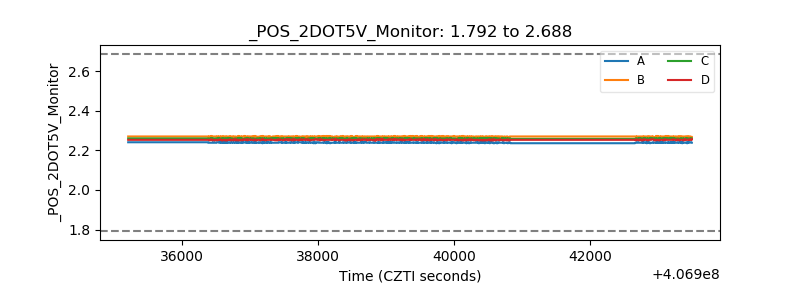 |
| +5 Volts monitor | 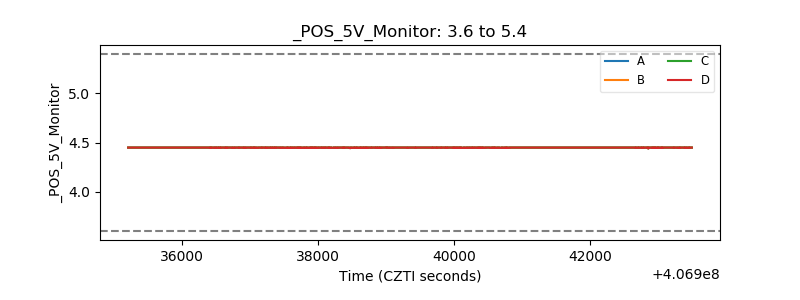 |
| _ROLL_ROT | 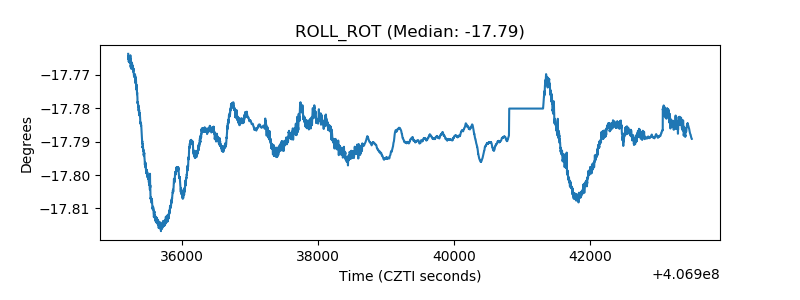 |
| _Roll_DEC | 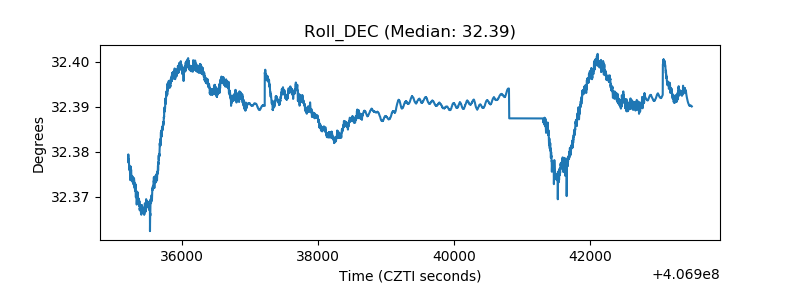 |
| _Roll_RA | 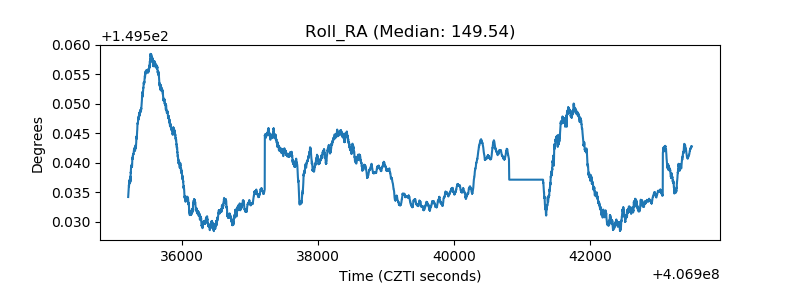 |
| Veto Counter | 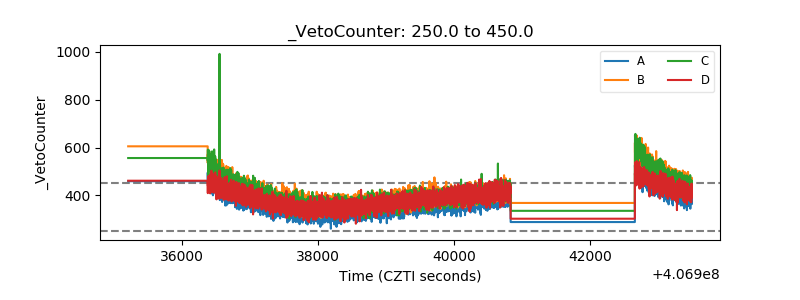 |