| Param | Original file | Final file |
|---|---|---|
| Filename | modeM0/AS1A12_054T01_9000005392_38692cztM0_level2.fits | modeM0/AS1A12_054T01_9000005392_38692cztM0_level2_quad_clean.evt |
| Size (bytes) | 398,724,480 | 93,576,960 |
| Size | 380.3 MB | 89.2 MB |
| Events in quadrant A | 3,059,125 | 656,048 |
| Events in quadrant B | 4,368,868 | 601,080 |
| Events in quadrant C | 3,012,861 | 636,636 |
| Events in quadrant D | 3,902,212 | 565,499 |
| Mode M9 | |||
|---|---|---|---|
| Quadrant | BADHDUFLAG | Total packets | Discarded packets |
| A | 0 | 33 | 0 |
| B | 0 | 33 | 0 |
| C | 0 | 33 | 0 |
| D | 0 | 34 | 0 |
| Mode SS | |||
|---|---|---|---|
| Quadrant | BADHDUFLAG | Total packets | Discarded packets |
| A | 0 | 108 | 0 |
| B | 0 | 108 | 0 |
| C | 0 | 108 | 0 |
| D | 0 | 108 | 0 |
| Mode M0 | |||
|---|---|---|---|
| Quadrant | BADHDUFLAG | Total packets | Discarded packets |
| A | 0 | 12315 | 3 |
| B | 0 | 16418 | 2 |
| C | 0 | 12193 | 2 |
| D | 0 | 15373 | 2 |
| Quadrant | Total seconds | Saturated seconds | Saturation percentage |
|---|---|---|---|
| A | 5351 | 42 | 0.784900% |
| B | 5351 | 702 | 13.119043% |
| C | 5351 | 58 | 1.083910% |
| D | 5351 | 267 | 4.989722% |
Noise dominated data is calculated using 1-second bins in cleaned event files. If a bin has >2000 counts, and if more than 50% of those come from <1% of pixels, then it is considered to be noise-dominated and hence unusable.
| Quadrant | # 1 sec bins | Bins with >0 counts | Bins with >2000 counts | High rate bins dominated by noise | Noise dominated (total time) | Noise dominated (detector-on time) | Marked lightcurve |
|---|---|---|---|---|---|---|---|
| A | 7324 | 5352 | 32 | 32 | 0.44% | 0.60% | 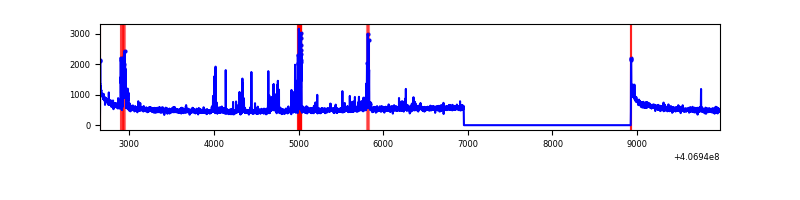 |
| B | 7324 | 5352 | 617 | 617 | 8.42% | 11.53% | 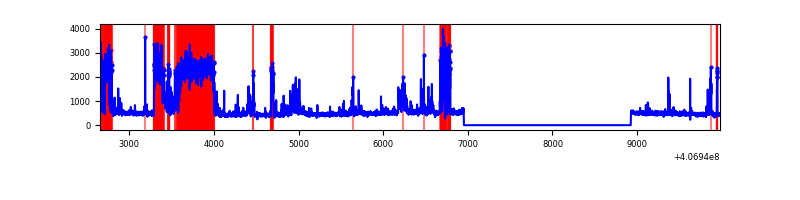 |
| C | 7324 | 5352 | 41 | 41 | 0.56% | 0.77% | 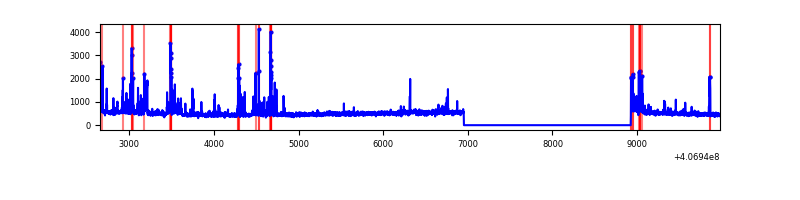 |
| D | 7324 | 5352 | 234 | 234 | 3.19% | 4.37% | 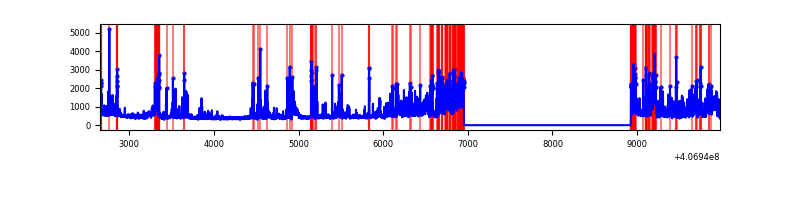 |
Top three noisy pixels from each quadrant. If the there are fewer than three noisy pixels in the level2.evt file, extra rows are filled as -1
| Pixel properties | Quadrant properties | ||||||
|---|---|---|---|---|---|---|---|
| Quadrant | DetID | PixID | Counts | Sigma | Mean | Median | Sigma |
| A | 10 | 83 | 398912 | 3188.23 | 616 | 605 | 124.9 |
| A | 13 | 248 | 205138 | 1637.17 | 616 | 605 | 124.9 |
| A | 15 | 174 | 58642 | 464.55 | 616 | 605 | 124.9 |
| B | 5 | 184 | 1434231 | 12752.63 | 589 | 574 | 112.4 |
| B | 4 | 171 | 375988 | 3339.37 | 589 | 574 | 112.4 |
| B | 0 | 221 | 189523 | 1680.73 | 589 | 574 | 112.4 |
| C | 2 | 16 | 244659 | 1751.03 | 597 | 601 | 139.4 |
| C | 15 | 214 | 219586 | 1571.14 | 597 | 601 | 139.4 |
| C | 14 | 254 | 163563 | 1169.19 | 597 | 601 | 139.4 |
| D | 2 | 16 | 651637 | 4455.42 | 584 | 565 | 146.1 |
| D | 12 | 227 | 356517 | 2435.85 | 584 | 565 | 146.1 |
| D | 5 | 222 | 215227 | 1468.98 | 584 | 565 | 146.1 |
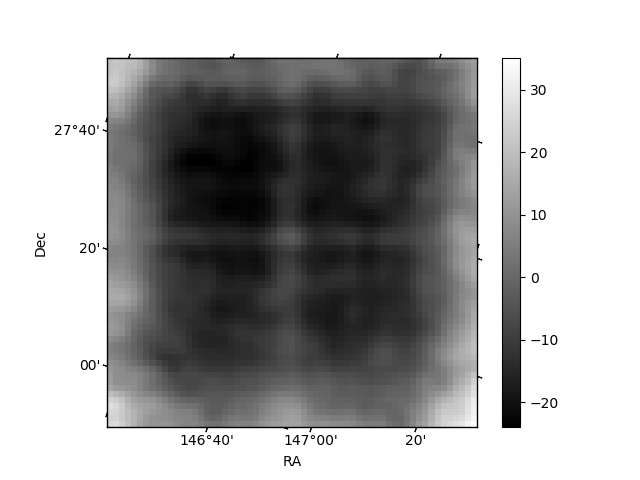
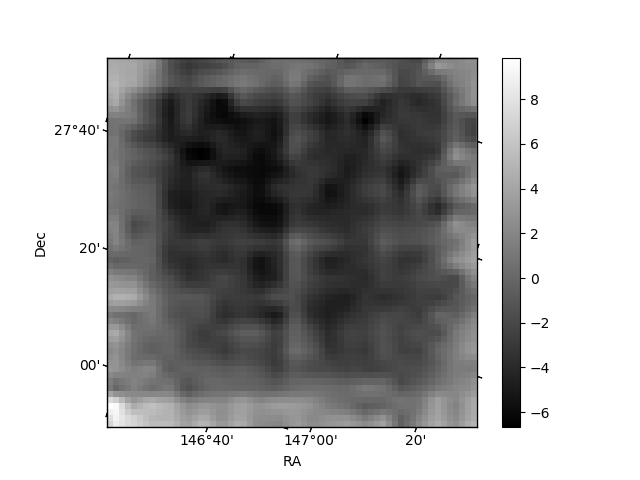
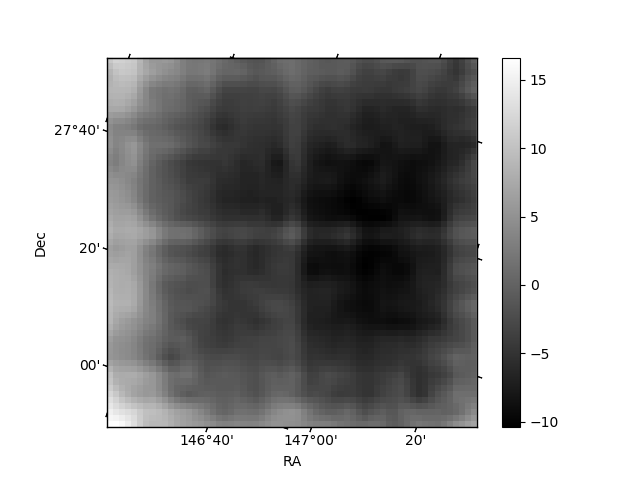
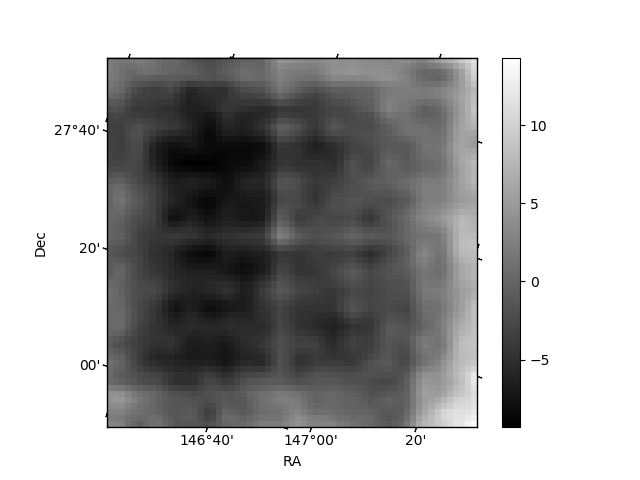
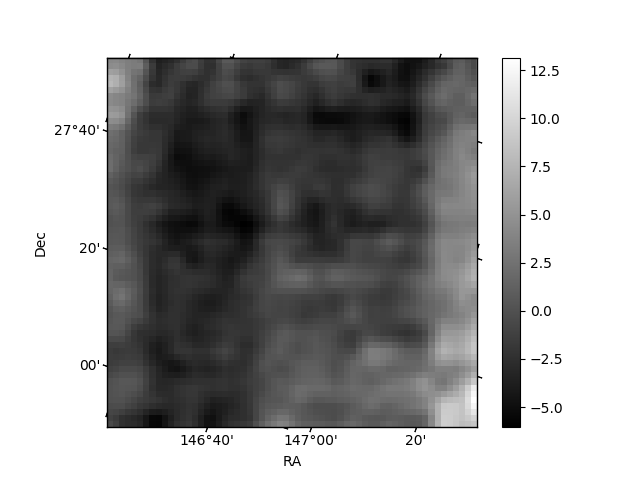
Histogram calculated using DETX and DETY for each event in the final _common_clean file
| Quadrant A | 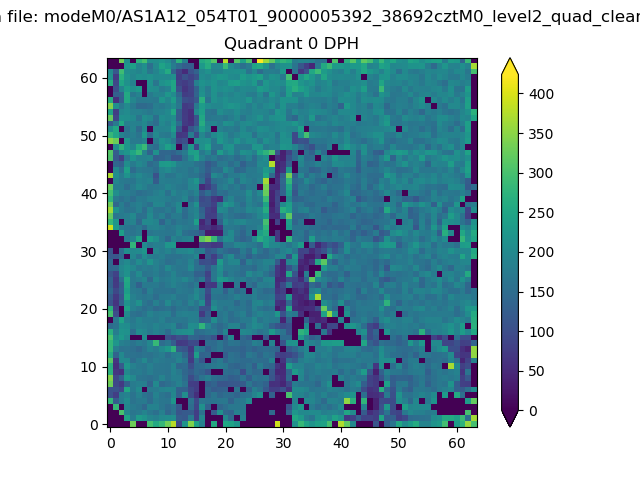 |
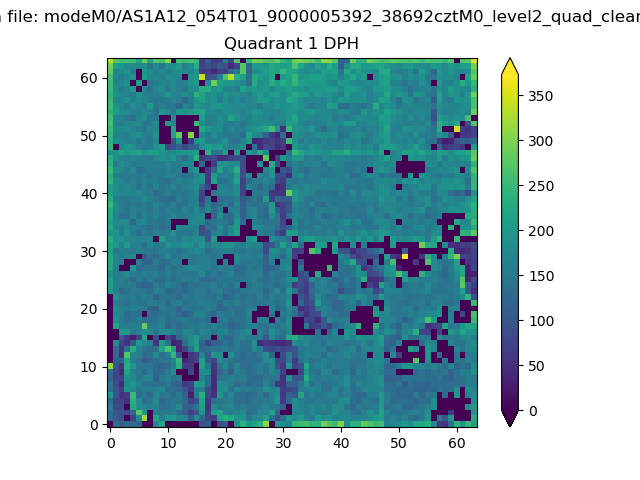 |
Quadrant B |
|---|---|---|---|
| Quadrant D | 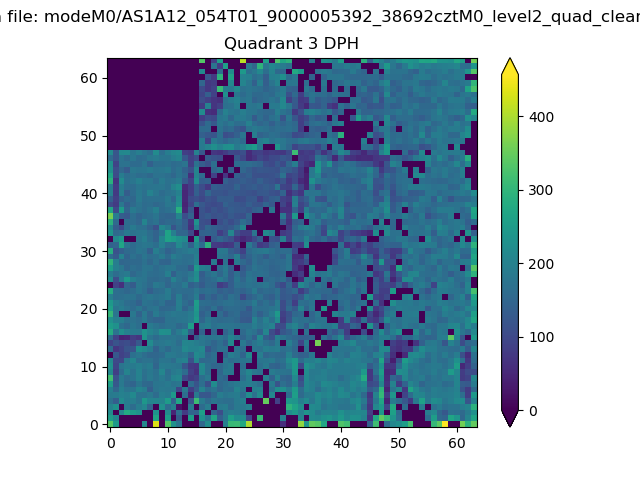 |
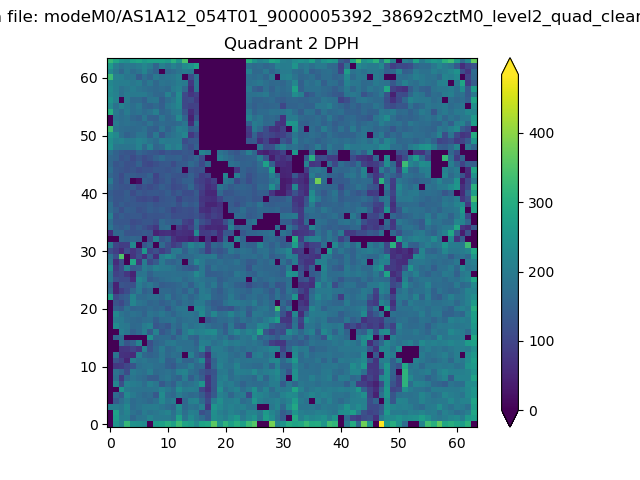 |
Quadrant C |
| Plot type | Count rate plots | Images |
|---|---|---|
| Comparison with Poisson distribution Blue bars denote a histogram of data divided into 1 sec bins. Red curve is a Poisson curve with rate = median count rate of data. |
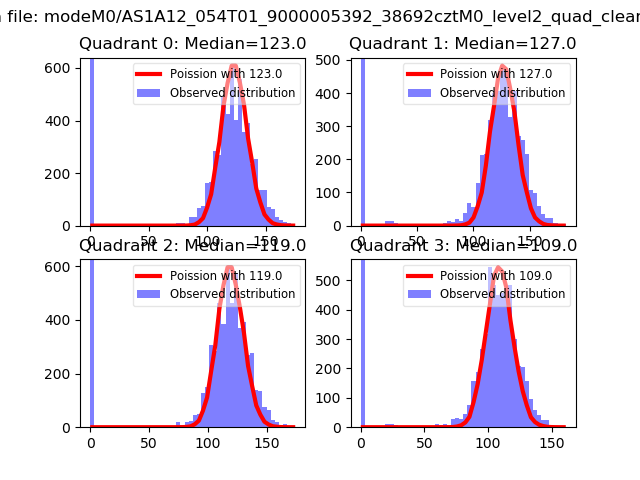 |
 |
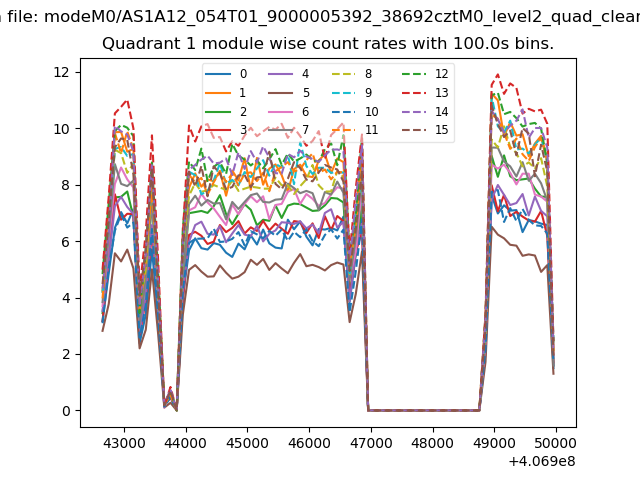
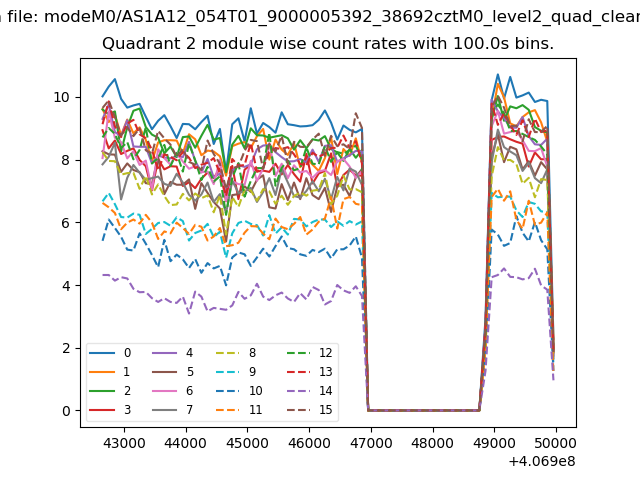
| Quadrant-wise count rates Data is divided into 100 sec bins |
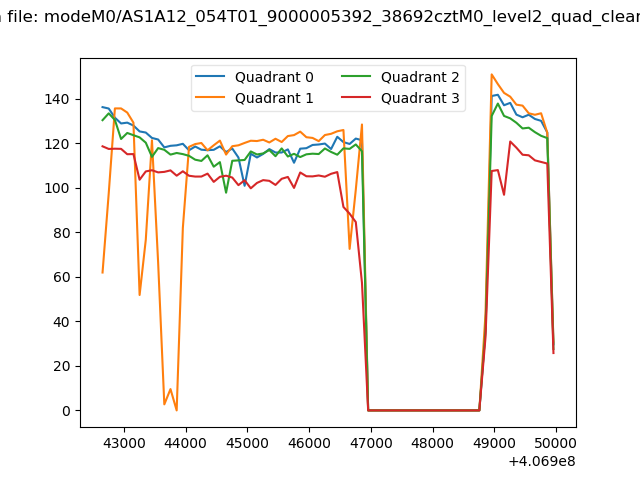 |
|
| Module-wise count rates for Quadrant A Data is divided into 100 sec bins |
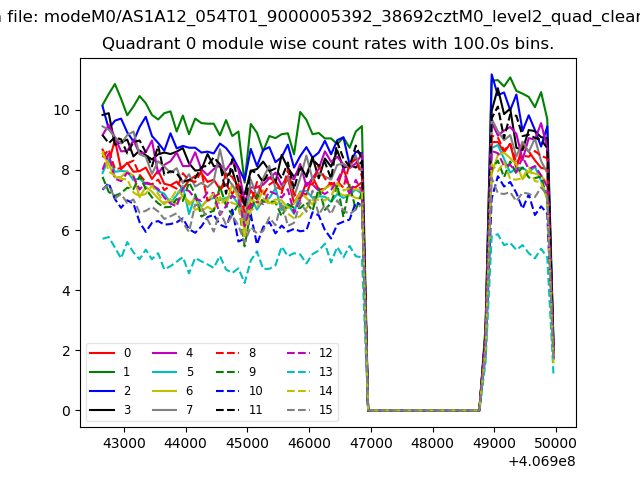 |
 |
| Module-wise count rates for Quadrant B Data is divided into 100 sec bins |
 |
 |
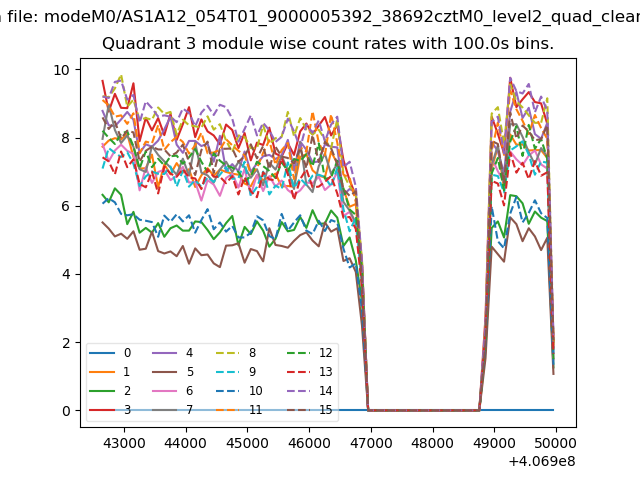
| Module-wise count rates for Quadrant C Data is divided into 100 sec bins |
 |
 |
| Module-wise count rates for Quadrant D Data is divided into 100 sec bins |
 |
 |
| Parameter | Plot |
|---|---|
| CZT HV Monitor | 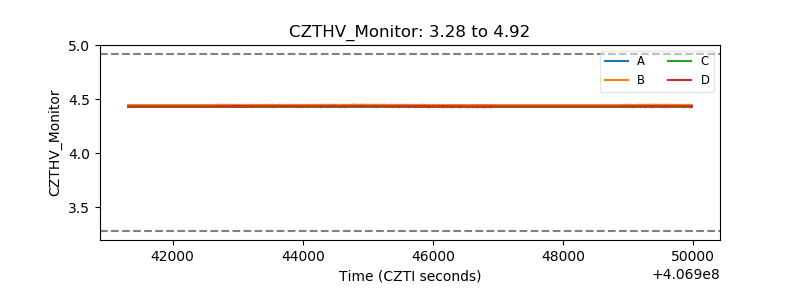 |
| D_VDD | 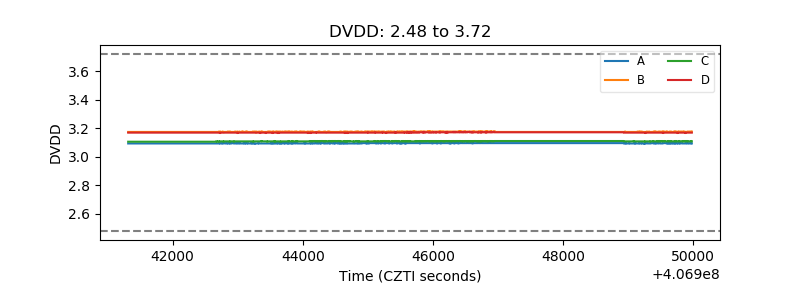 |
| Temperature 1 | 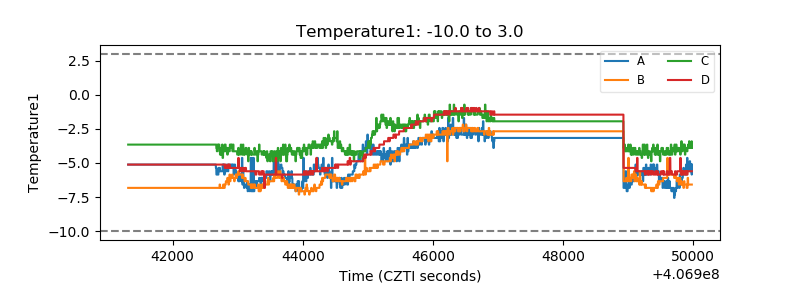 |
| Veto HV Monitor | 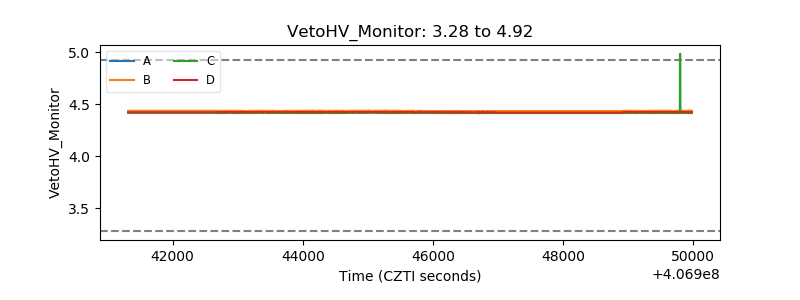 |
| Veto LLD | 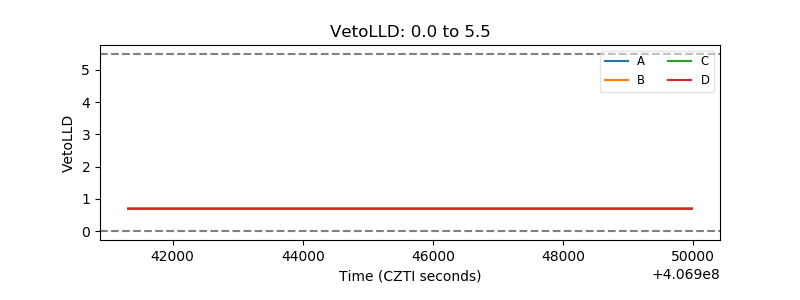 |
| Alpha Counter | 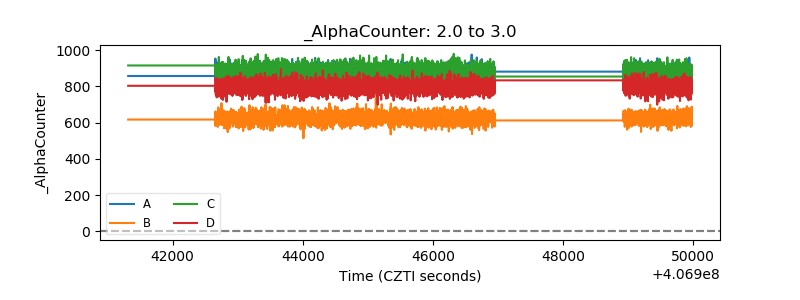 |
| _CPM_Rate | 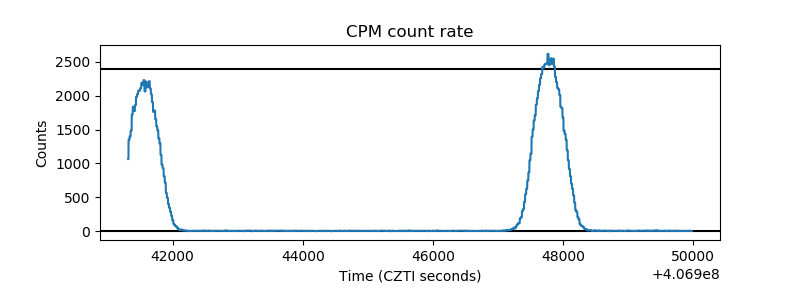 |
| CZT Counter | 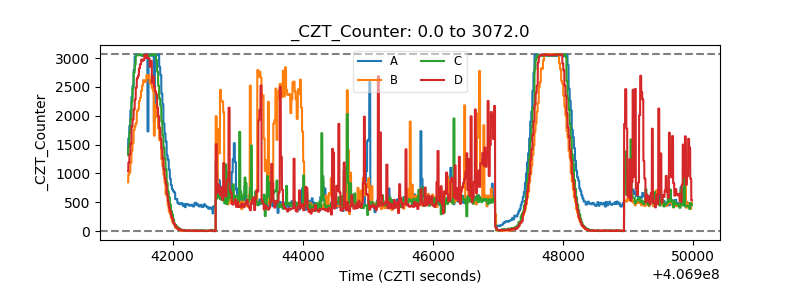 |
| +2.5 Volts monitor | 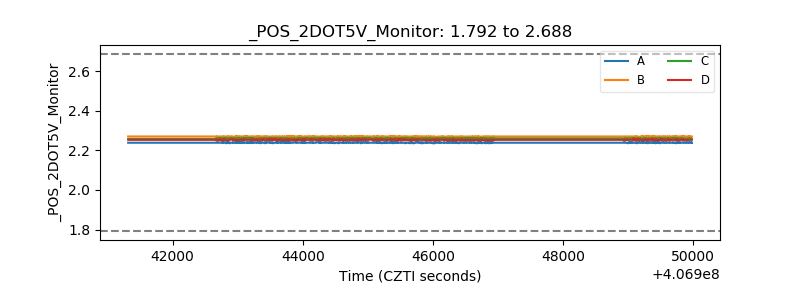 |
| +5 Volts monitor | 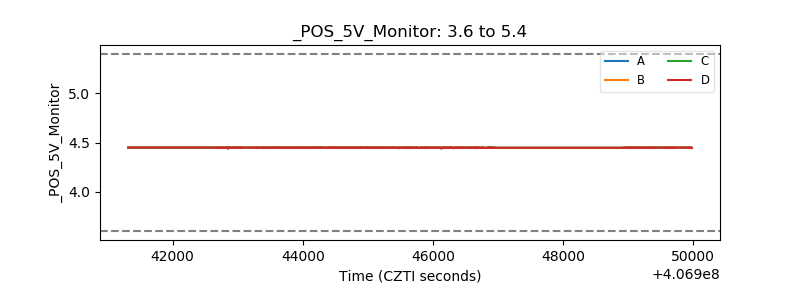 |
| _ROLL_ROT | 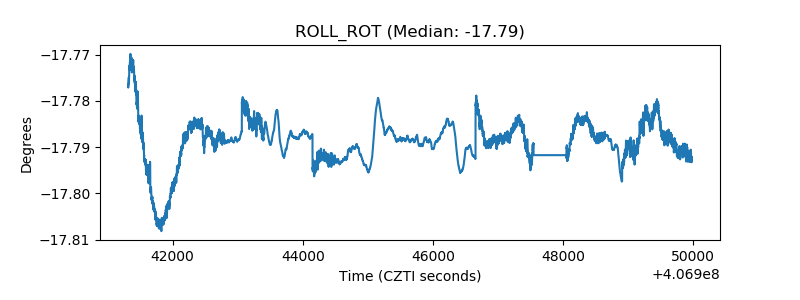 |
| _Roll_DEC | 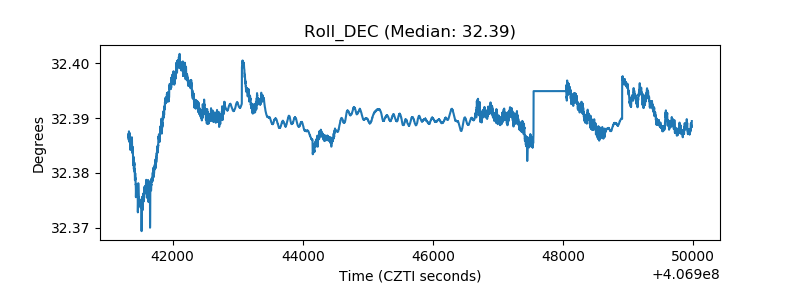 |
| _Roll_RA | 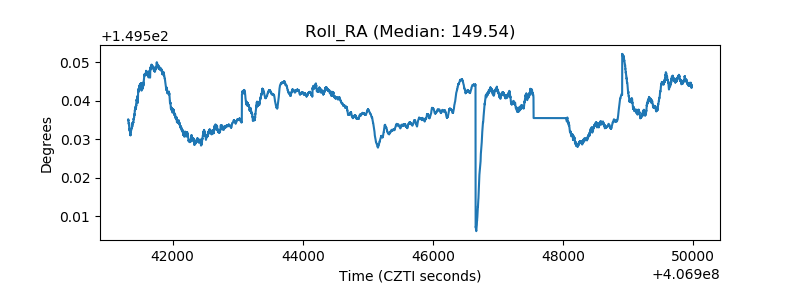 |
| Veto Counter | 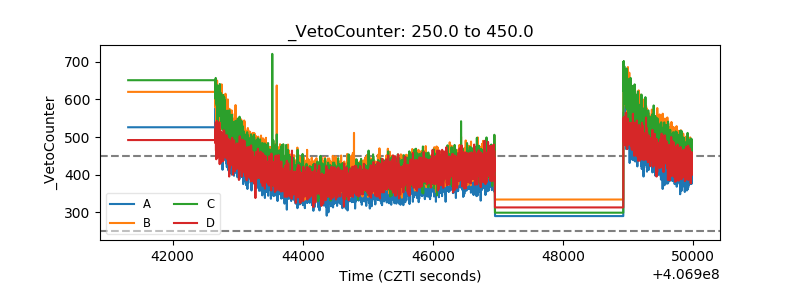 |