| Param | Original file | Final file |
|---|---|---|
| Filename | modeM0/AS1A12_054T01_9000005392_38693cztM0_level2.fits | modeM0/AS1A12_054T01_9000005392_38693cztM0_level2_quad_clean.evt |
| Size (bytes) | 431,470,080 | 95,388,480 |
| Size | 411.5 MB | 91.0 MB |
| Events in quadrant A | 2,875,769 | 671,537 |
| Events in quadrant B | 2,869,880 | 682,372 |
| Events in quadrant C | 2,925,193 | 644,656 |
| Events in quadrant D | 6,890,858 | 520,317 |
| Mode M9 | |||
|---|---|---|---|
| Quadrant | BADHDUFLAG | Total packets | Discarded packets |
| A | 0 | 28 | 0 |
| B | 0 | 28 | 0 |
| C | 0 | 28 | 0 |
| D | 0 | 29 | 0 |
| Mode SS | |||
|---|---|---|---|
| Quadrant | BADHDUFLAG | Total packets | Discarded packets |
| A | 0 | 108 | 0 |
| B | 0 | 108 | 0 |
| C | 0 | 108 | 0 |
| D | 0 | 108 | 0 |
| Mode M0 | |||
|---|---|---|---|
| Quadrant | BADHDUFLAG | Total packets | Discarded packets |
| A | 0 | 11686 | 3 |
| B | 0 | 11861 | 2 |
| C | 0 | 11855 | 2 |
| D | 0 | 24117 | 2 |
| Quadrant | Total seconds | Saturated seconds | Saturation percentage |
|---|---|---|---|
| A | 5277 | 17 | 0.322153% |
| B | 5277 | 101 | 1.913966% |
| C | 5277 | 32 | 0.606405% |
| D | 5277 | 906 | 17.168846% |
Noise dominated data is calculated using 1-second bins in cleaned event files. If a bin has >2000 counts, and if more than 50% of those come from <1% of pixels, then it is considered to be noise-dominated and hence unusable.
| Quadrant | # 1 sec bins | Bins with >0 counts | Bins with >2000 counts | High rate bins dominated by noise | Noise dominated (total time) | Noise dominated (detector-on time) | Marked lightcurve |
|---|---|---|---|---|---|---|---|
| A | 7341 | 5279 | 7 | 7 | 0.10% | 0.13% | 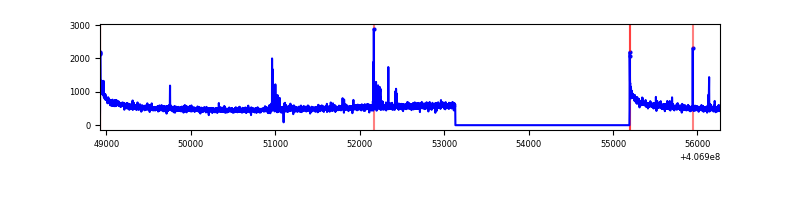 |
| B | 7341 | 5279 | 52 | 52 | 0.71% | 0.99% | 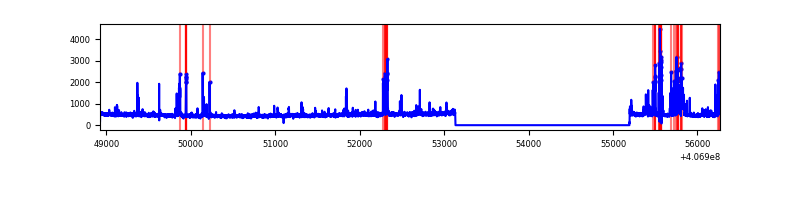 |
| C | 7341 | 5279 | 31 | 31 | 0.42% | 0.59% | 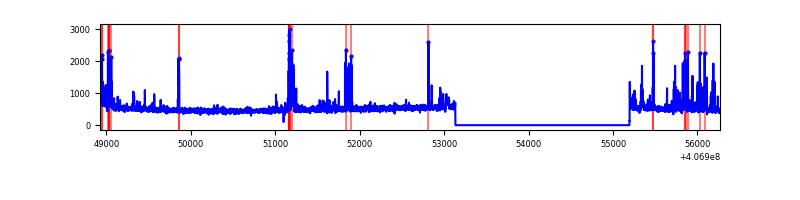 |
| D | 7341 | 5279 | 943 | 943 | 12.85% | 17.86% | 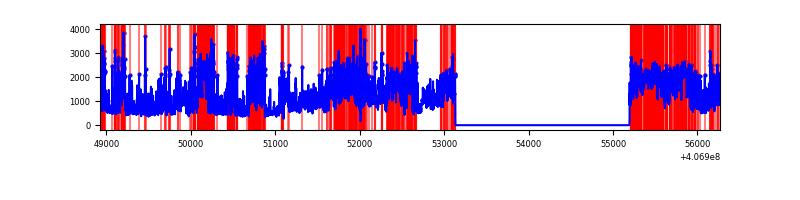 |
Top three noisy pixels from each quadrant. If the there are fewer than three noisy pixels in the level2.evt file, extra rows are filled as -1
| Pixel properties | Quadrant properties | ||||||
|---|---|---|---|---|---|---|---|
| Quadrant | DetID | PixID | Counts | Sigma | Mean | Median | Sigma |
| A | 10 | 83 | 400984 | 3214.88 | 621 | 611 | 124.5 |
| A | 13 | 248 | 52646 | 417.83 | 621 | 611 | 124.5 |
| A | 13 | 6 | 9398 | 70.56 | 621 | 611 | 124.5 |
| B | 4 | 171 | 397569 | 3392.84 | 616 | 600 | 117.0 |
| B | 4 | 251 | 18551 | 153.42 | 616 | 600 | 117.0 |
| B | 12 | 111 | 14095 | 115.34 | 616 | 600 | 117.0 |
| C | 15 | 214 | 216588 | 1553.17 | 601 | 604 | 139.1 |
| C | 14 | 254 | 208229 | 1493.06 | 601 | 604 | 139.1 |
| C | 2 | 16 | 125596 | 898.83 | 601 | 604 | 139.1 |
| D | 2 | 16 | 3659588 | 25896.11 | 571 | 552 | 141.3 |
| D | 12 | 227 | 560876 | 3965.58 | 571 | 552 | 141.3 |
| D | 5 | 222 | 151609 | 1069.08 | 571 | 552 | 141.3 |
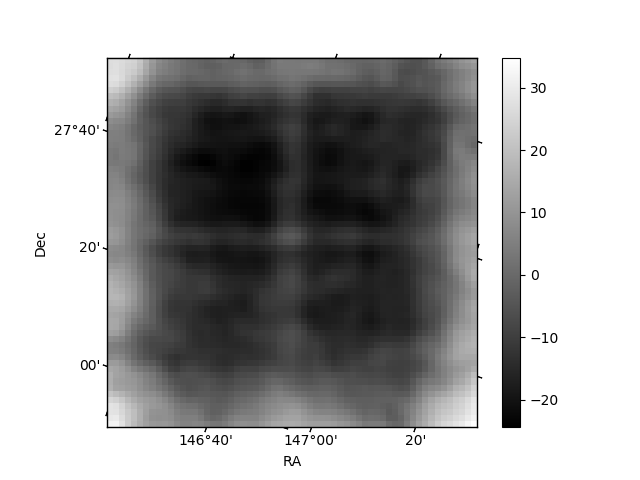
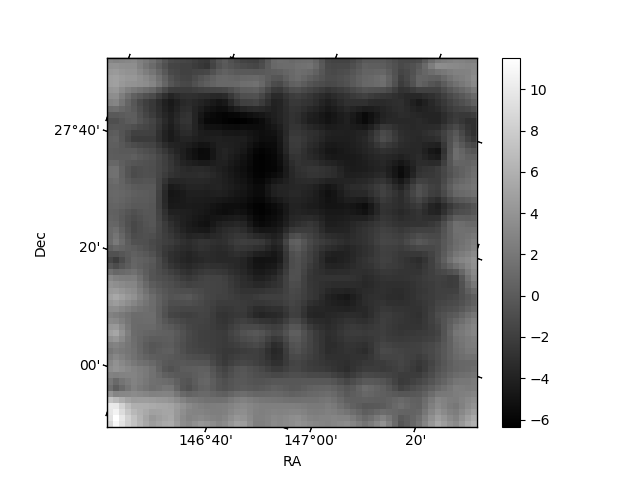
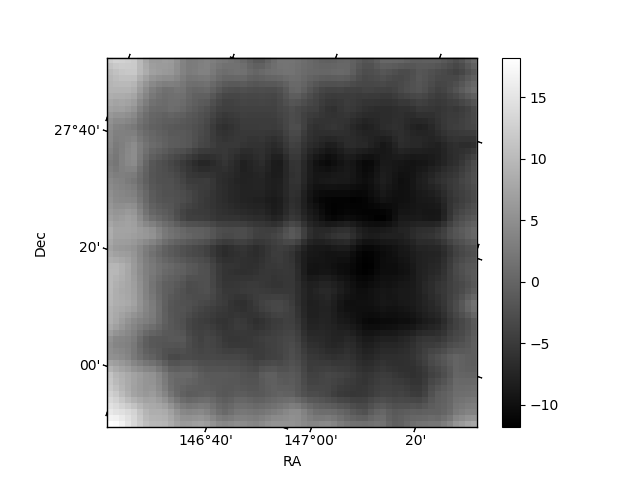
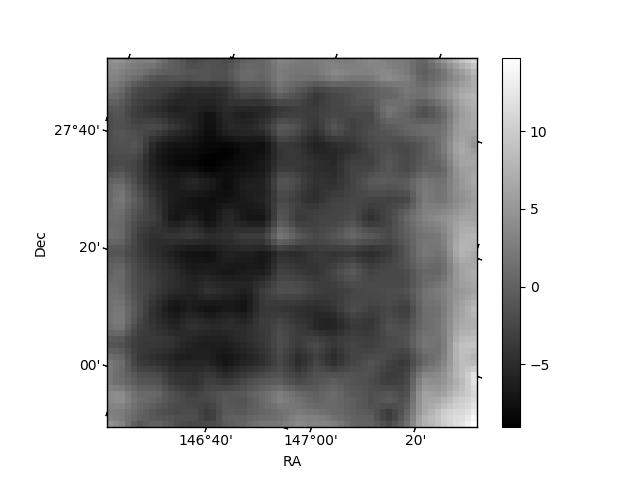
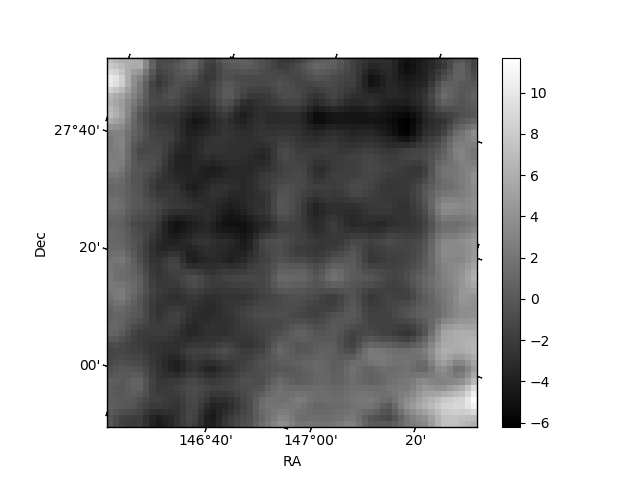
Histogram calculated using DETX and DETY for each event in the final _common_clean file
| Quadrant A | 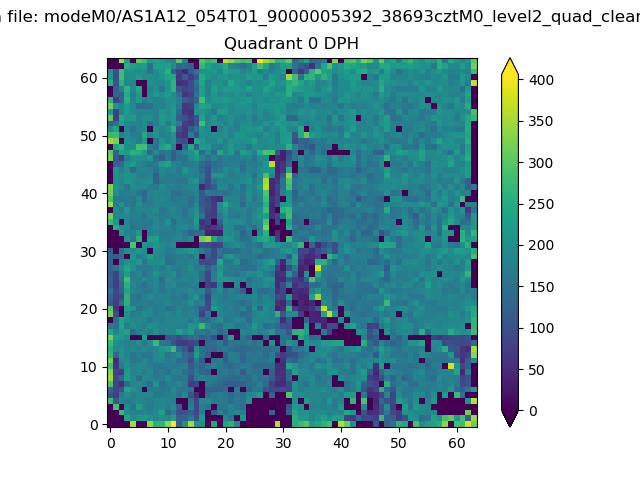 |
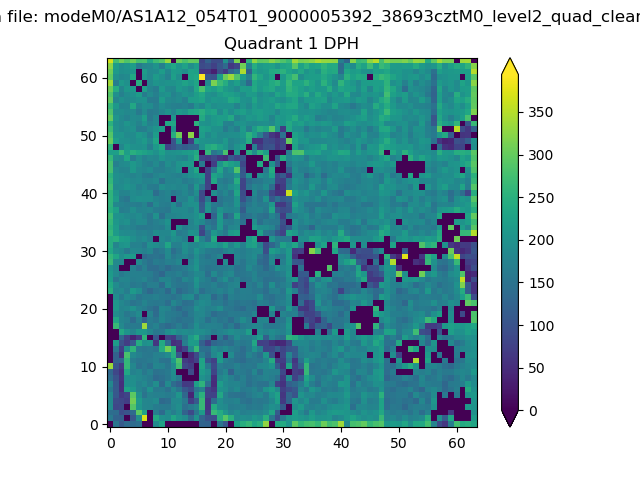 |
Quadrant B |
|---|---|---|---|
| Quadrant D | 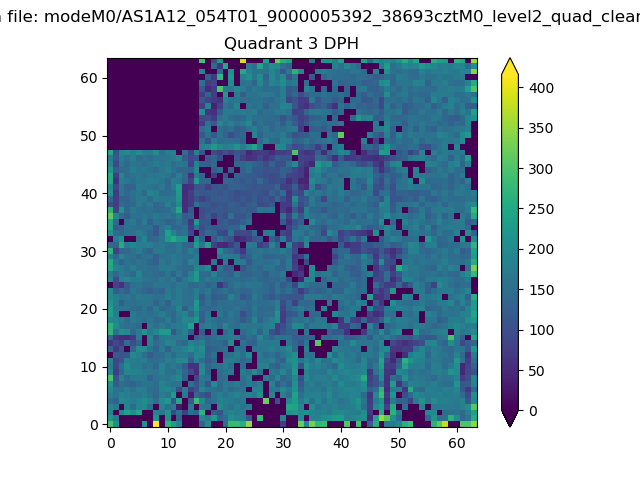 |
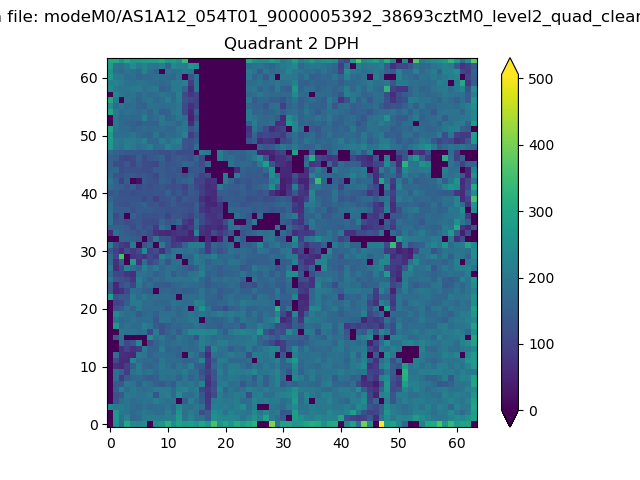 |
Quadrant C |
| Plot type | Count rate plots | Images |
|---|---|---|
| Comparison with Poisson distribution Blue bars denote a histogram of data divided into 1 sec bins. Red curve is a Poisson curve with rate = median count rate of data. |
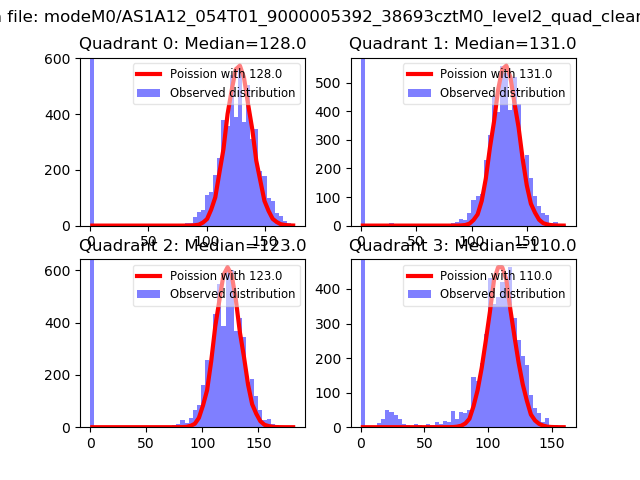 |
 |
| Quadrant-wise count rates Data is divided into 100 sec bins |
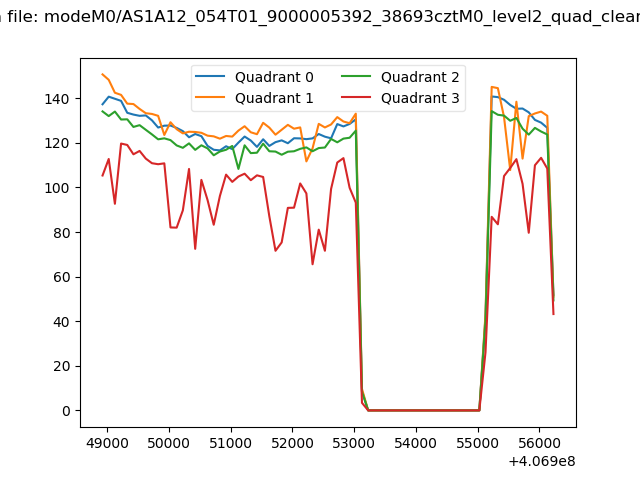 |
|
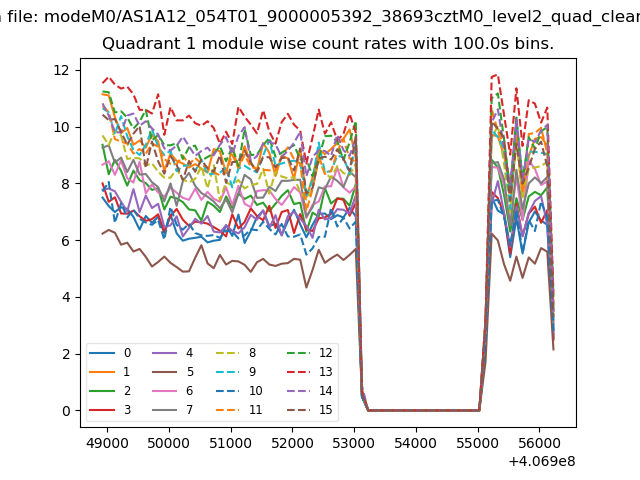
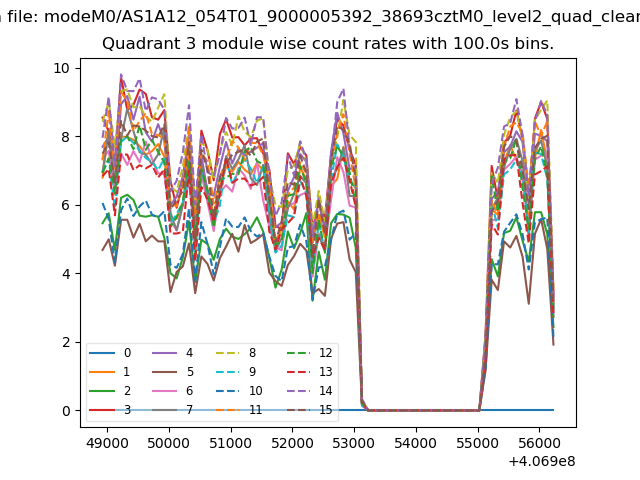
| Module-wise count rates for Quadrant A Data is divided into 100 sec bins |
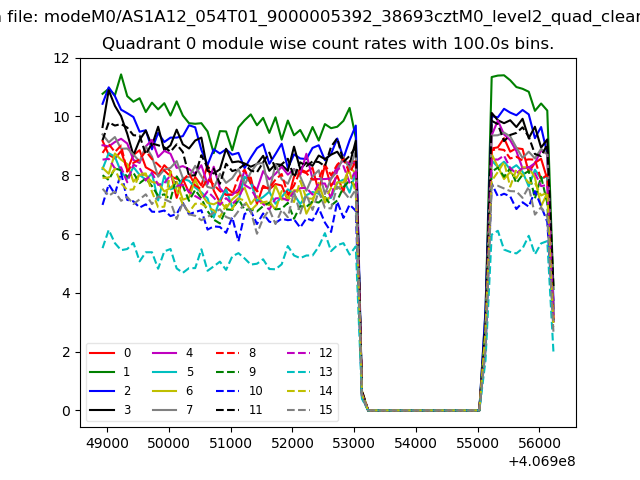 |
 |
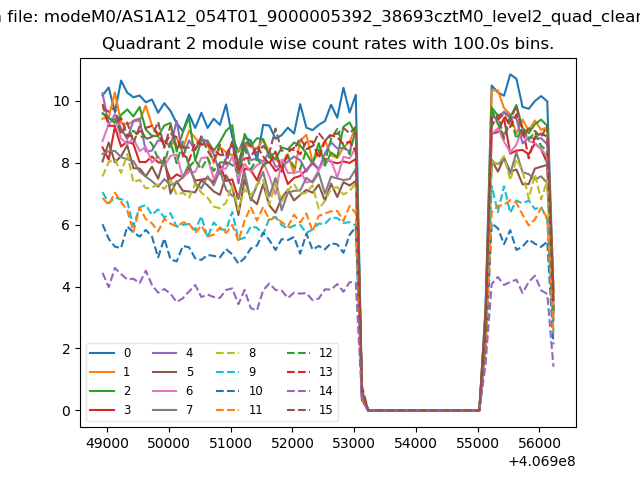
| Module-wise count rates for Quadrant B Data is divided into 100 sec bins |
 |
 |
| Module-wise count rates for Quadrant C Data is divided into 100 sec bins |
 |
 |
| Module-wise count rates for Quadrant D Data is divided into 100 sec bins |
 |
 |
| Parameter | Plot |
|---|---|
| CZT HV Monitor | 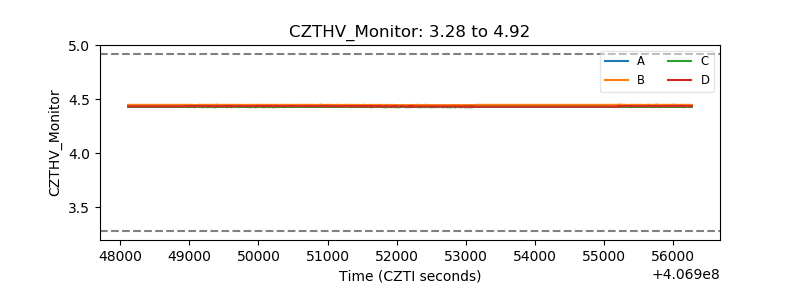 |
| D_VDD | 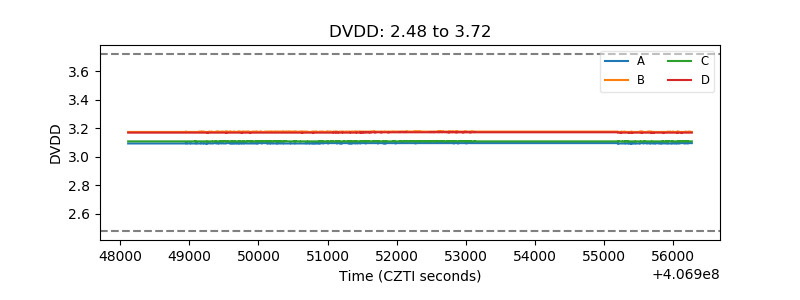 |
| Temperature 1 | 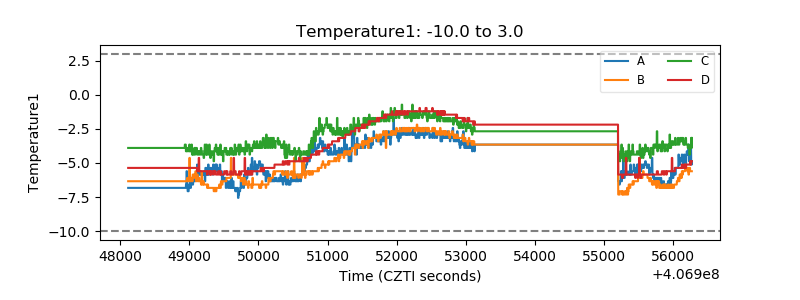 |
| Veto HV Monitor | 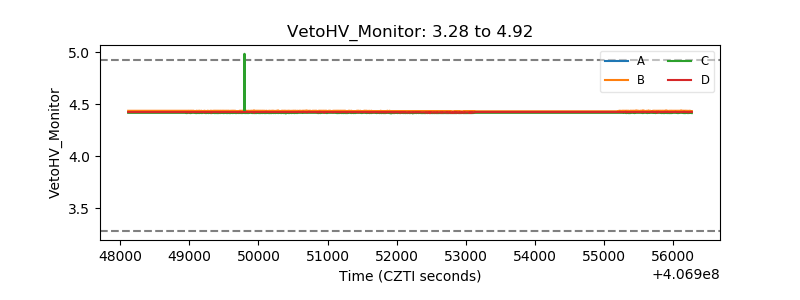 |
| Veto LLD | 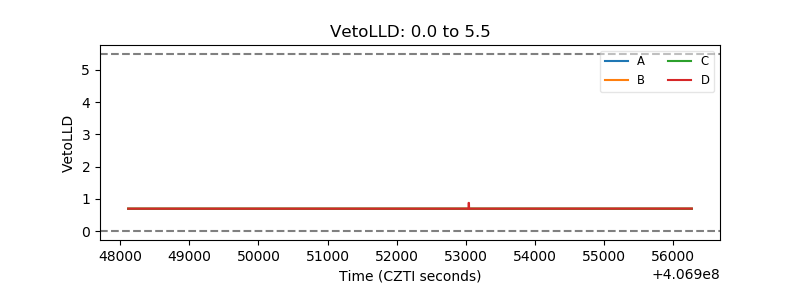 |
| Alpha Counter | 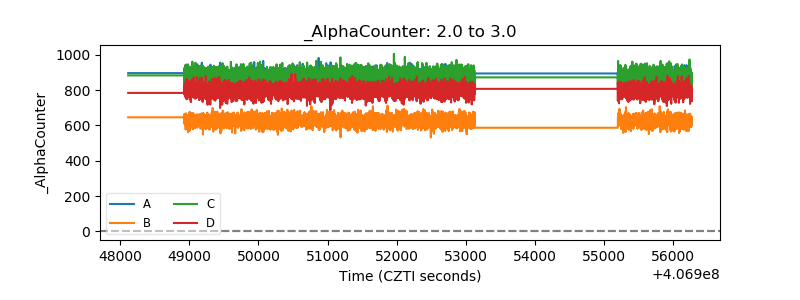 |
| _CPM_Rate | 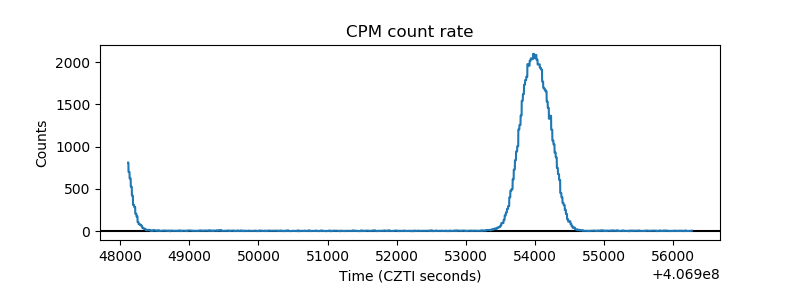 |
| CZT Counter | 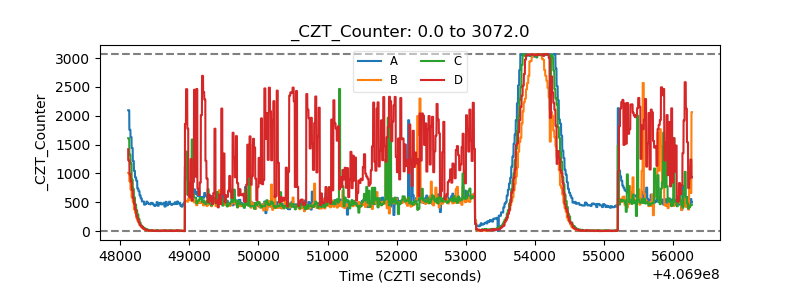 |
| +2.5 Volts monitor | 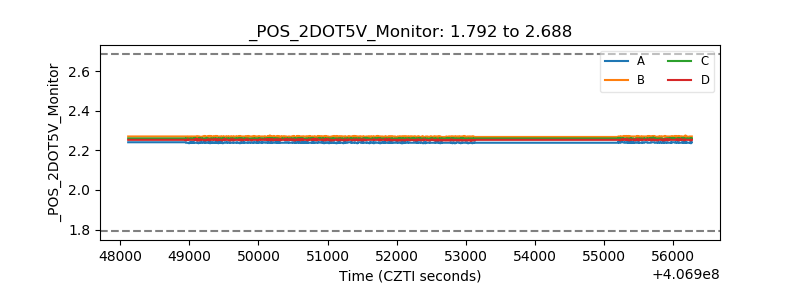 |
| +5 Volts monitor | 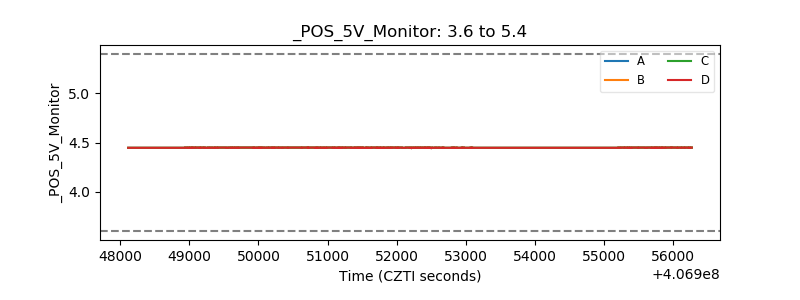 |
| _ROLL_ROT | 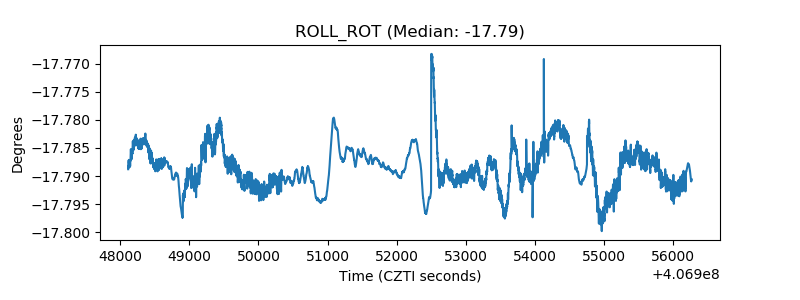 |
| _Roll_DEC | 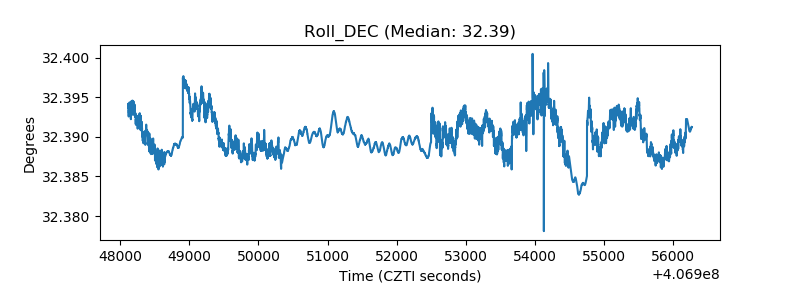 |
| _Roll_RA | 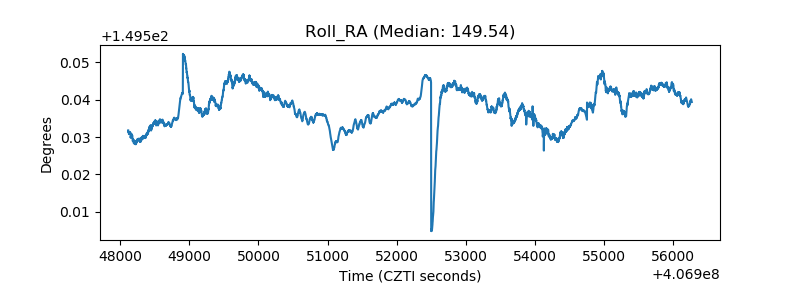 |
| Veto Counter | 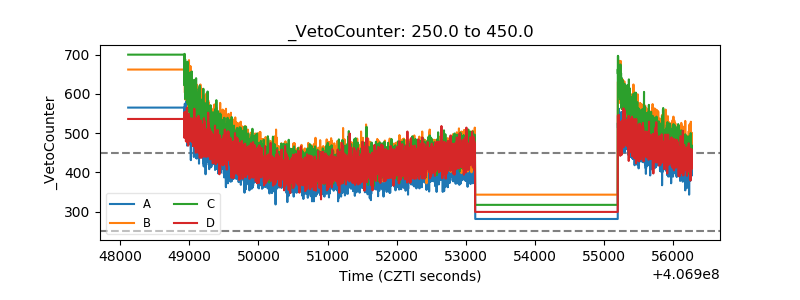 |