| Param | Original file | Final file |
|---|---|---|
| Filename | modeM0/AS1A12_054T01_9000005392_38694cztM0_level2.fits | modeM0/AS1A12_054T01_9000005392_38694cztM0_level2_quad_clean.evt |
| Size (bytes) | 511,130,880 | 84,784,320 |
| Size | 487.5 MB | 80.9 MB |
| Events in quadrant A | 2,788,054 | 635,841 |
| Events in quadrant B | 3,879,794 | 616,690 |
| Events in quadrant C | 2,817,211 | 610,887 |
| Events in quadrant D | 9,044,235 | 351,165 |
| Mode M9 | |||
|---|---|---|---|
| Quadrant | BADHDUFLAG | Total packets | Discarded packets |
| A | 0 | 22 | 0 |
| B | 0 | 22 | 0 |
| C | 0 | 22 | 0 |
| D | 0 | 22 | 0 |
| Mode SS | |||
|---|---|---|---|
| Quadrant | BADHDUFLAG | Total packets | Discarded packets |
| A | 0 | 102 | 0 |
| B | 0 | 102 | 0 |
| C | 0 | 102 | 0 |
| D | 0 | 102 | 0 |
| Mode M0 | |||
|---|---|---|---|
| Quadrant | BADHDUFLAG | Total packets | Discarded packets |
| A | 0 | 11213 | 2 |
| B | 0 | 14821 | 1 |
| C | 0 | 11339 | 1 |
| D | 0 | 30381 | 1 |
| Quadrant | Total seconds | Saturated seconds | Saturation percentage |
|---|---|---|---|
| A | 5032 | 11 | 0.218601% |
| B | 5032 | 387 | 7.690779% |
| C | 5032 | 23 | 0.457075% |
| D | 5032 | 2232 | 44.356121% |
Noise dominated data is calculated using 1-second bins in cleaned event files. If a bin has >2000 counts, and if more than 50% of those come from <1% of pixels, then it is considered to be noise-dominated and hence unusable.
| Quadrant | # 1 sec bins | Bins with >0 counts | Bins with >2000 counts | High rate bins dominated by noise | Noise dominated (total time) | Noise dominated (detector-on time) | Marked lightcurve |
|---|---|---|---|---|---|---|---|
| A | 7185 | 5033 | 6 | 6 | 0.08% | 0.12% | 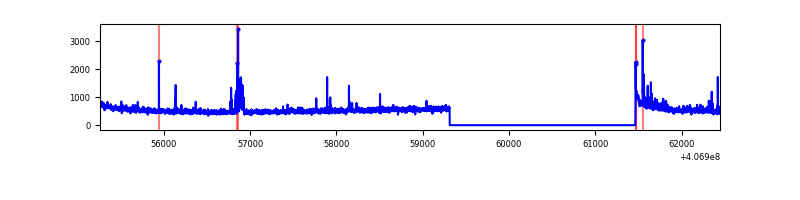 |
| B | 7185 | 5033 | 269 | 269 | 3.74% | 5.34% | 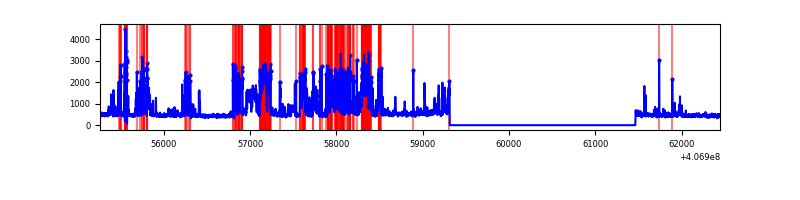 |
| C | 7185 | 5033 | 23 | 23 | 0.32% | 0.46% | 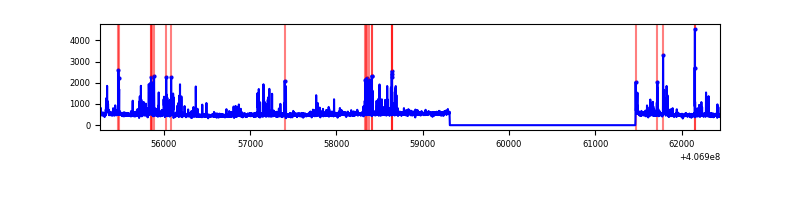 |
| D | 7185 | 5033 | 1984 | 1984 | 27.61% | 39.42% | 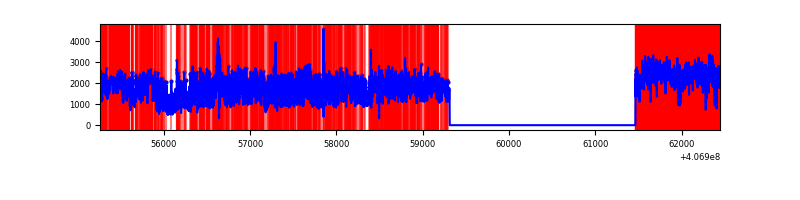 |
Top three noisy pixels from each quadrant. If the there are fewer than three noisy pixels in the level2.evt file, extra rows are filled as -1
| Pixel properties | Quadrant properties | ||||||
|---|---|---|---|---|---|---|---|
| Quadrant | DetID | PixID | Counts | Sigma | Mean | Median | Sigma |
| A | 10 | 83 | 357031 | 3003.25 | 593 | 583 | 118.7 |
| A | 13 | 248 | 118505 | 993.55 | 593 | 583 | 118.7 |
| A | 13 | 6 | 9617 | 76.12 | 593 | 583 | 118.7 |
| B | 4 | 171 | 1568816 | 14301.97 | 575 | 561 | 109.7 |
| B | 12 | 111 | 13164 | 114.93 | 575 | 561 | 109.7 |
| B | 11 | 111 | 12343 | 107.44 | 575 | 561 | 109.7 |
| C | 14 | 254 | 304629 | 2290.78 | 572 | 576 | 132.7 |
| C | 15 | 214 | 207586 | 1559.65 | 572 | 576 | 132.7 |
| C | 2 | 16 | 52260 | 389.4 | 572 | 576 | 132.7 |
| D | 2 | 16 | 6628687 | 54306.77 | 499 | 487 | 122.1 |
| D | 12 | 227 | 139198 | 1136.5 | 499 | 487 | 122.1 |
| D | 2 | 249 | 85034 | 692.72 | 499 | 487 | 122.1 |
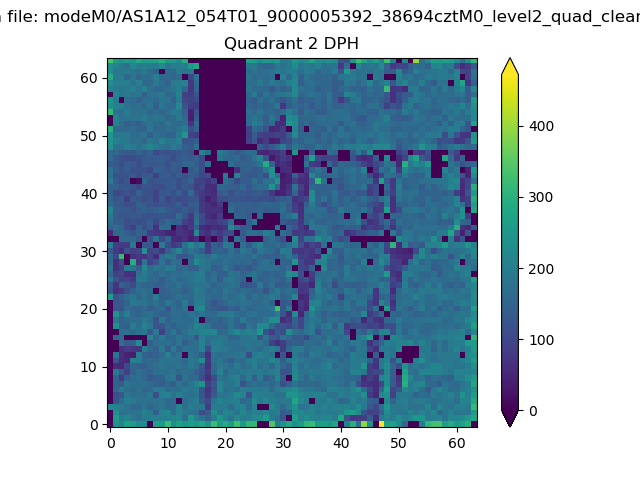
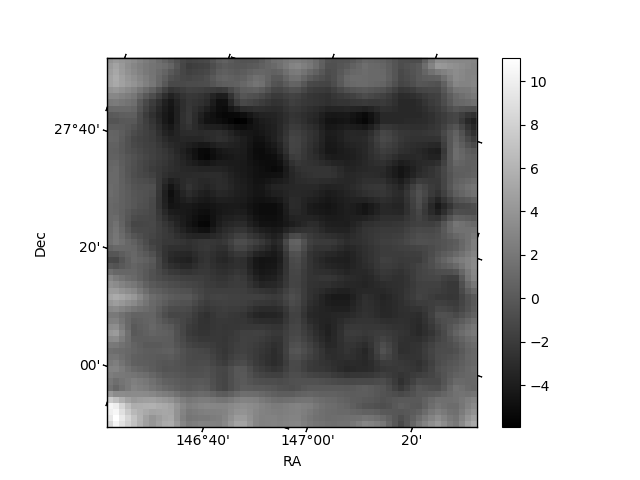
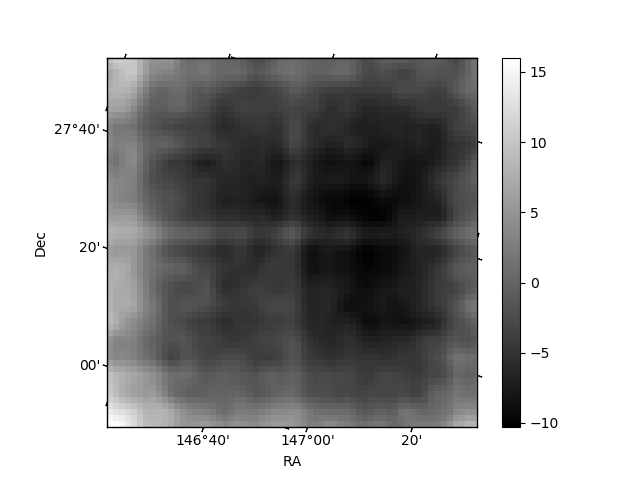
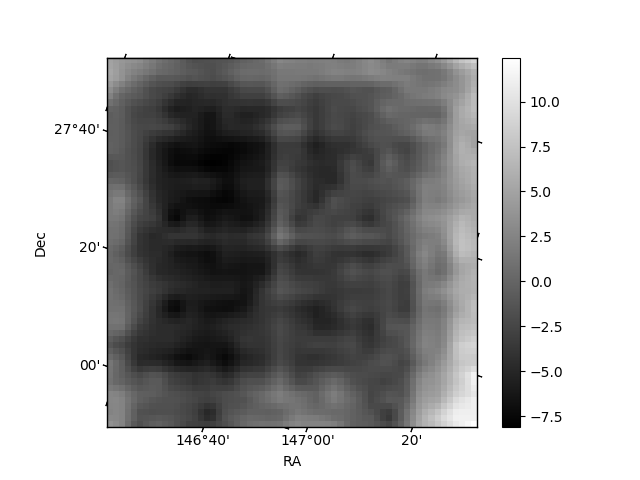
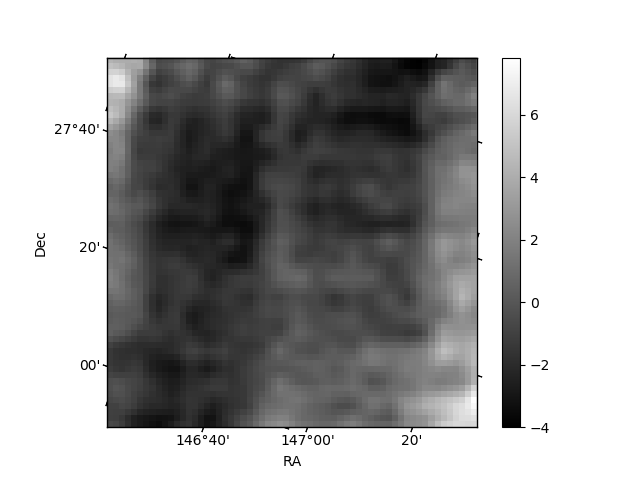
Histogram calculated using DETX and DETY for each event in the final _common_clean file
| Quadrant A | 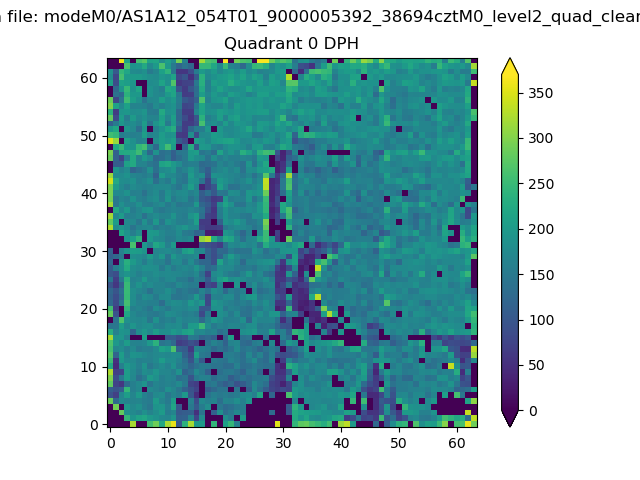 |
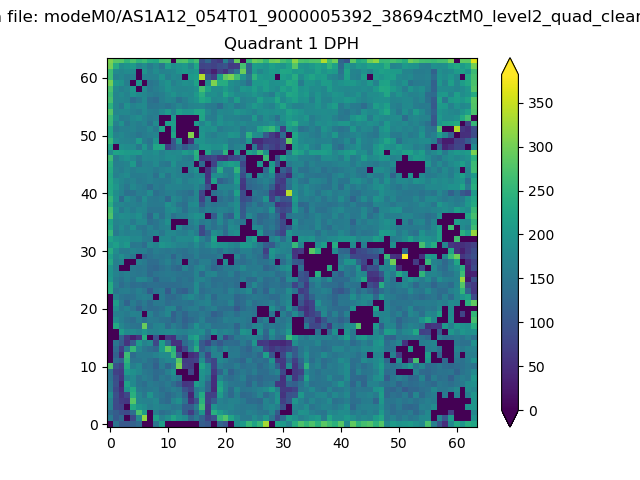 |
Quadrant B |
|---|---|---|---|
| Quadrant D | 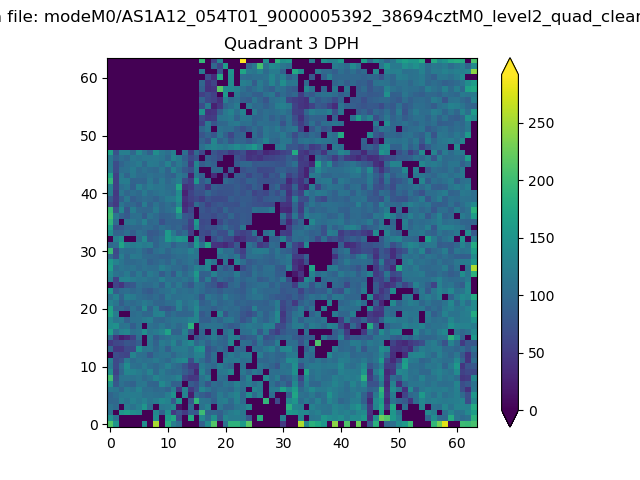 |
 |
Quadrant C |
| Plot type | Count rate plots | Images |
|---|---|---|
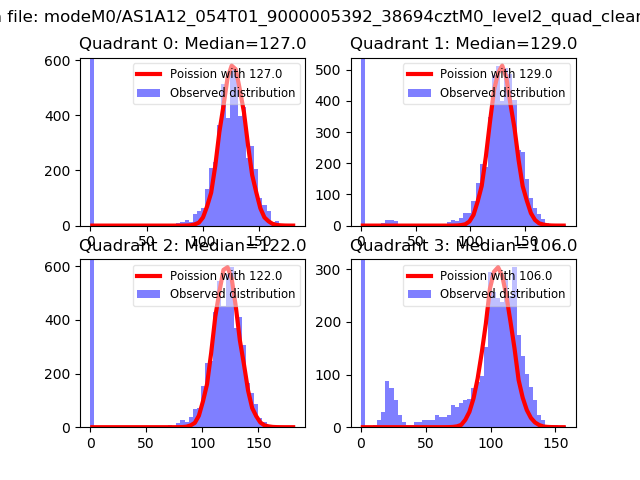
| Comparison with Poisson distribution Blue bars denote a histogram of data divided into 1 sec bins. Red curve is a Poisson curve with rate = median count rate of data. |
 |
 |
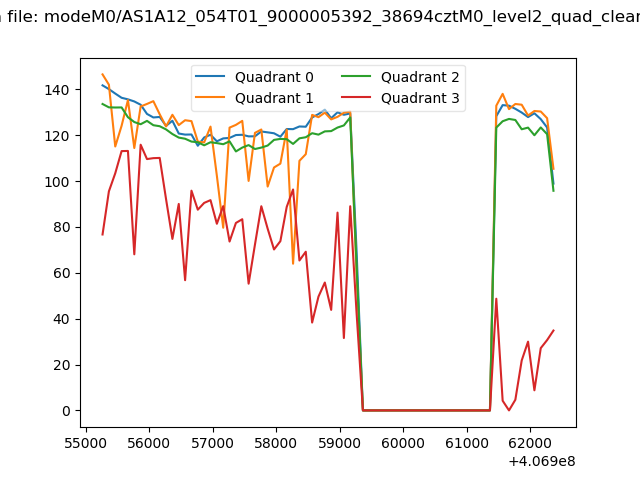
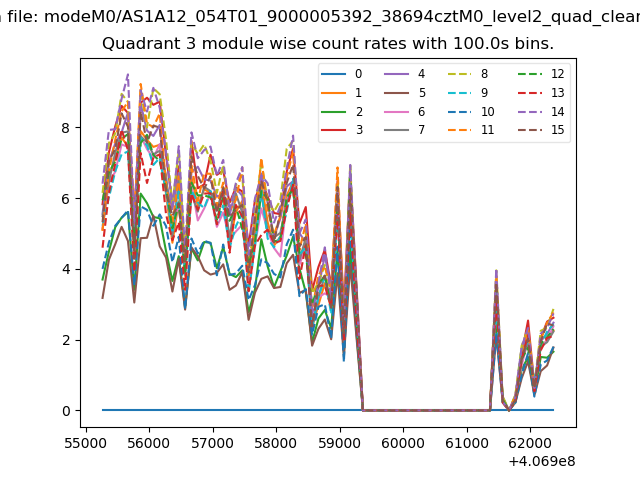
| Quadrant-wise count rates Data is divided into 100 sec bins |
 |
|
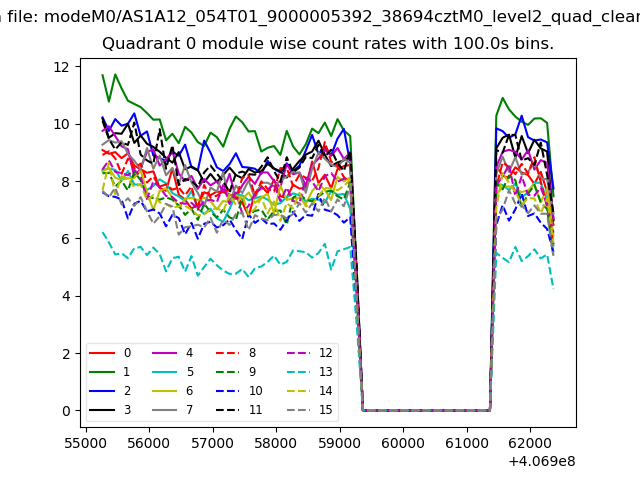
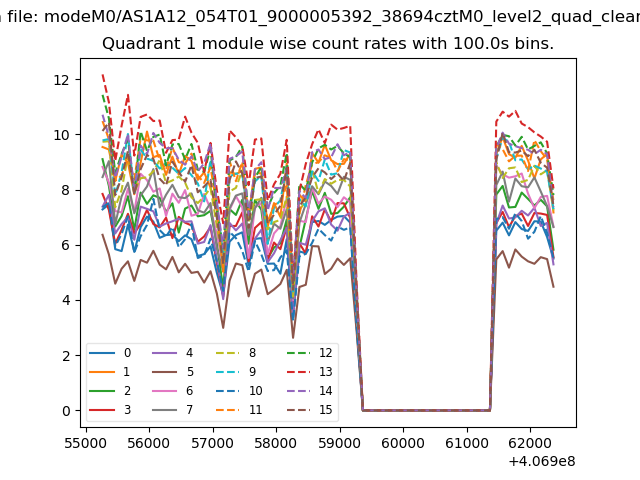
| Module-wise count rates for Quadrant A Data is divided into 100 sec bins |
 |
 |
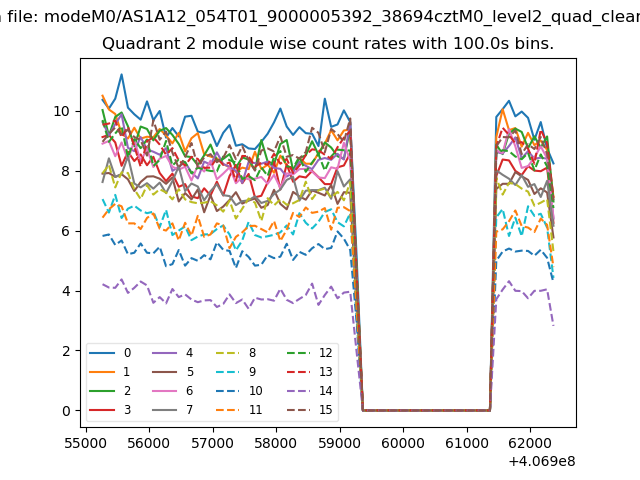
| Module-wise count rates for Quadrant B Data is divided into 100 sec bins |
 |
 |
| Module-wise count rates for Quadrant C Data is divided into 100 sec bins |
 |
 |
| Module-wise count rates for Quadrant D Data is divided into 100 sec bins |
 |
 |
| Parameter | Plot |
|---|---|
| CZT HV Monitor | 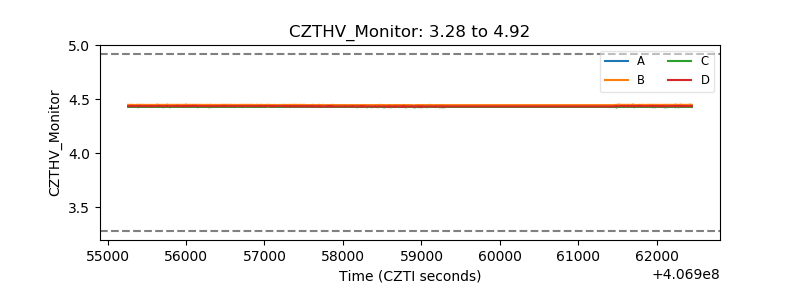 |
| D_VDD | 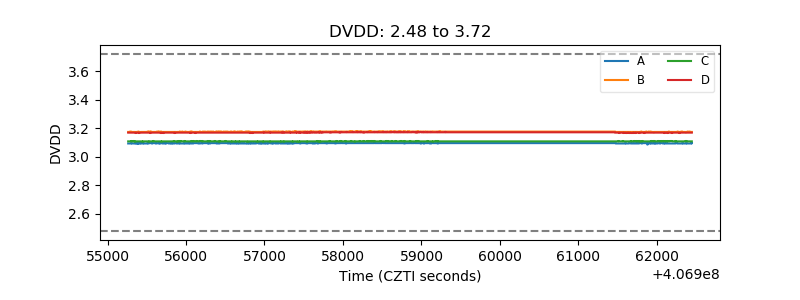 |
| Temperature 1 | 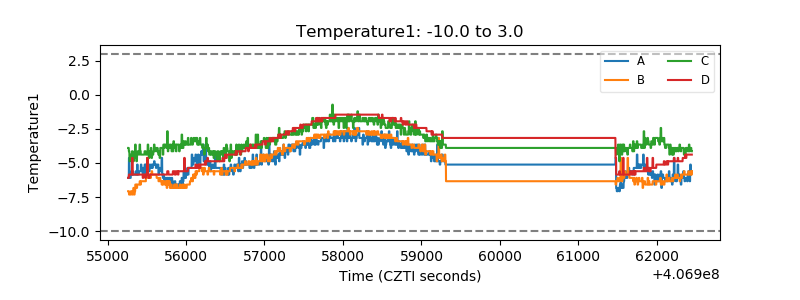 |
| Veto HV Monitor | 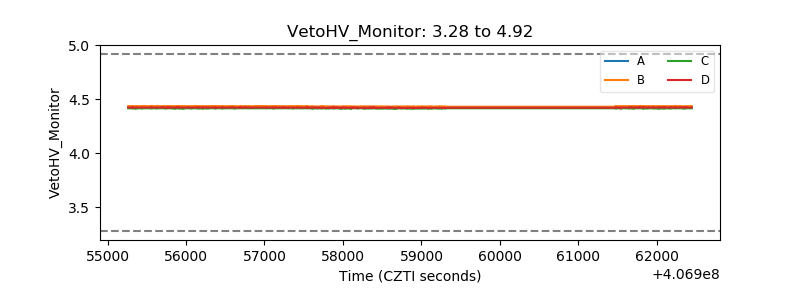 |
| Veto LLD | 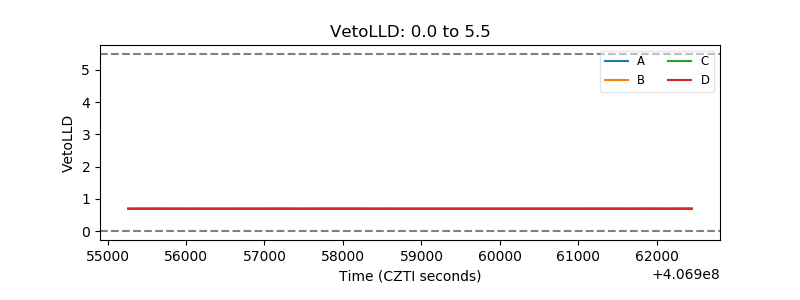 |
| Alpha Counter | 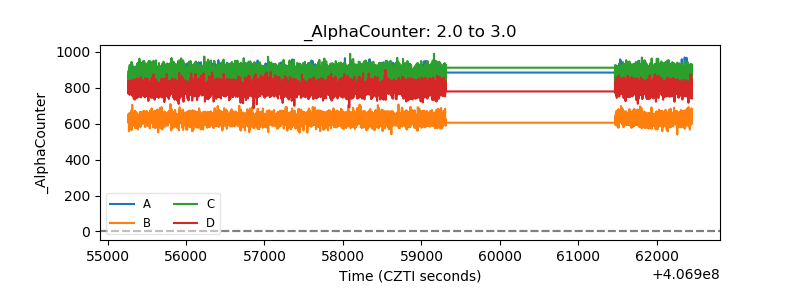 |
| _CPM_Rate | 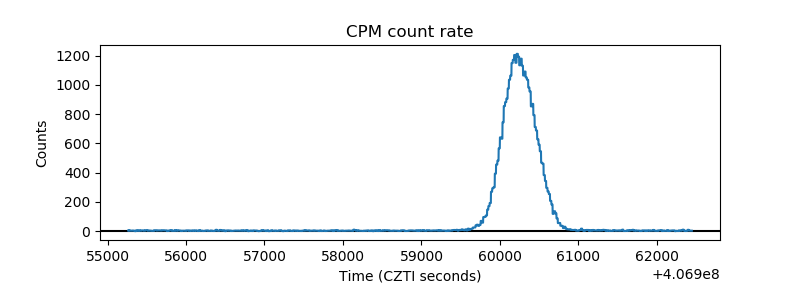 |
| CZT Counter | 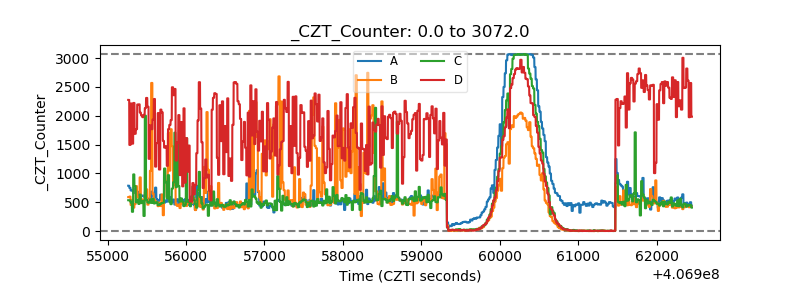 |
| +2.5 Volts monitor | 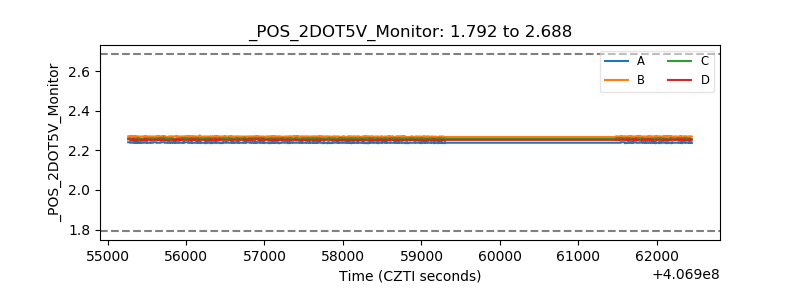 |
| +5 Volts monitor | 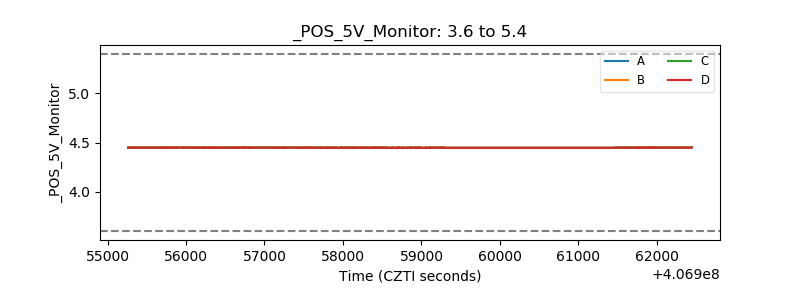 |
| _ROLL_ROT | 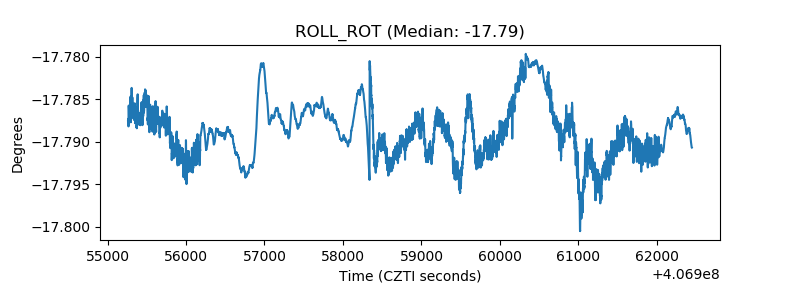 |
| _Roll_DEC | 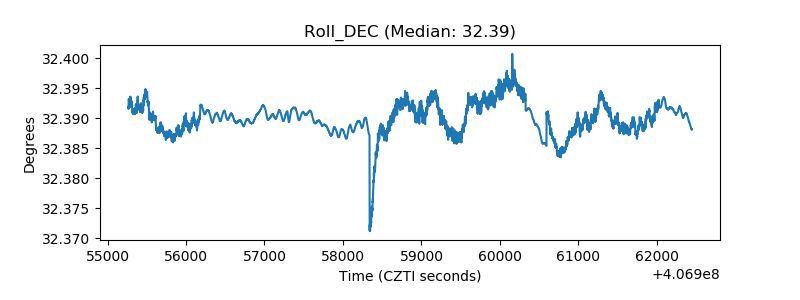 |
| _Roll_RA | 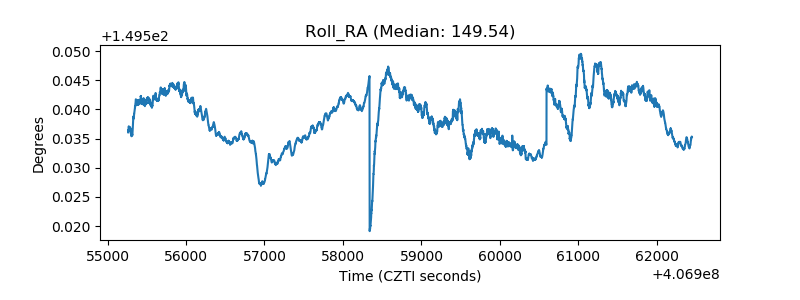 |
| Veto Counter | 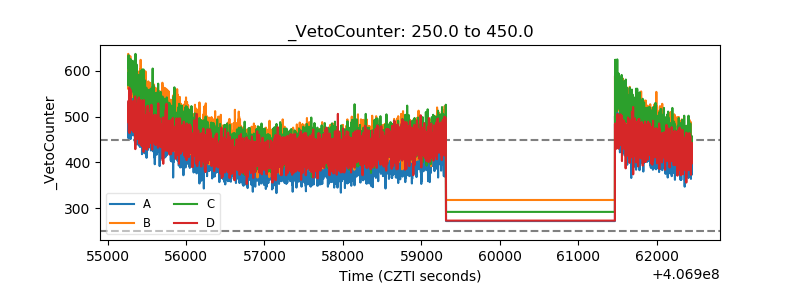 |