| Param | Original file | Final file |
|---|---|---|
| Filename | modeM0/AS1A12_054T01_9000005392_38695cztM0_level2.fits | modeM0/AS1A12_054T01_9000005392_38695cztM0_level2_quad_clean.evt |
| Size (bytes) | 453,208,320 | 74,845,440 |
| Size | 432.2 MB | 71.4 MB |
| Events in quadrant A | 2,502,391 | 580,414 |
| Events in quadrant B | 2,399,021 | 591,874 |
| Events in quadrant C | 2,594,489 | 555,883 |
| Events in quadrant D | 8,909,195 | 204,068 |
| Mode M9 | |||
|---|---|---|---|
| Quadrant | BADHDUFLAG | Total packets | Discarded packets |
| A | 0 | 21 | 0 |
| B | 0 | 21 | 0 |
| C | 0 | 21 | 0 |
| D | 0 | 21 | 0 |
| Mode SS | |||
|---|---|---|---|
| Quadrant | BADHDUFLAG | Total packets | Discarded packets |
| A | 0 | 98 | 0 |
| B | 0 | 98 | 0 |
| C | 0 | 98 | 0 |
| D | 0 | 98 | 0 |
| Mode M0 | |||
|---|---|---|---|
| Quadrant | BADHDUFLAG | Total packets | Discarded packets |
| A | 0 | 10123 | 2 |
| B | 0 | 10164 | 1 |
| C | 0 | 10725 | 1 |
| D | 0 | 29721 | 1 |
| Quadrant | Total seconds | Saturated seconds | Saturation percentage |
|---|---|---|---|
| A | 4758 | 6 | 0.126103% |
| B | 4758 | 27 | 0.567465% |
| C | 4758 | 14 | 0.294241% |
| D | 4758 | 3073 | 64.585960% |
Noise dominated data is calculated using 1-second bins in cleaned event files. If a bin has >2000 counts, and if more than 50% of those come from <1% of pixels, then it is considered to be noise-dominated and hence unusable.
| Quadrant | # 1 sec bins | Bins with >0 counts | Bins with >2000 counts | High rate bins dominated by noise | Noise dominated (total time) | Noise dominated (detector-on time) | Marked lightcurve |
|---|---|---|---|---|---|---|---|
| A | 6880 | 4759 | 3 | 3 | 0.04% | 0.06% | 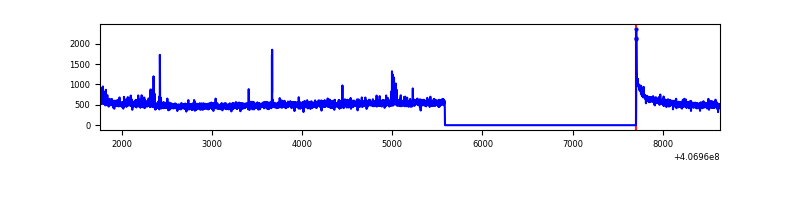 |
| B | 6880 | 4759 | 8 | 8 | 0.12% | 0.17% | 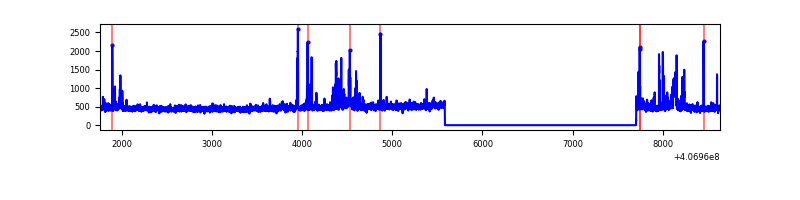 |
| C | 6880 | 4759 | 7 | 7 | 0.10% | 0.15% | 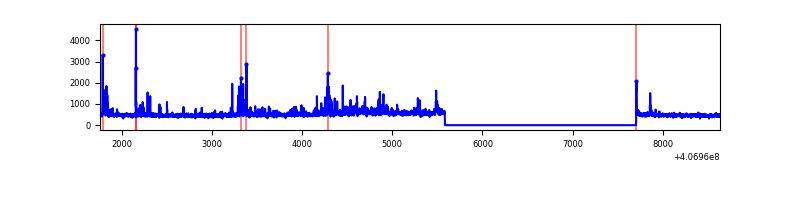 |
| D | 6880 | 4759 | 2755 | 2755 | 40.04% | 57.89% | 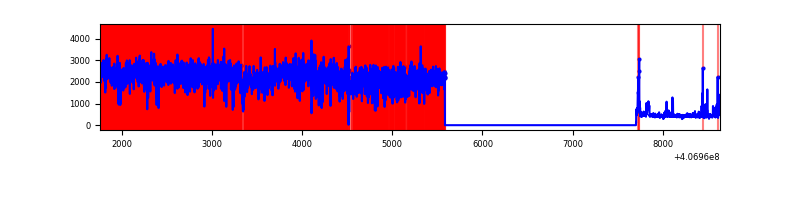 |
Top three noisy pixels from each quadrant. If the there are fewer than three noisy pixels in the level2.evt file, extra rows are filled as -1
| Pixel properties | Quadrant properties | ||||||
|---|---|---|---|---|---|---|---|
| Quadrant | DetID | PixID | Counts | Sigma | Mean | Median | Sigma |
| A | 10 | 83 | 306672 | 2740.24 | 556 | 545 | 111.7 |
| A | 13 | 248 | 43354 | 383.2 | 556 | 545 | 111.7 |
| A | 13 | 254 | 7154 | 59.16 | 556 | 545 | 111.7 |
| B | 4 | 171 | 183100 | 1727.16 | 548 | 533 | 105.7 |
| B | 12 | 111 | 12906 | 117.05 | 548 | 533 | 105.7 |
| B | 0 | 230 | 12892 | 116.92 | 548 | 533 | 105.7 |
| C | 15 | 214 | 192679 | 1549.95 | 535 | 539 | 124.0 |
| C | 14 | 254 | 171230 | 1376.92 | 535 | 539 | 124.0 |
| C | 3 | 110 | 73584 | 589.24 | 535 | 539 | 124.0 |
| D | 2 | 16 | 6749433 | 64075.56 | 434 | 421 | 105.3 |
| D | 5 | 222 | 144516 | 1368.05 | 434 | 421 | 105.3 |
| D | 12 | 227 | 92053 | 869.96 | 434 | 421 | 105.3 |
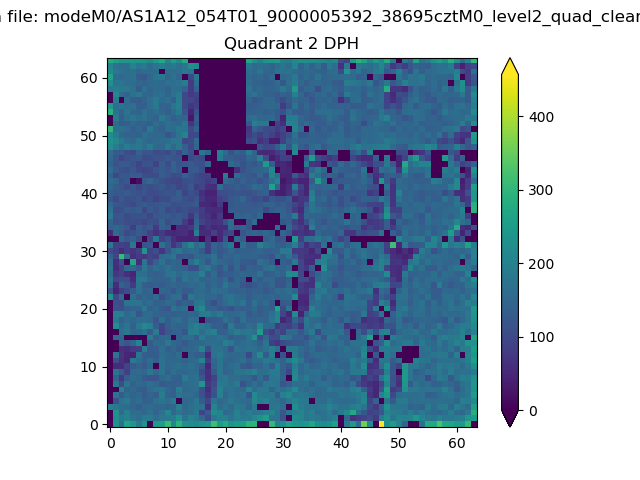
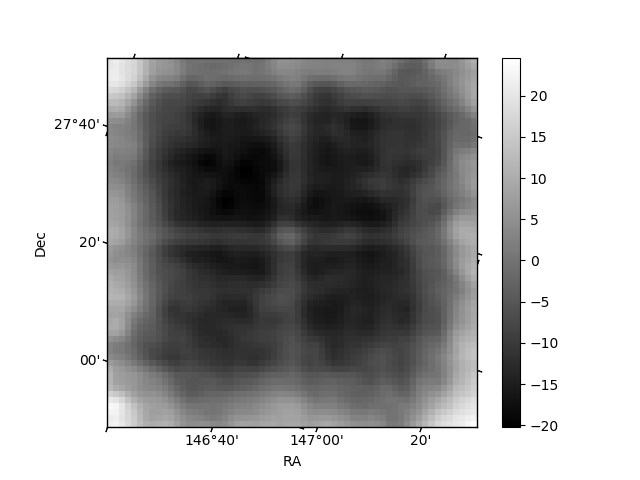
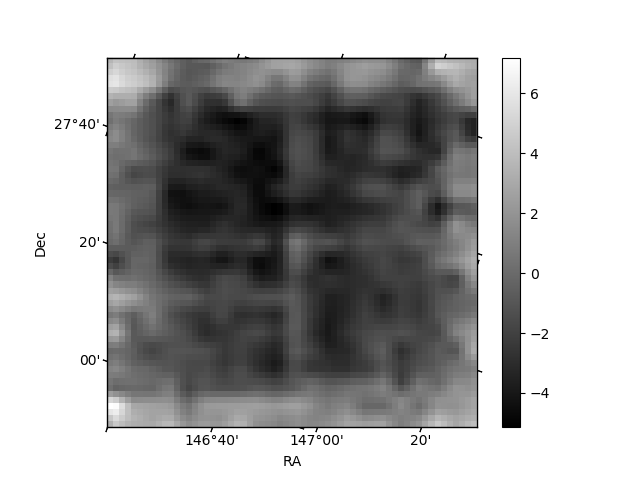
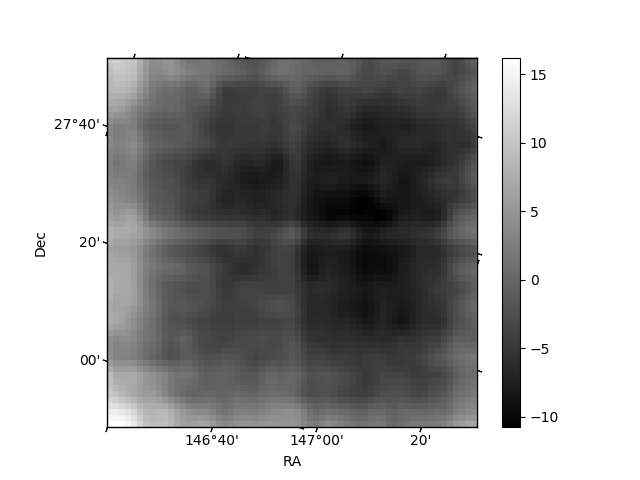
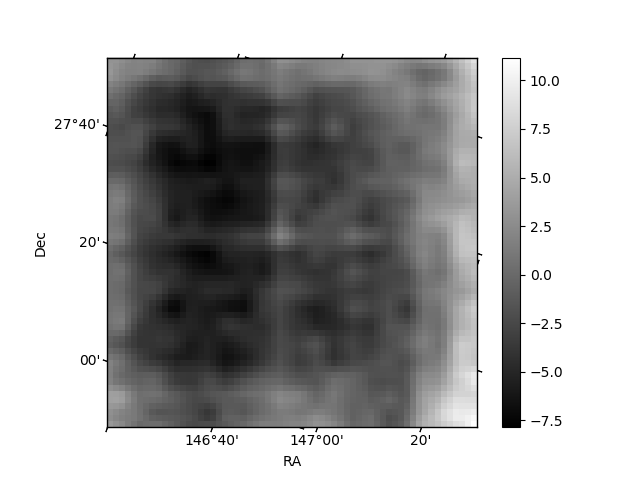
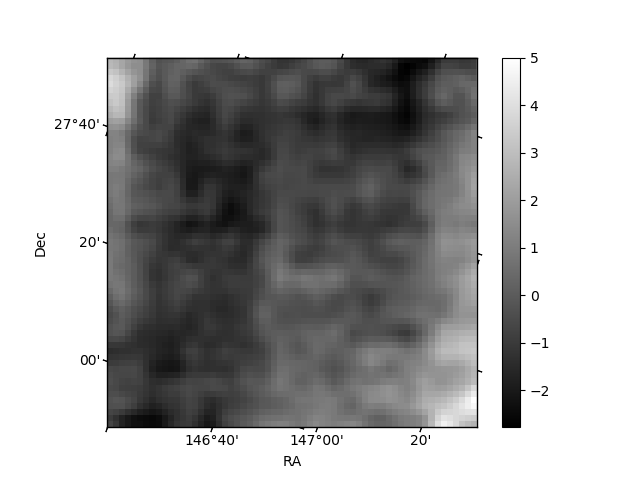
Histogram calculated using DETX and DETY for each event in the final _common_clean file
| Quadrant A | 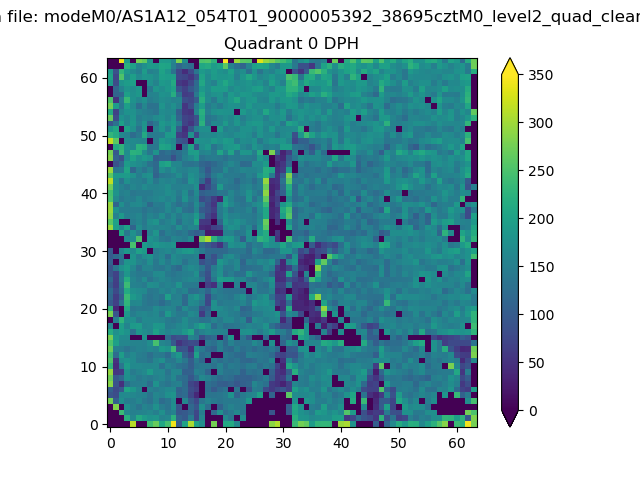 |
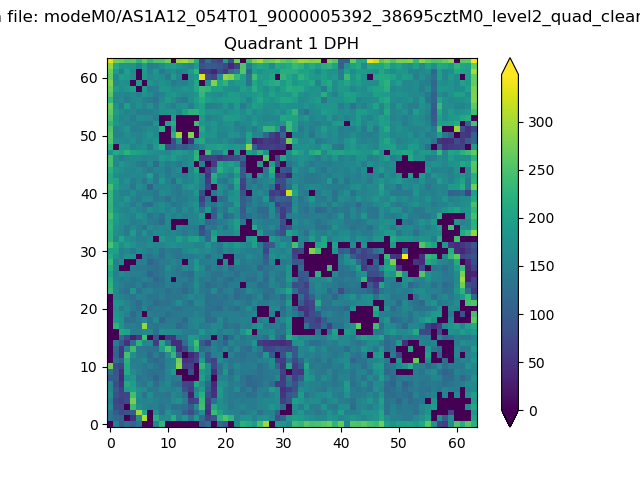 |
Quadrant B |
|---|---|---|---|
| Quadrant D | 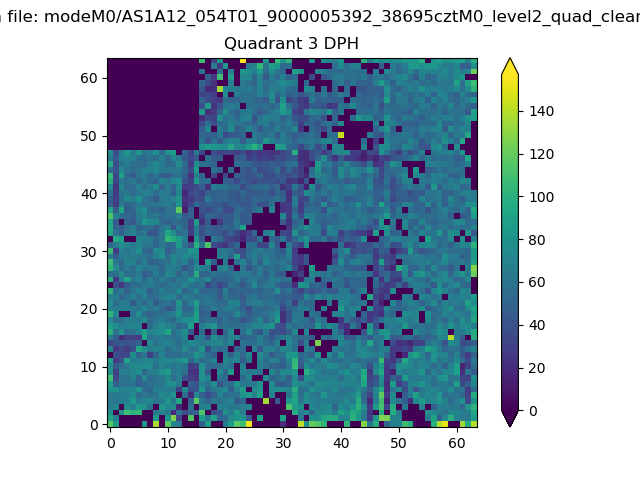 |
 |
Quadrant C |
| Plot type | Count rate plots | Images |
|---|---|---|
| Comparison with Poisson distribution Blue bars denote a histogram of data divided into 1 sec bins. Red curve is a Poisson curve with rate = median count rate of data. |
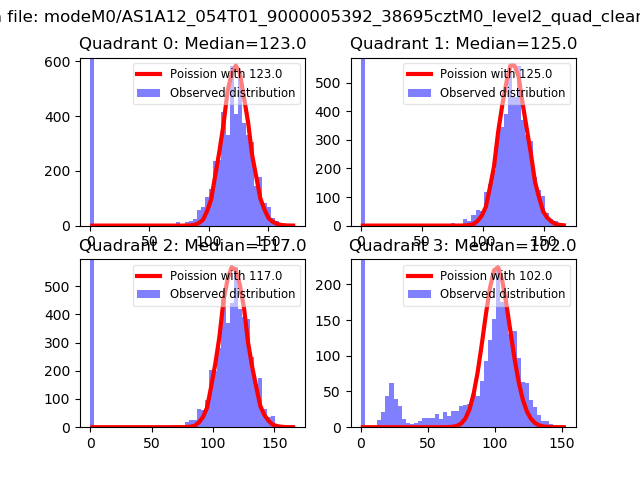 |
 |
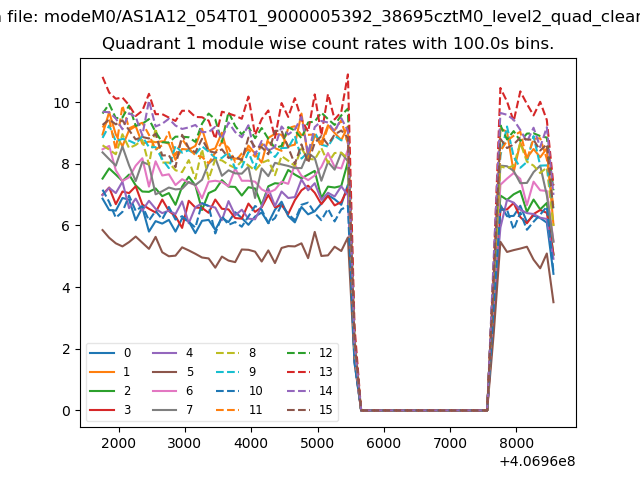
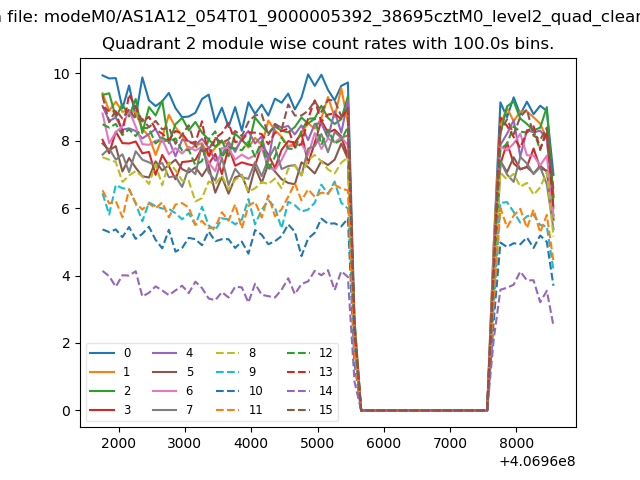
| Quadrant-wise count rates Data is divided into 100 sec bins |
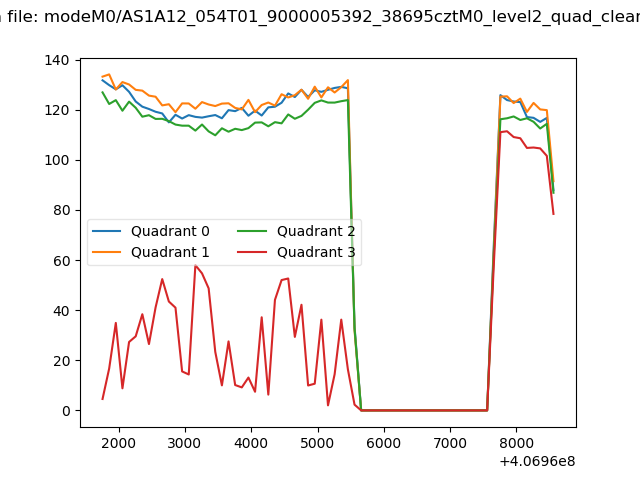 |
|
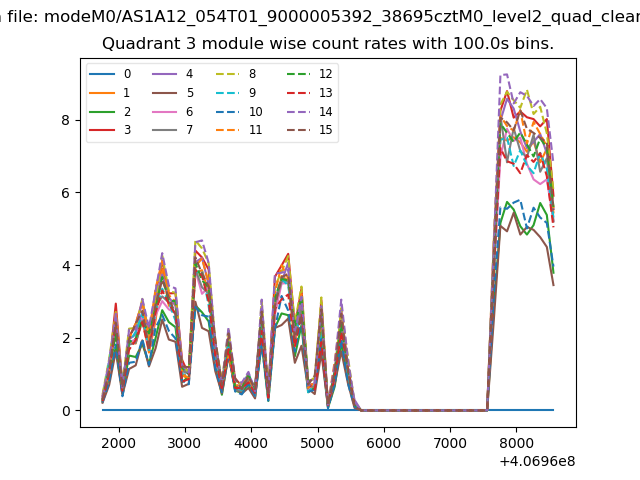
| Module-wise count rates for Quadrant A Data is divided into 100 sec bins |
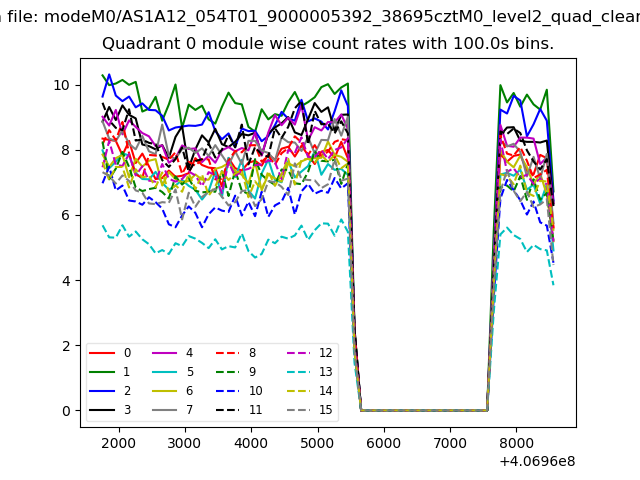 |
 |
| Module-wise count rates for Quadrant B Data is divided into 100 sec bins |
 |
 |
| Module-wise count rates for Quadrant C Data is divided into 100 sec bins |
 |
 |
| Module-wise count rates for Quadrant D Data is divided into 100 sec bins |
 |
 |
| Parameter | Plot |
|---|---|
| CZT HV Monitor |  |
| D_VDD | 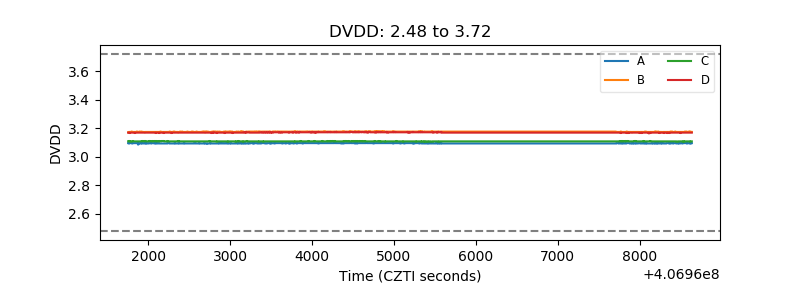 |
| Temperature 1 | 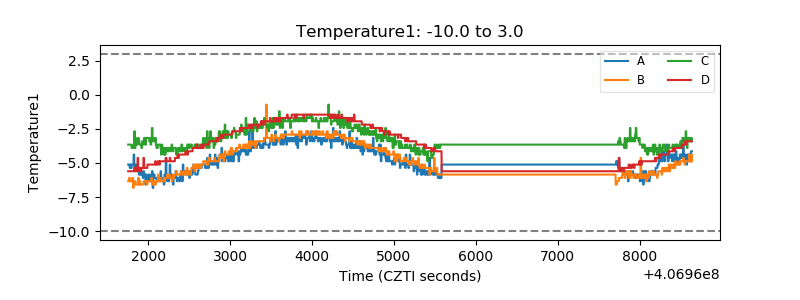 |
| Veto HV Monitor | 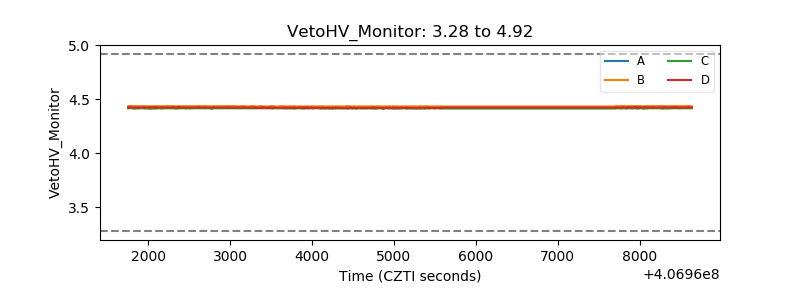 |
| Veto LLD | 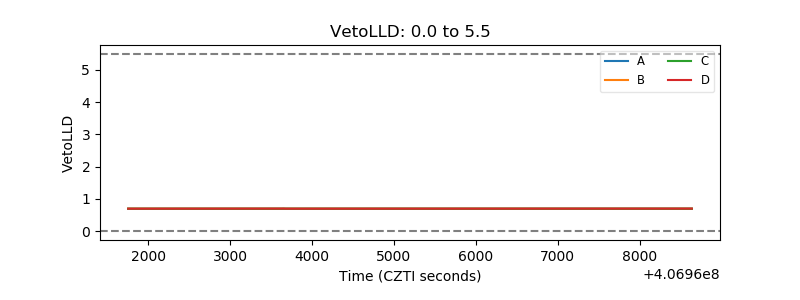 |
| Alpha Counter | 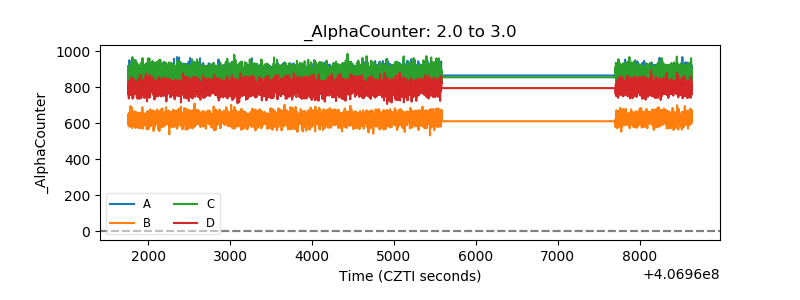 |
| _CPM_Rate | 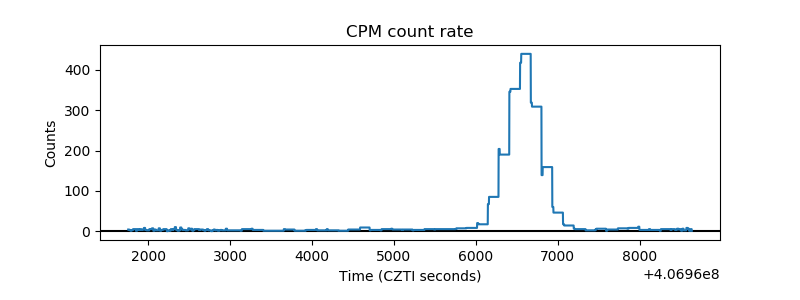 |
| CZT Counter | 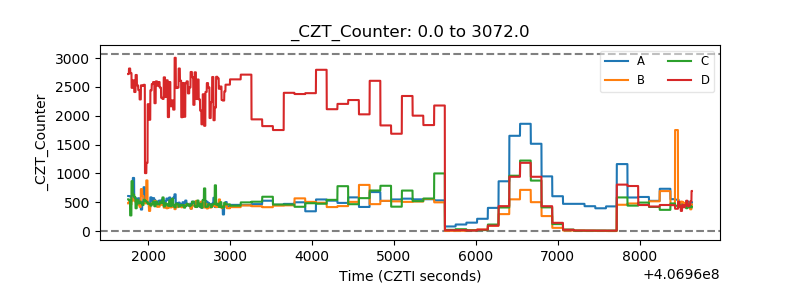 |
| +2.5 Volts monitor | 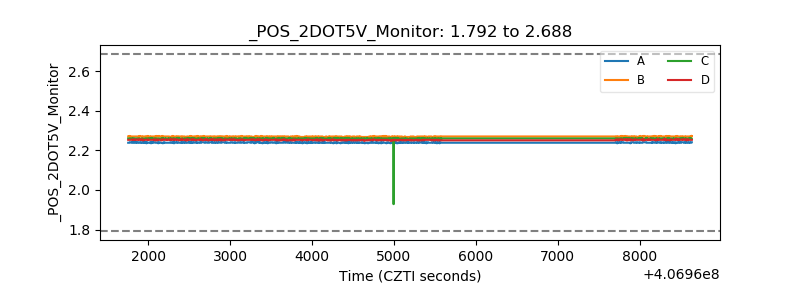 |
| +5 Volts monitor |  |
| _ROLL_ROT | 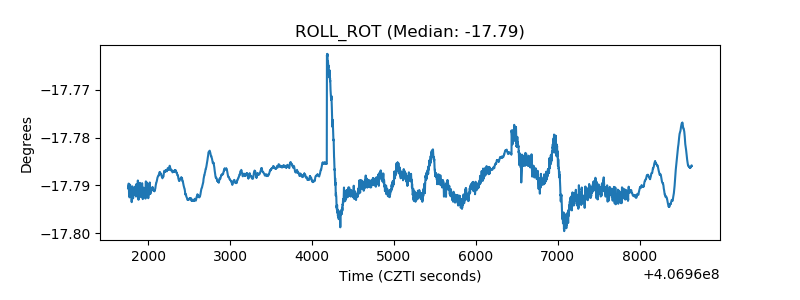 |
| _Roll_DEC | 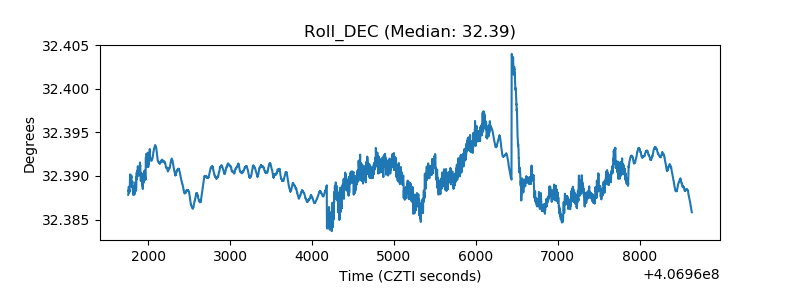 |
| _Roll_RA | 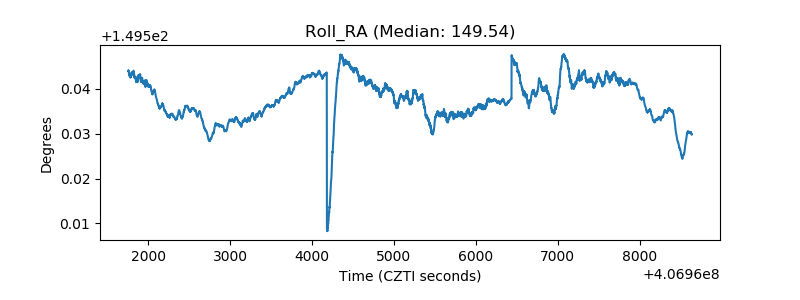 |
| Veto Counter | 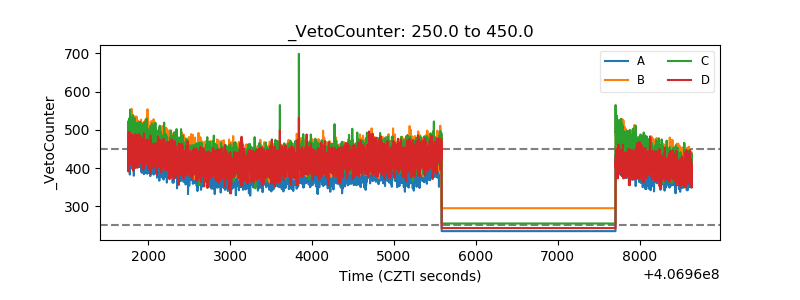 |