| Param | Original file | Final file |
|---|---|---|
| Filename | modeM0/AS1A12_054T01_9000005392_38696cztM0_level2.fits | modeM0/AS1A12_054T01_9000005392_38696cztM0_level2_quad_clean.evt |
| Size (bytes) | 351,547,200 | 86,935,680 |
| Size | 335.3 MB | 82.9 MB |
| Events in quadrant A | 2,727,422 | 597,383 |
| Events in quadrant B | 2,862,875 | 605,723 |
| Events in quadrant C | 2,746,299 | 572,907 |
| Events in quadrant D | 4,278,429 | 498,115 |
| Mode M9 | |||
|---|---|---|---|
| Quadrant | BADHDUFLAG | Total packets | Discarded packets |
| A | 0 | 28 | 0 |
| B | 0 | 28 | 0 |
| C | 0 | 28 | 0 |
| D | 0 | 29 | 0 |
| Mode SS | |||
|---|---|---|---|
| Quadrant | BADHDUFLAG | Total packets | Discarded packets |
| A | 0 | 104 | 0 |
| B | 0 | 104 | 0 |
| C | 0 | 104 | 0 |
| D | 0 | 104 | 0 |
| Mode M0 | |||
|---|---|---|---|
| Quadrant | BADHDUFLAG | Total packets | Discarded packets |
| A | 0 | 10995 | 3 |
| B | 0 | 11913 | 2 |
| C | 0 | 11190 | 2 |
| D | 0 | 16129 | 2 |
| Quadrant | Total seconds | Saturated seconds | Saturation percentage |
|---|---|---|---|
| A | 5113 | 11 | 0.215138% |
| B | 5113 | 103 | 2.014473% |
| C | 5113 | 50 | 0.977899% |
| D | 5113 | 486 | 9.505183% |
Noise dominated data is calculated using 1-second bins in cleaned event files. If a bin has >2000 counts, and if more than 50% of those come from <1% of pixels, then it is considered to be noise-dominated and hence unusable.
| Quadrant | # 1 sec bins | Bins with >0 counts | Bins with >2000 counts | High rate bins dominated by noise | Noise dominated (total time) | Noise dominated (detector-on time) | Marked lightcurve |
|---|---|---|---|---|---|---|---|
| A | 7086 | 5114 | 7 | 7 | 0.10% | 0.14% | 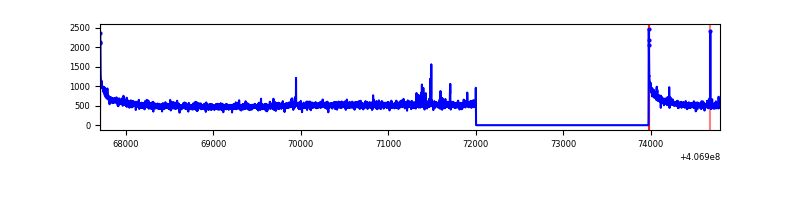 |
| B | 7086 | 5114 | 44 | 44 | 0.62% | 0.86% | 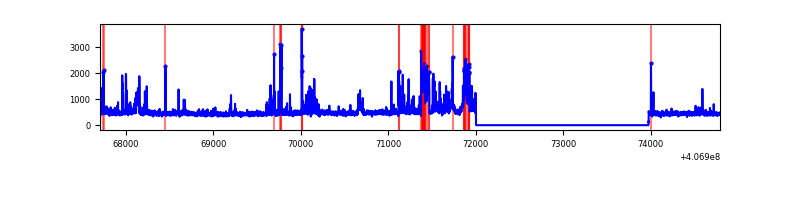 |
| C | 7086 | 5114 | 49 | 49 | 0.69% | 0.96% | 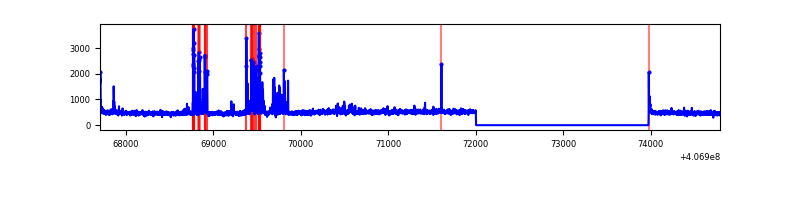 |
| D | 7086 | 5114 | 406 | 406 | 5.73% | 7.94% | 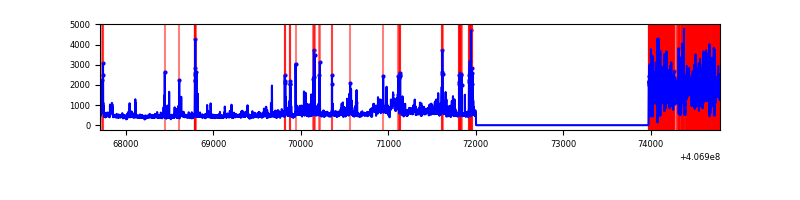 |
Top three noisy pixels from each quadrant. If the there are fewer than three noisy pixels in the level2.evt file, extra rows are filled as -1
| Pixel properties | Quadrant properties | ||||||
|---|---|---|---|---|---|---|---|
| Quadrant | DetID | PixID | Counts | Sigma | Mean | Median | Sigma |
| A | 10 | 83 | 398313 | 3313.95 | 589 | 576 | 120.0 |
| A | 13 | 248 | 26406 | 215.22 | 589 | 576 | 120.0 |
| A | 12 | 189 | 9463 | 74.05 | 589 | 576 | 120.0 |
| B | 4 | 171 | 461788 | 4153.76 | 578 | 564 | 111.0 |
| B | 15 | 85 | 57774 | 515.23 | 578 | 564 | 111.0 |
| B | 0 | 230 | 17741 | 154.7 | 578 | 564 | 111.0 |
| C | 15 | 214 | 211406 | 1591.18 | 567 | 570 | 132.5 |
| C | 2 | 16 | 156423 | 1176.22 | 567 | 570 | 132.5 |
| C | 1 | 23 | 96192 | 721.66 | 567 | 570 | 132.5 |
| D | 2 | 16 | 1252284 | 9170.47 | 553 | 536 | 136.5 |
| D | 13 | 249 | 282605 | 2066.47 | 553 | 536 | 136.5 |
| D | 5 | 222 | 182986 | 1336.65 | 553 | 536 | 136.5 |
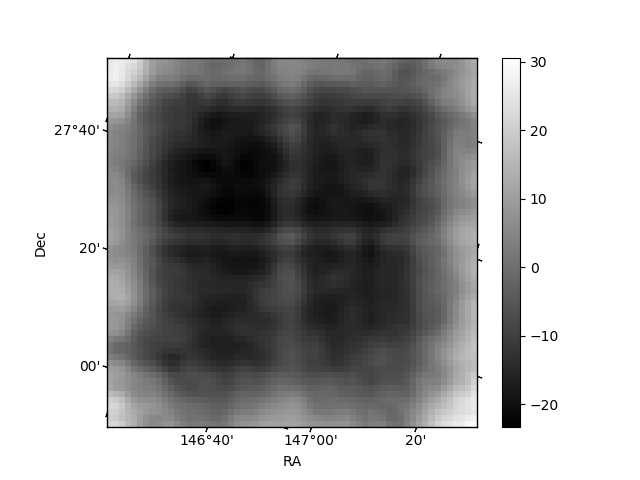
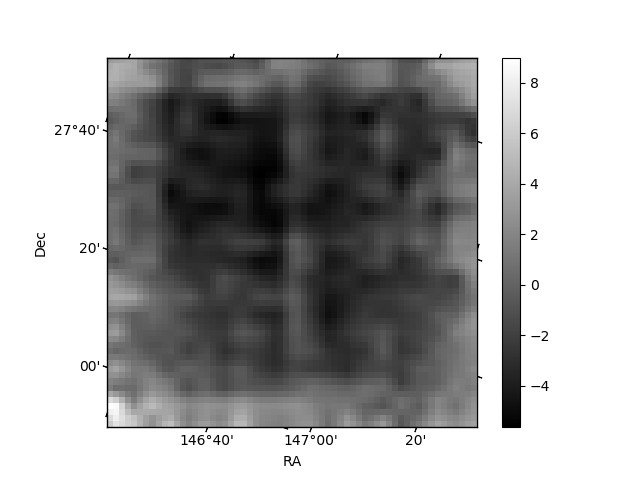
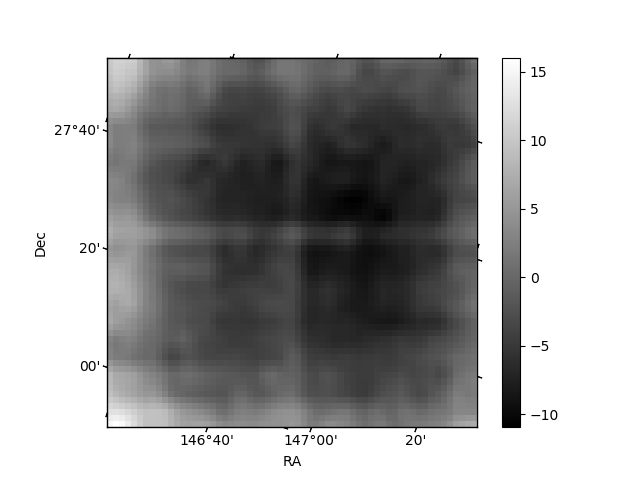
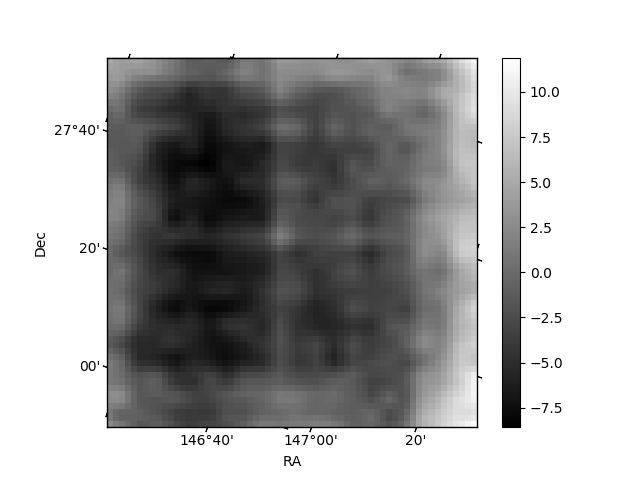
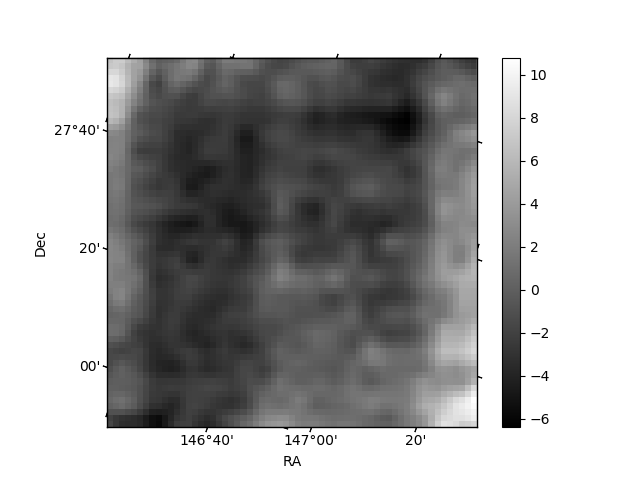
Histogram calculated using DETX and DETY for each event in the final _common_clean file
| Quadrant A | 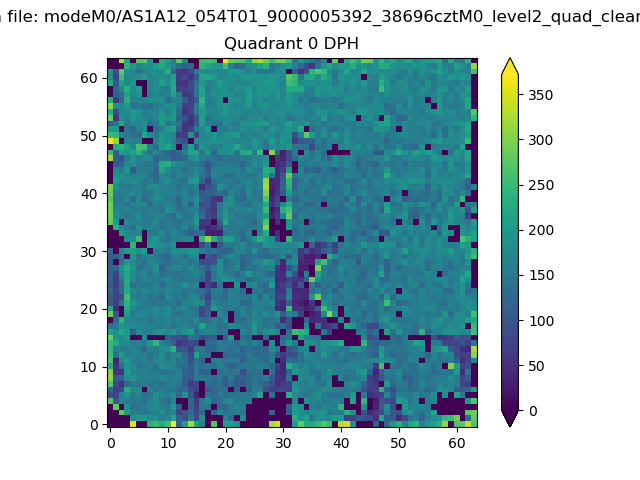 |
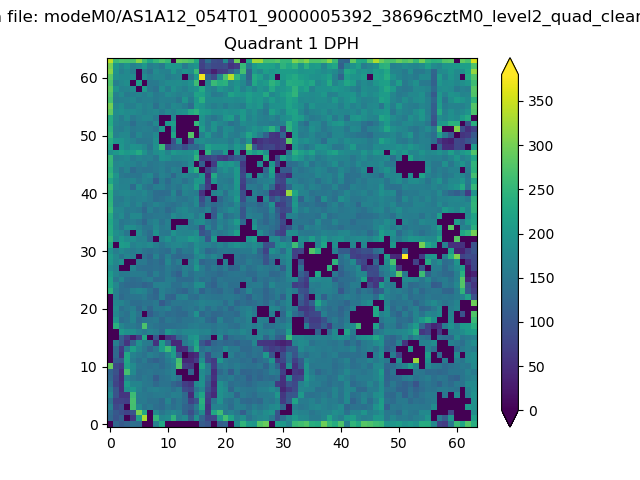 |
Quadrant B |
|---|---|---|---|
| Quadrant D | 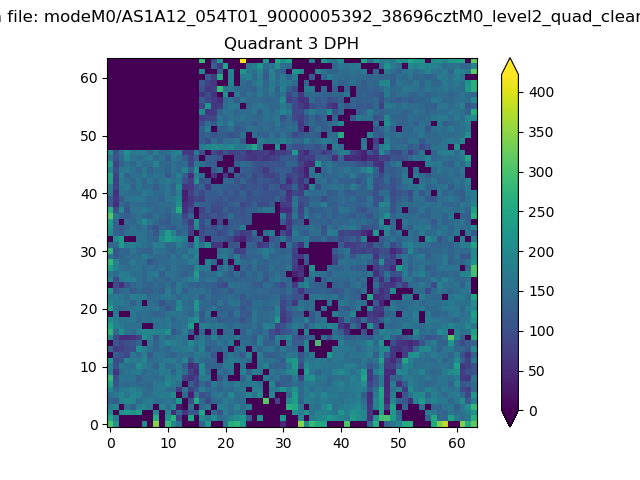 |
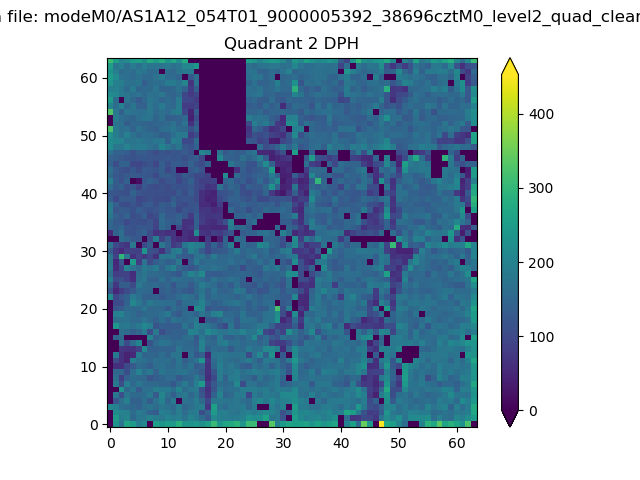 |
Quadrant C |
| Plot type | Count rate plots | Images |
|---|---|---|
| Comparison with Poisson distribution Blue bars denote a histogram of data divided into 1 sec bins. Red curve is a Poisson curve with rate = median count rate of data. |
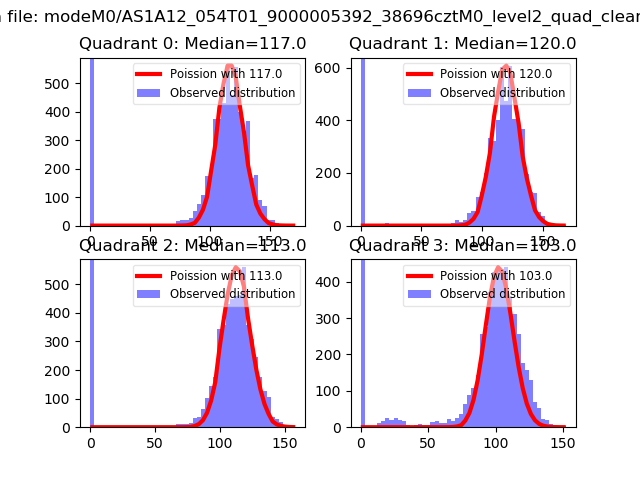 |
 |
| Quadrant-wise count rates Data is divided into 100 sec bins |
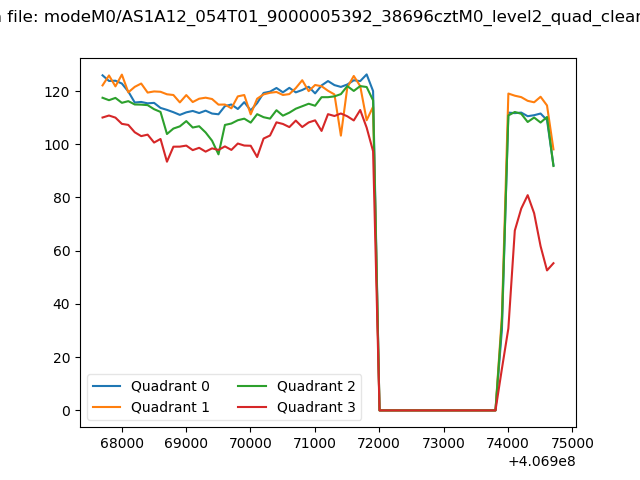 |
|
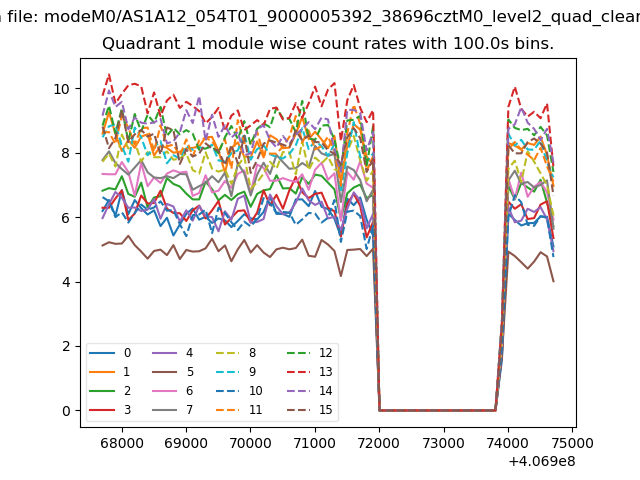
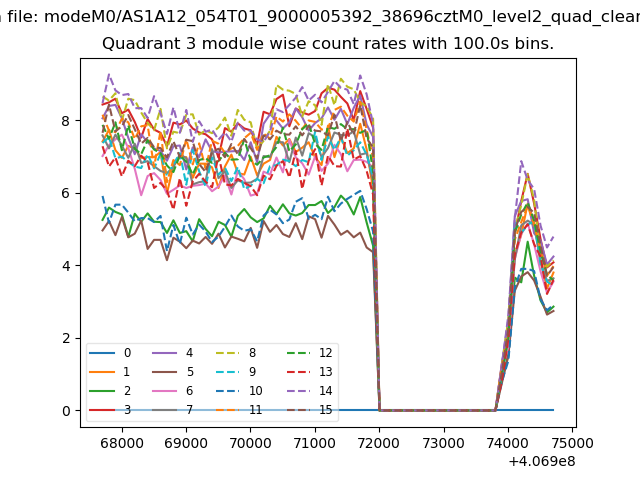
| Module-wise count rates for Quadrant A Data is divided into 100 sec bins |
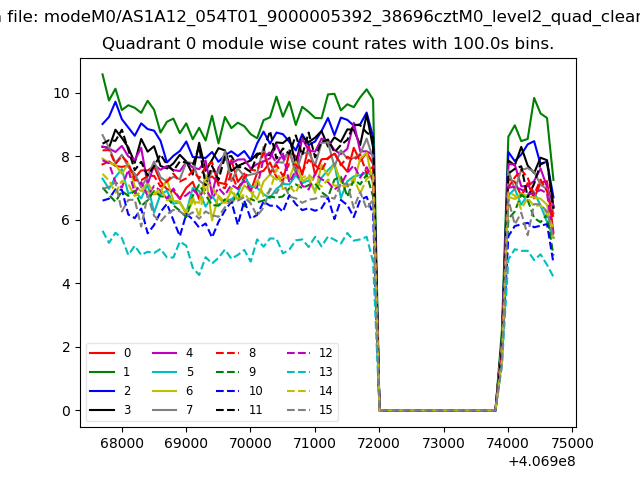 |
 |
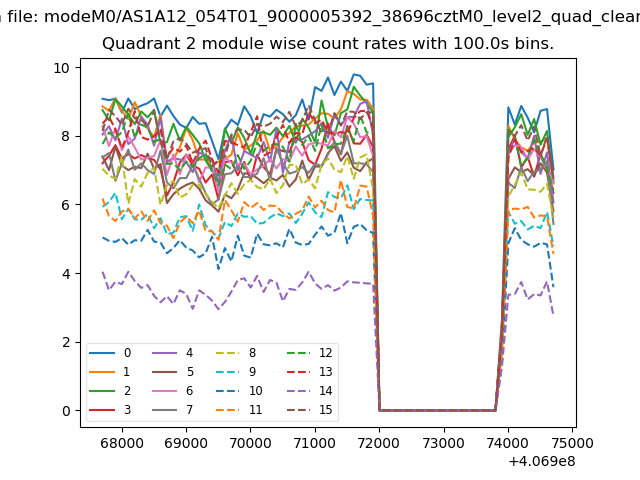
| Module-wise count rates for Quadrant B Data is divided into 100 sec bins |
 |
 |
| Module-wise count rates for Quadrant C Data is divided into 100 sec bins |
 |
 |
| Module-wise count rates for Quadrant D Data is divided into 100 sec bins |
 |
 |
| Parameter | Plot |
|---|---|
| CZT HV Monitor | 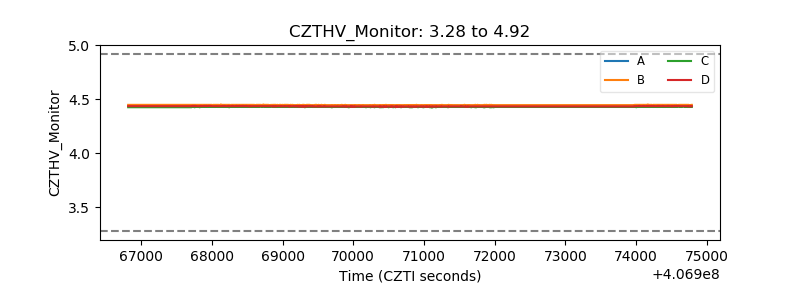 |
| D_VDD | 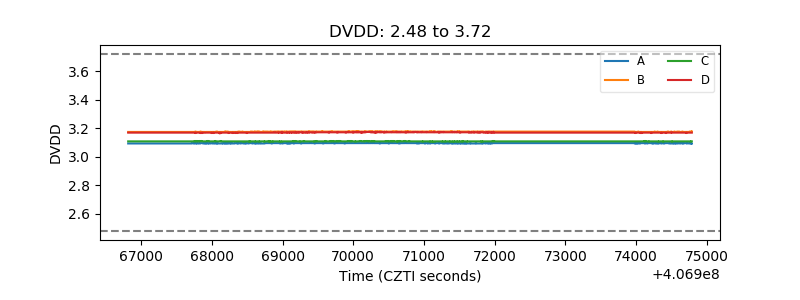 |
| Temperature 1 | 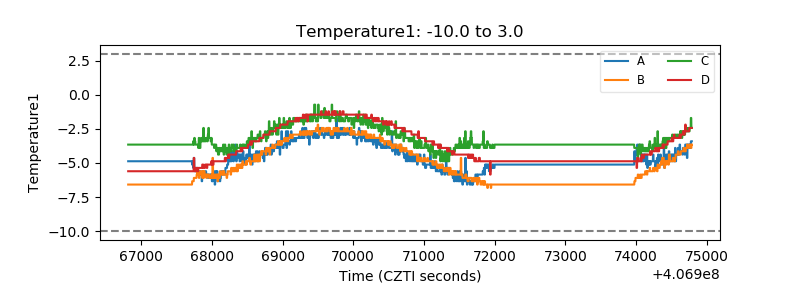 |
| Veto HV Monitor | 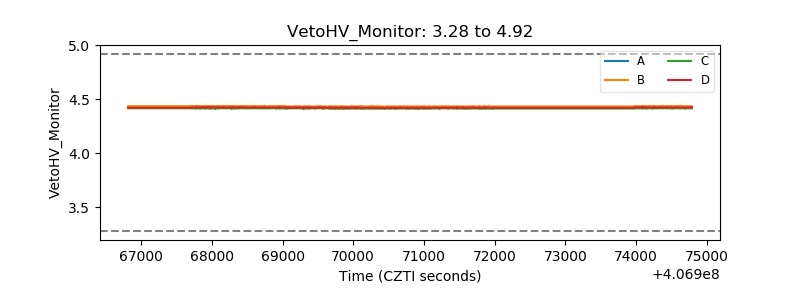 |
| Veto LLD | 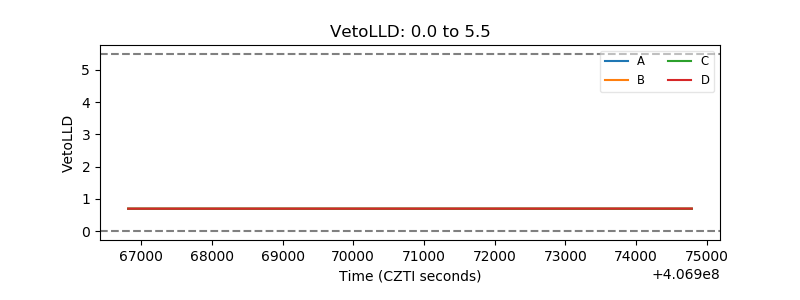 |
| Alpha Counter | 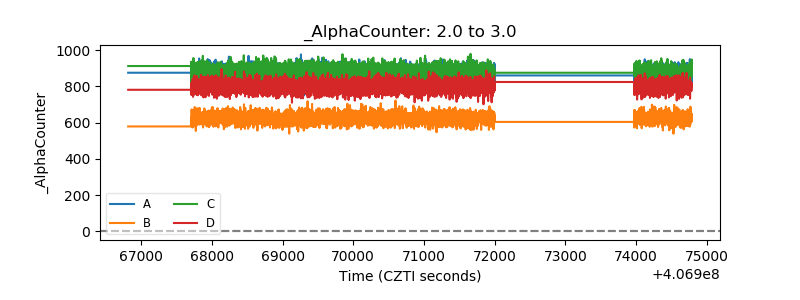 |
| _CPM_Rate | 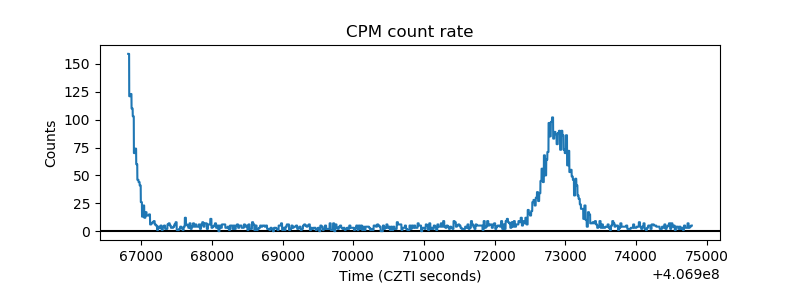 |
| CZT Counter | 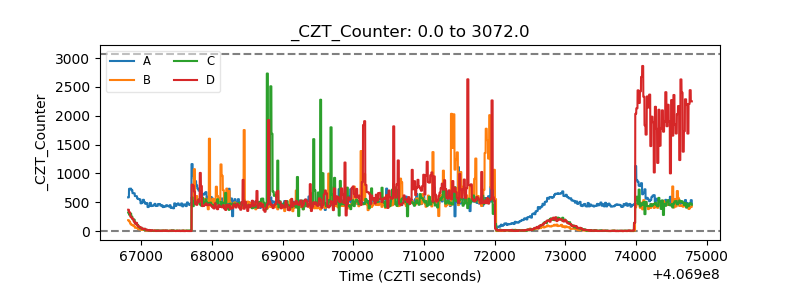 |
| +2.5 Volts monitor | 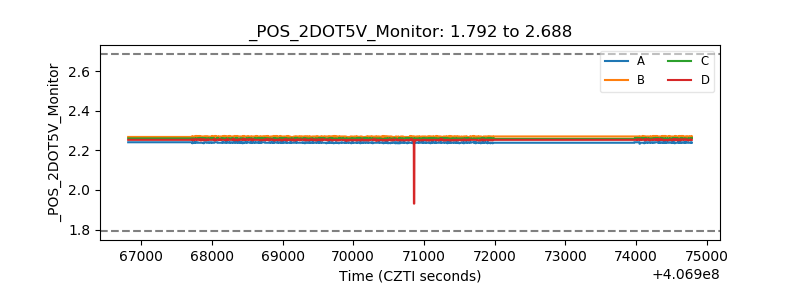 |
| +5 Volts monitor | 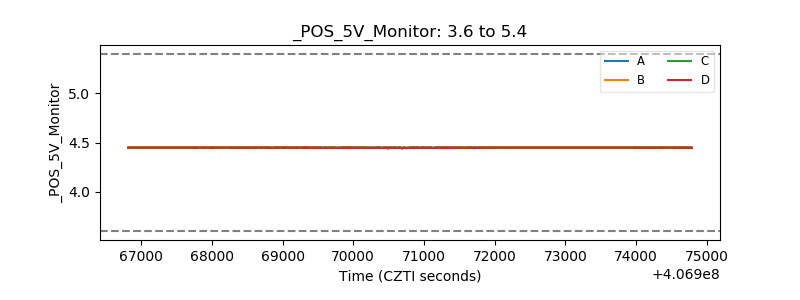 |
| _ROLL_ROT | 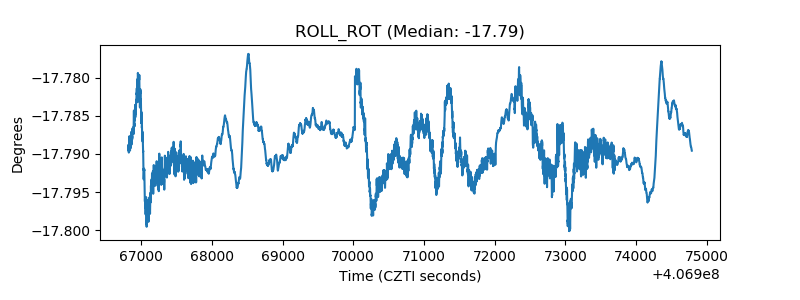 |
| _Roll_DEC | 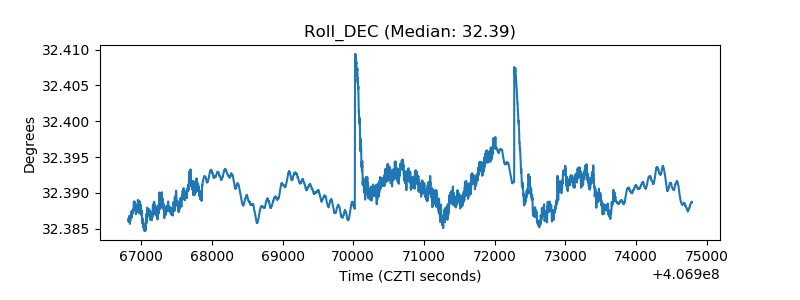 |
| _Roll_RA | 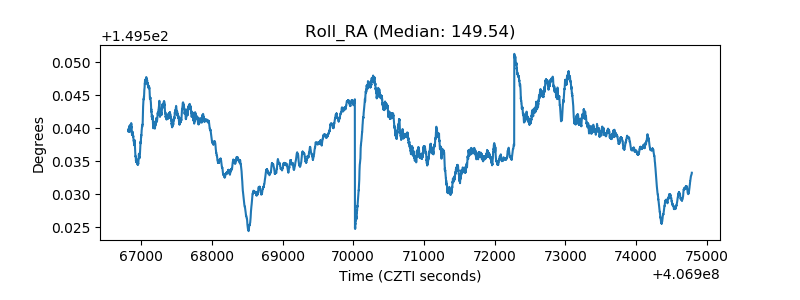 |
| Veto Counter | 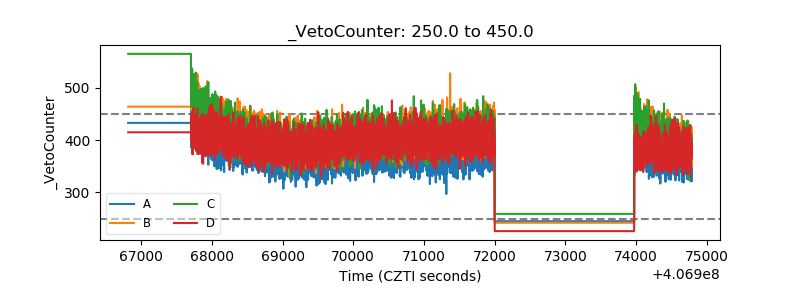 |