| Param | Original file | Final file |
|---|---|---|
| Filename | modeM0/AS1A12_054T01_9000005392_38697cztM0_level2.fits | modeM0/AS1A12_054T01_9000005392_38697cztM0_level2_quad_clean.evt |
| Size (bytes) | 496,537,920 | 85,262,400 |
| Size | 473.5 MB | 81.3 MB |
| Events in quadrant A | 2,866,595 | 614,774 |
| Events in quadrant B | 2,623,098 | 631,323 |
| Events in quadrant C | 2,646,981 | 592,554 |
| Events in quadrant D | 9,822,506 | 363,727 |
| Mode M9 | |||
|---|---|---|---|
| Quadrant | BADHDUFLAG | Total packets | Discarded packets |
| A | 0 | 24 | 0 |
| B | 0 | 24 | 0 |
| C | 0 | 24 | 0 |
| D | 0 | 25 | 0 |
| Mode SS | |||
|---|---|---|---|
| Quadrant | BADHDUFLAG | Total packets | Discarded packets |
| A | 0 | 110 | 0 |
| B | 0 | 110 | 0 |
| C | 0 | 110 | 0 |
| D | 0 | 110 | 0 |
| Mode M0 | |||
|---|---|---|---|
| Quadrant | BADHDUFLAG | Total packets | Discarded packets |
| A | 0 | 11582 | 3 |
| B | 0 | 11323 | 2 |
| C | 0 | 11120 | 2 |
| D | 0 | 32868 | 2 |
| Quadrant | Total seconds | Saturated seconds | Saturation percentage |
|---|---|---|---|
| A | 5415 | 15 | 0.277008% |
| B | 5415 | 20 | 0.369344% |
| C | 5415 | 15 | 0.277008% |
| D | 5415 | 2383 | 44.007387% |
Noise dominated data is calculated using 1-second bins in cleaned event files. If a bin has >2000 counts, and if more than 50% of those come from <1% of pixels, then it is considered to be noise-dominated and hence unusable.
| Quadrant | # 1 sec bins | Bins with >0 counts | Bins with >2000 counts | High rate bins dominated by noise | Noise dominated (total time) | Noise dominated (detector-on time) | Marked lightcurve |
|---|---|---|---|---|---|---|---|
| A | 7088 | 5416 | 9 | 9 | 0.13% | 0.17% | 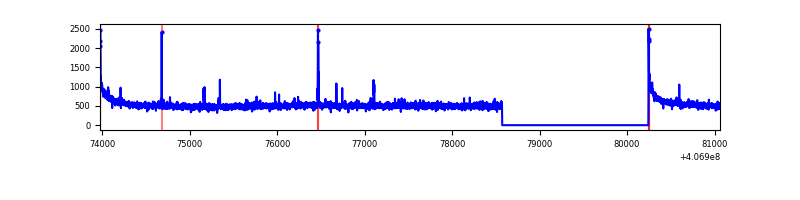 |
| B | 7088 | 5416 | 7 | 7 | 0.10% | 0.13% | 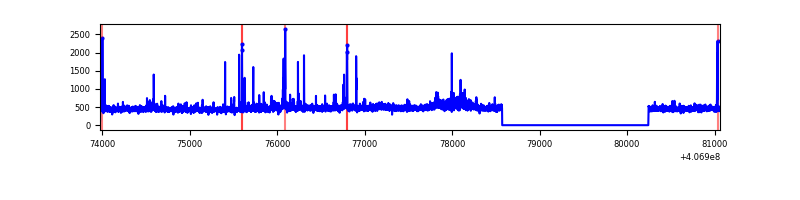 |
| C | 7088 | 5416 | 8 | 8 | 0.11% | 0.15% | 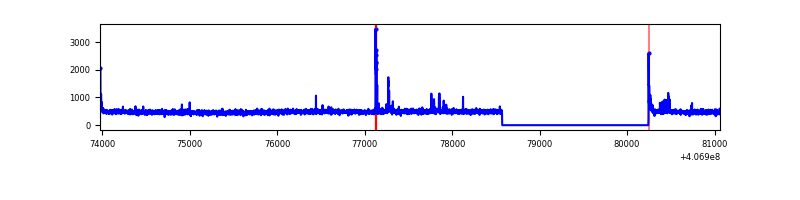 |
| D | 7088 | 5416 | 1962 | 1962 | 27.68% | 36.23% | 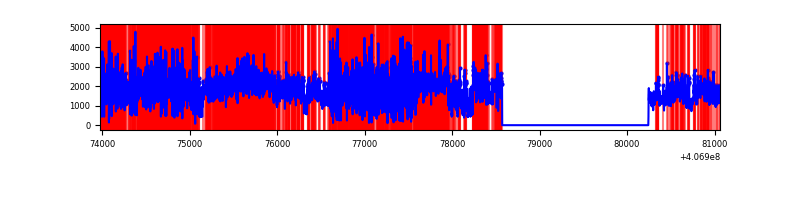 |
Top three noisy pixels from each quadrant. If the there are fewer than three noisy pixels in the level2.evt file, extra rows are filled as -1
| Pixel properties | Quadrant properties | ||||||
|---|---|---|---|---|---|---|---|
| Quadrant | DetID | PixID | Counts | Sigma | Mean | Median | Sigma |
| A | 10 | 83 | 413144 | 3258.59 | 616 | 604 | 126.6 |
| A | 13 | 248 | 31163 | 241.38 | 616 | 604 | 126.6 |
| A | 13 | 6 | 14796 | 112.1 | 616 | 604 | 126.6 |
| B | 0 | 213 | 67262 | 559.7 | 610 | 593 | 119.1 |
| B | 4 | 171 | 61534 | 511.61 | 610 | 593 | 119.1 |
| B | 15 | 85 | 22845 | 186.81 | 610 | 593 | 119.1 |
| C | 15 | 214 | 221549 | 1563.26 | 599 | 602 | 141.3 |
| C | 15 | 208 | 44403 | 309.9 | 599 | 602 | 141.3 |
| C | 0 | 10 | 27596 | 190.99 | 599 | 602 | 141.3 |
| D | 2 | 16 | 6762482 | 52588.8 | 517 | 501 | 128.6 |
| D | 12 | 233 | 320214 | 2486.45 | 517 | 501 | 128.6 |
| D | 13 | 249 | 230843 | 1791.4 | 517 | 501 | 128.6 |
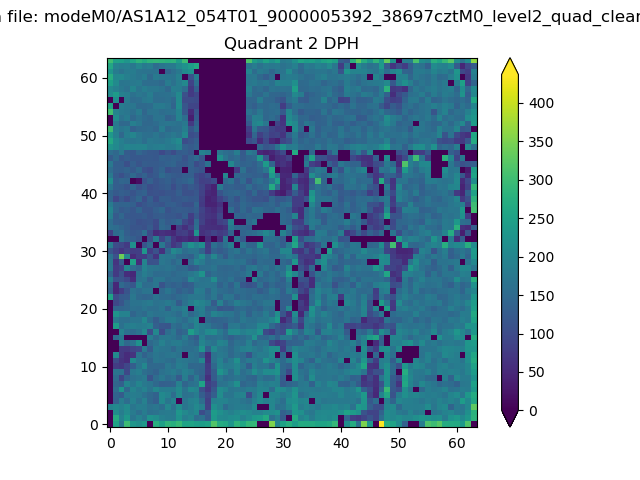
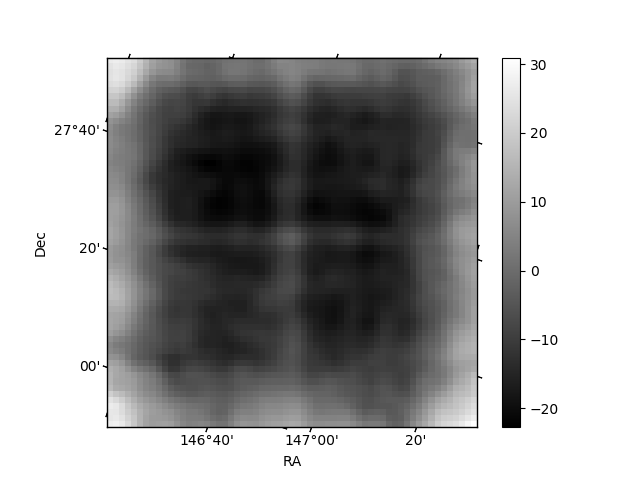
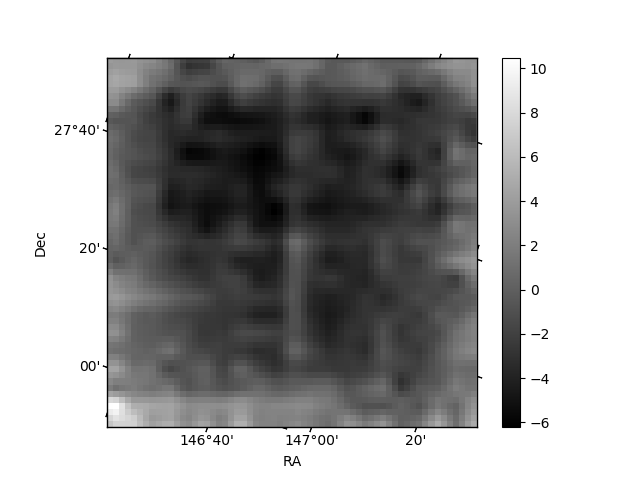
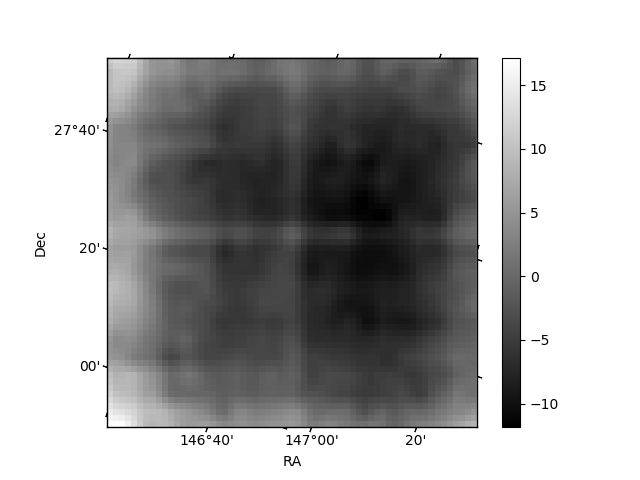
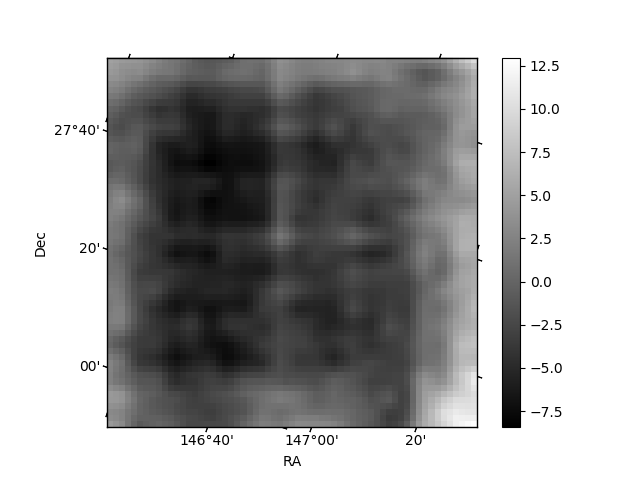
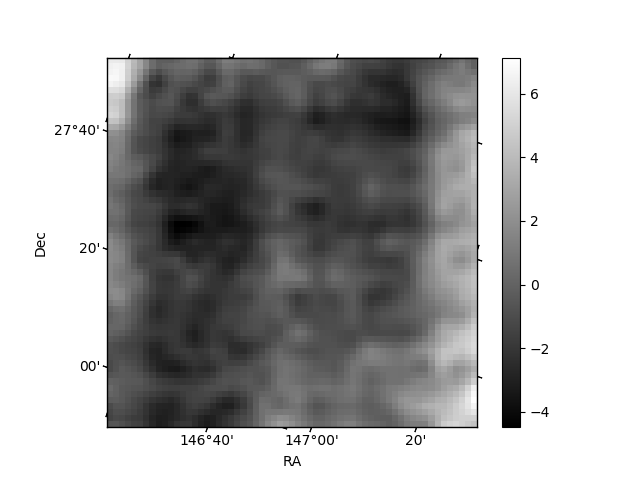
Histogram calculated using DETX and DETY for each event in the final _common_clean file
| Quadrant A | 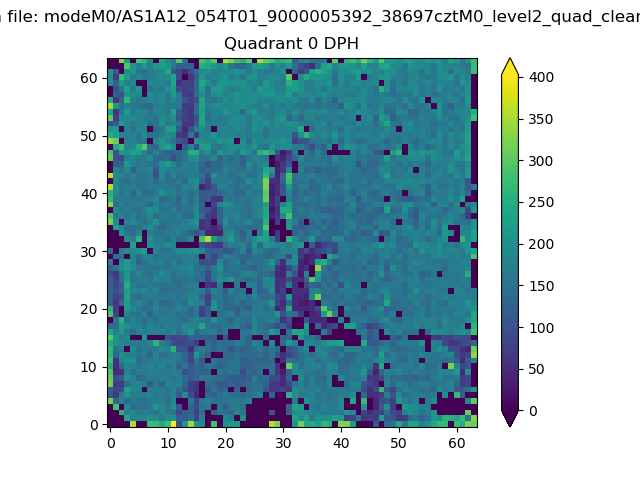 |
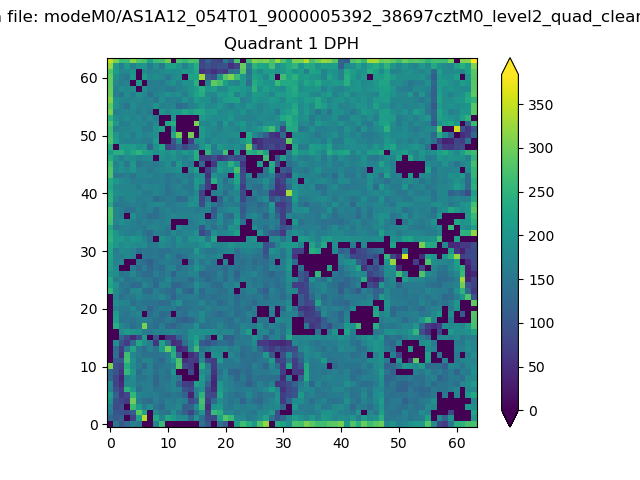 |
Quadrant B |
|---|---|---|---|
| Quadrant D | 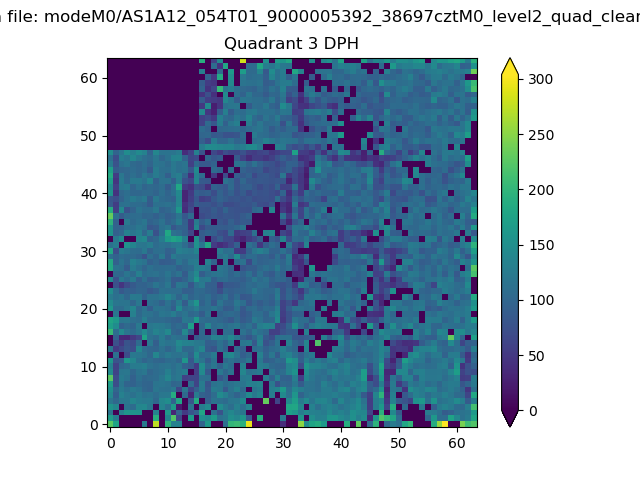 |
 |
Quadrant C |
| Plot type | Count rate plots | Images |
|---|---|---|
| Comparison with Poisson distribution Blue bars denote a histogram of data divided into 1 sec bins. Red curve is a Poisson curve with rate = median count rate of data. |
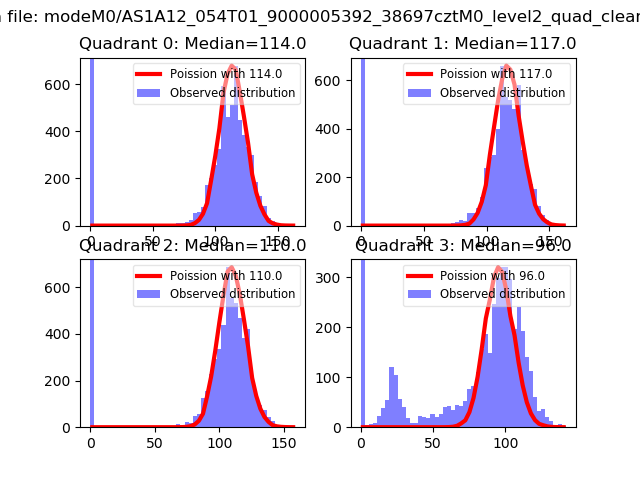 |
 |
| Quadrant-wise count rates Data is divided into 100 sec bins |
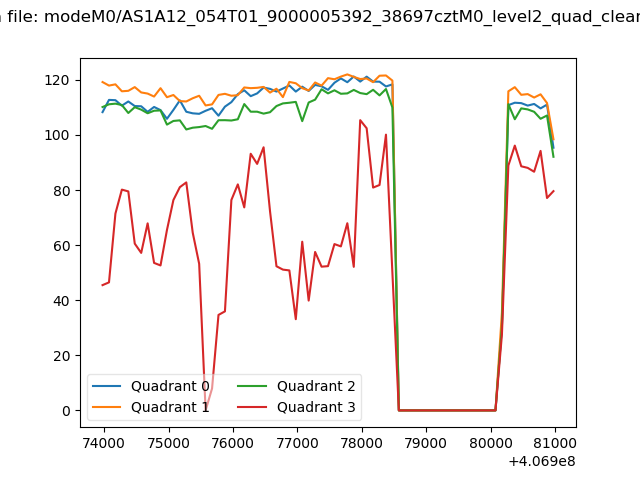 |
|
| Module-wise count rates for Quadrant A Data is divided into 100 sec bins |
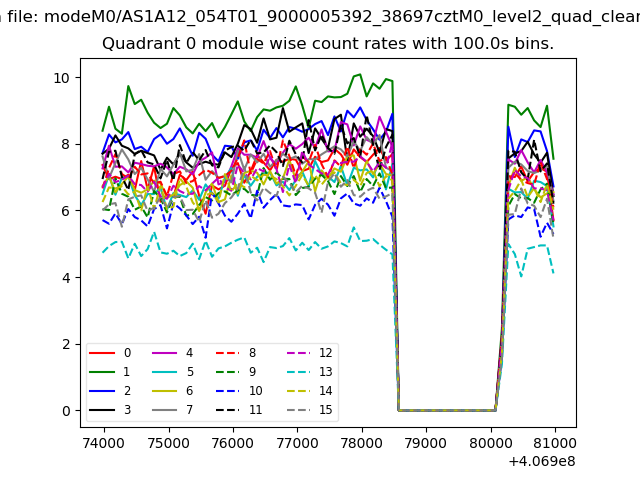 |
 |
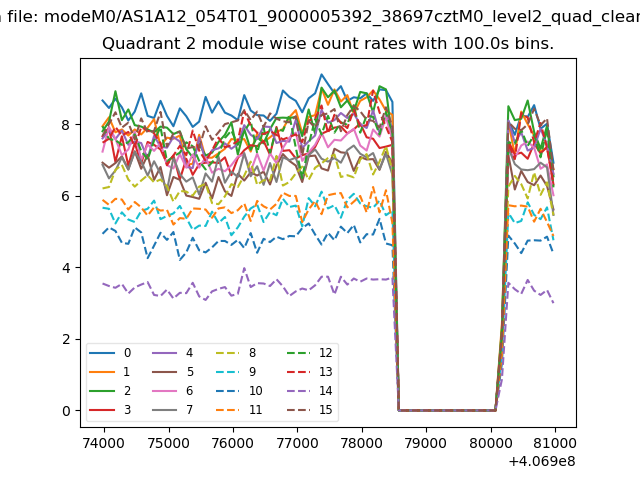
| Module-wise count rates for Quadrant B Data is divided into 100 sec bins |
 |
 |
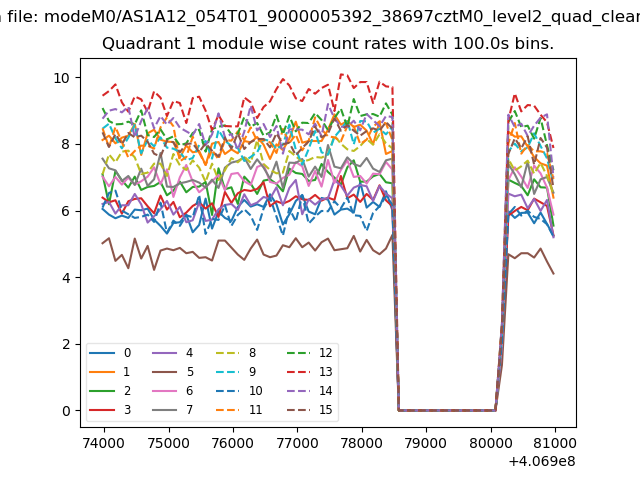
| Module-wise count rates for Quadrant C Data is divided into 100 sec bins |
 |
 |
| Module-wise count rates for Quadrant D Data is divided into 100 sec bins |
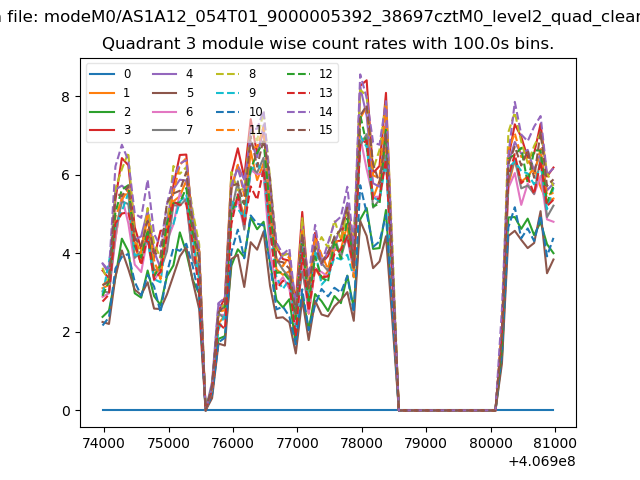 |
 |
| Parameter | Plot |
|---|---|
| CZT HV Monitor | 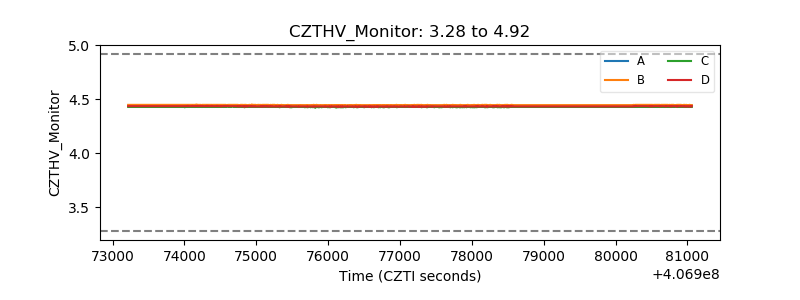 |
| D_VDD | 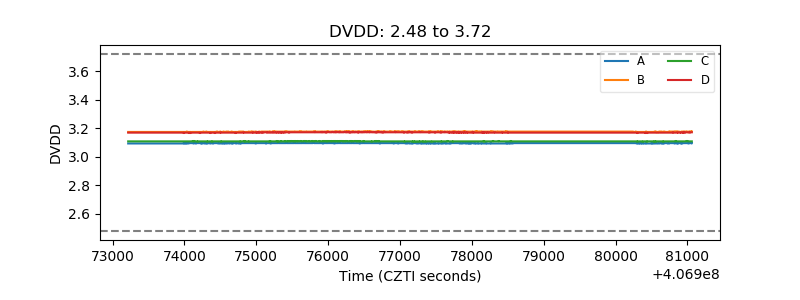 |
| Temperature 1 | 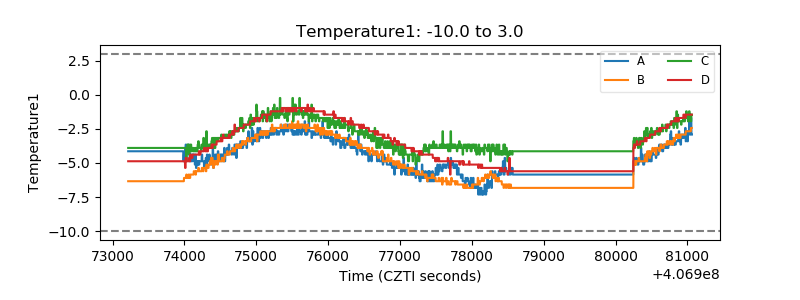 |
| Veto HV Monitor | 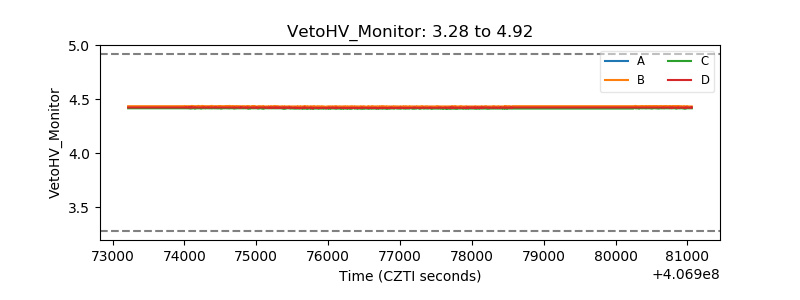 |
| Veto LLD | 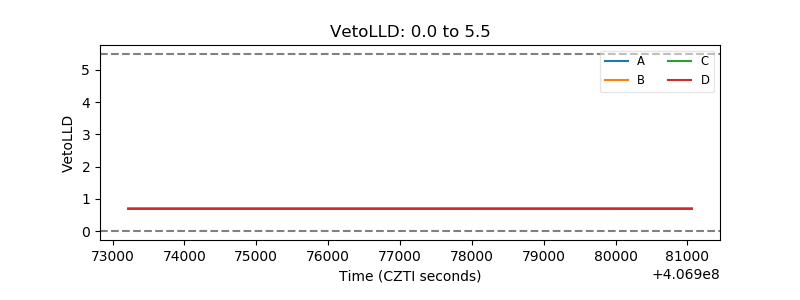 |
| Alpha Counter | 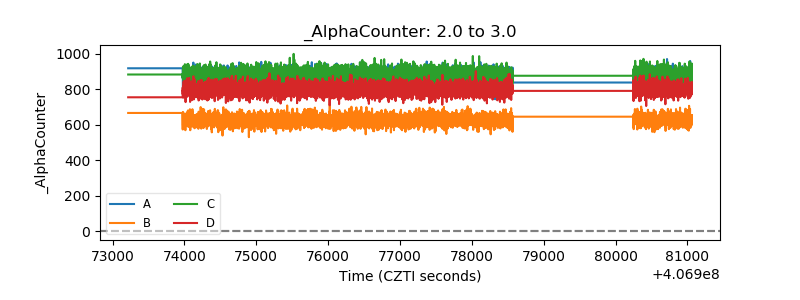 |
| _CPM_Rate | 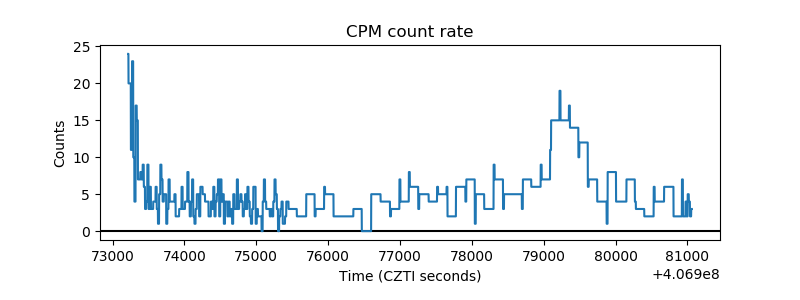 |
| CZT Counter | 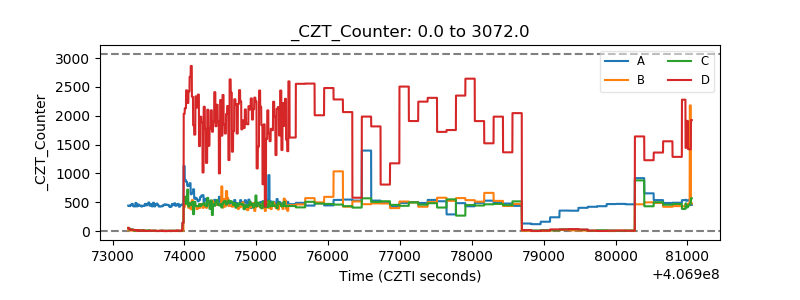 |
| +2.5 Volts monitor | 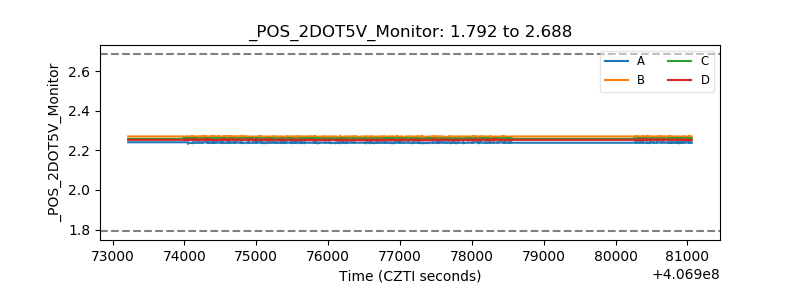 |
| +5 Volts monitor | 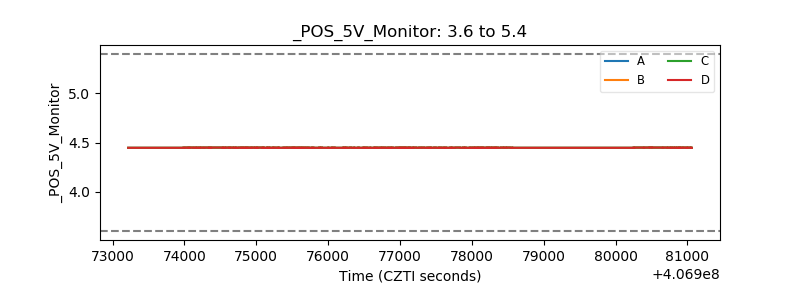 |
| _ROLL_ROT | 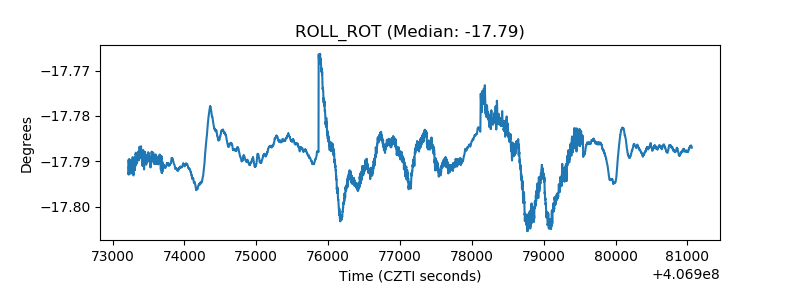 |
| _Roll_DEC | 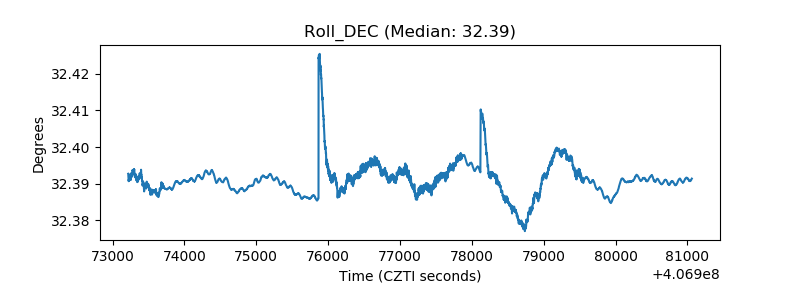 |
| _Roll_RA | 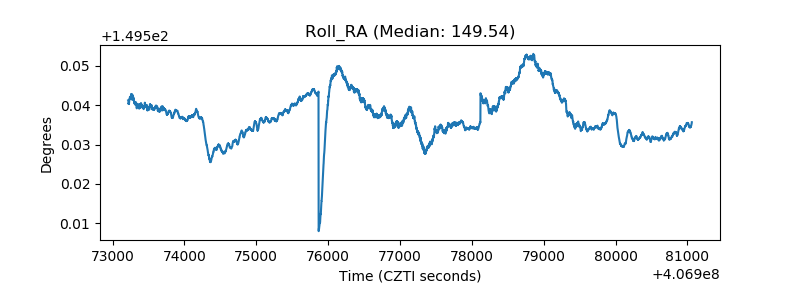 |
| Veto Counter | 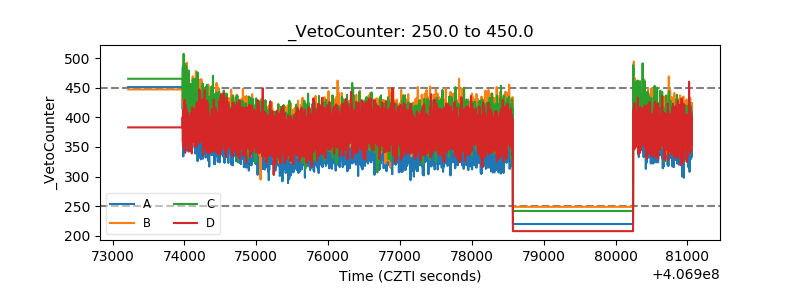 |