| Param | Original file | Final file |
|---|---|---|
| Filename | modeM0/AS1A12_054T01_9000005392_38698cztM0_level2.fits | modeM0/AS1A12_054T01_9000005392_38698cztM0_level2_quad_clean.evt |
| Size (bytes) | 574,747,200 | 87,091,200 |
| Size | 548.1 MB | 83.1 MB |
| Events in quadrant A | 2,962,293 | 644,301 |
| Events in quadrant B | 4,285,136 | 590,366 |
| Events in quadrant C | 3,009,199 | 618,543 |
| Events in quadrant D | 10,574,070 | 383,164 |
| Mode M9 | |||
|---|---|---|---|
| Quadrant | BADHDUFLAG | Total packets | Discarded packets |
| A | 0 | 15 | 0 |
| B | 0 | 15 | 0 |
| C | 0 | 15 | 0 |
| D | 0 | 16 | 0 |
| Mode SS | |||
|---|---|---|---|
| Quadrant | BADHDUFLAG | Total packets | Discarded packets |
| A | 0 | 116 | 0 |
| B | 0 | 116 | 0 |
| C | 0 | 116 | 0 |
| D | 0 | 116 | 0 |
| Mode M0 | |||
|---|---|---|---|
| Quadrant | BADHDUFLAG | Total packets | Discarded packets |
| A | 0 | 12115 | 3 |
| B | 0 | 16474 | 2 |
| C | 0 | 12540 | 2 |
| D | 0 | 35338 | 2 |
| Quadrant | Total seconds | Saturated seconds | Saturation percentage |
|---|---|---|---|
| A | 5728 | 10 | 0.174581% |
| B | 5728 | 596 | 10.405028% |
| C | 5728 | 11 | 0.192039% |
| D | 5728 | 2374 | 41.445531% |
Noise dominated data is calculated using 1-second bins in cleaned event files. If a bin has >2000 counts, and if more than 50% of those come from <1% of pixels, then it is considered to be noise-dominated and hence unusable.
| Quadrant | # 1 sec bins | Bins with >0 counts | Bins with >2000 counts | High rate bins dominated by noise | Noise dominated (total time) | Noise dominated (detector-on time) | Marked lightcurve |
|---|---|---|---|---|---|---|---|
| A | 7129 | 5728 | 3 | 3 | 0.04% | 0.05% | 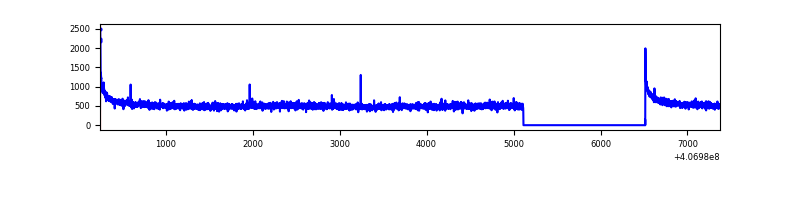 |
| B | 7129 | 5729 | 471 | 471 | 6.61% | 8.22% | 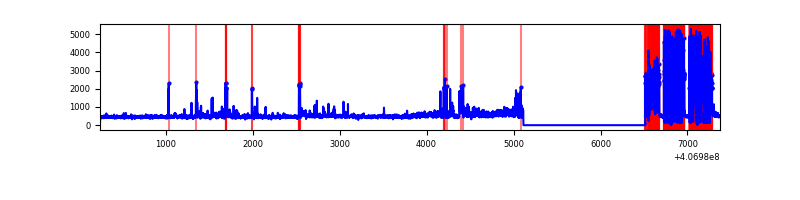 |
| C | 7129 | 5728 | 3 | 3 | 0.04% | 0.05% | 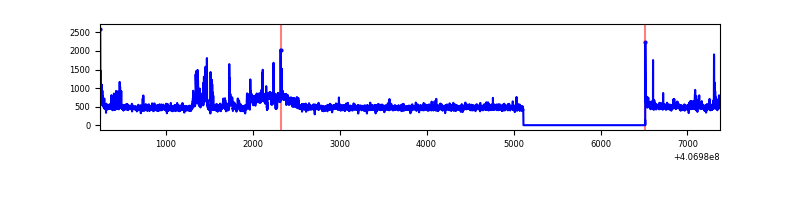 |
| D | 7129 | 5728 | 2060 | 2060 | 28.90% | 35.96% | 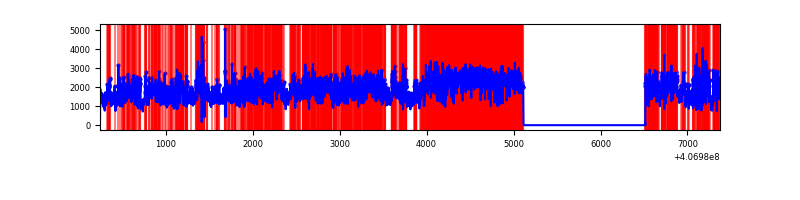 |
Top three noisy pixels from each quadrant. If the there are fewer than three noisy pixels in the level2.evt file, extra rows are filled as -1
| Pixel properties | Quadrant properties | ||||||
|---|---|---|---|---|---|---|---|
| Quadrant | DetID | PixID | Counts | Sigma | Mean | Median | Sigma |
| A | 10 | 83 | 424018 | 3183.85 | 649 | 633 | 133.0 |
| A | 13 | 6 | 12446 | 88.83 | 649 | 633 | 133.0 |
| A | 13 | 254 | 9440 | 66.23 | 649 | 633 | 133.0 |
| B | 4 | 251 | 1641995 | 13937.23 | 599 | 583 | 117.8 |
| B | 4 | 171 | 117694 | 994.39 | 599 | 583 | 117.8 |
| B | 0 | 213 | 103784 | 876.28 | 599 | 583 | 117.8 |
| C | 15 | 214 | 235572 | 1573.2 | 630 | 633 | 149.3 |
| C | 3 | 110 | 158845 | 1059.42 | 630 | 633 | 149.3 |
| C | 1 | 23 | 69666 | 462.26 | 630 | 633 | 149.3 |
| D | 2 | 16 | 7086587 | 51707.28 | 549 | 533 | 137.0 |
| D | 12 | 227 | 530613 | 3868.02 | 549 | 533 | 137.0 |
| D | 2 | 249 | 232424 | 1692.12 | 549 | 533 | 137.0 |
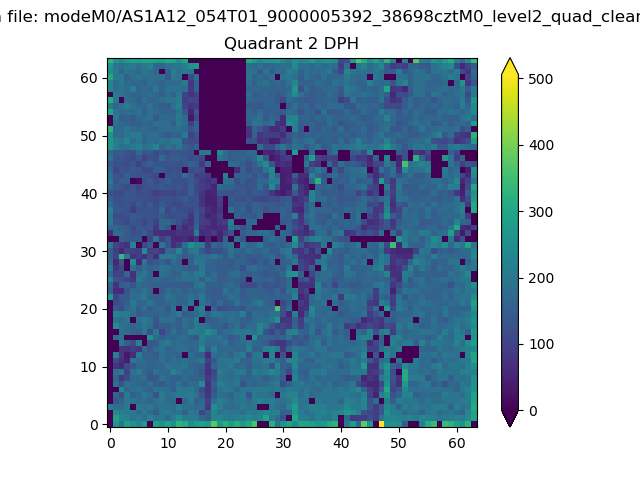
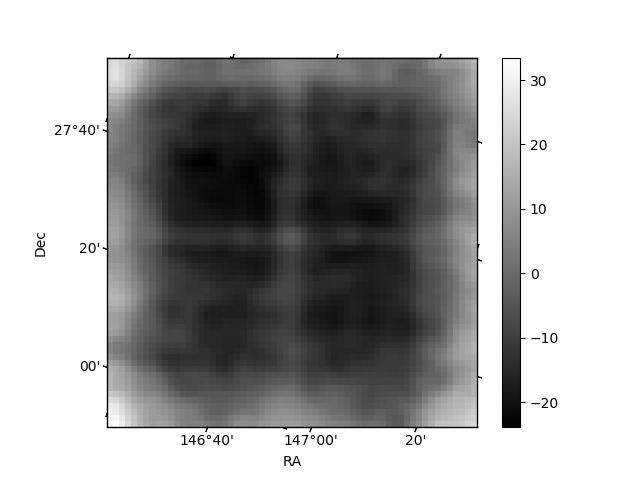
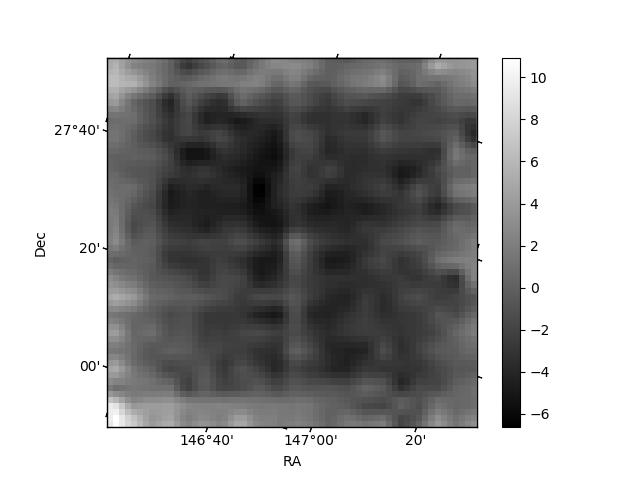
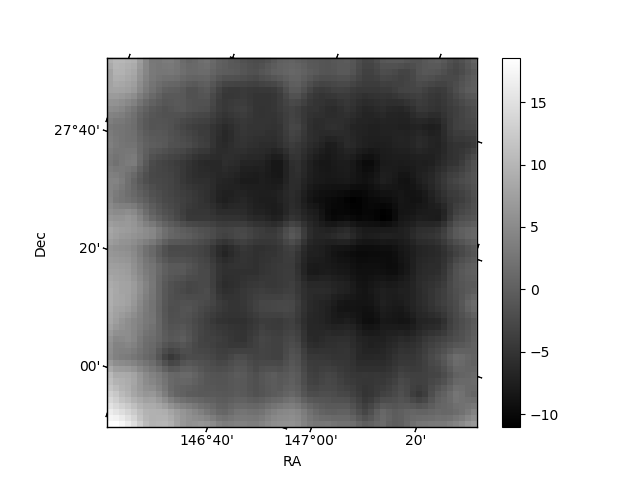
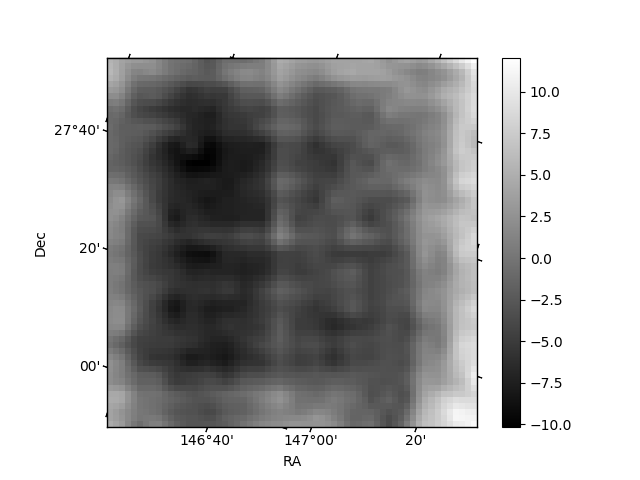
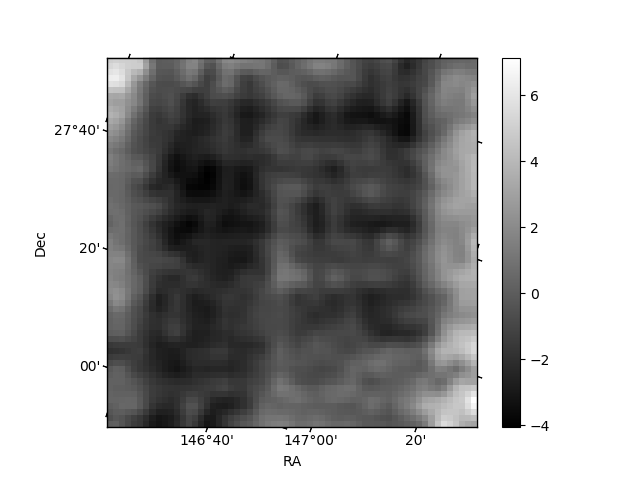
Histogram calculated using DETX and DETY for each event in the final _common_clean file
| Quadrant A | 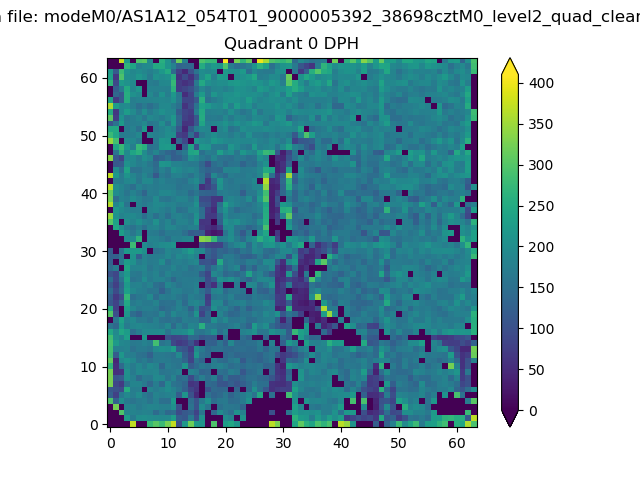 |
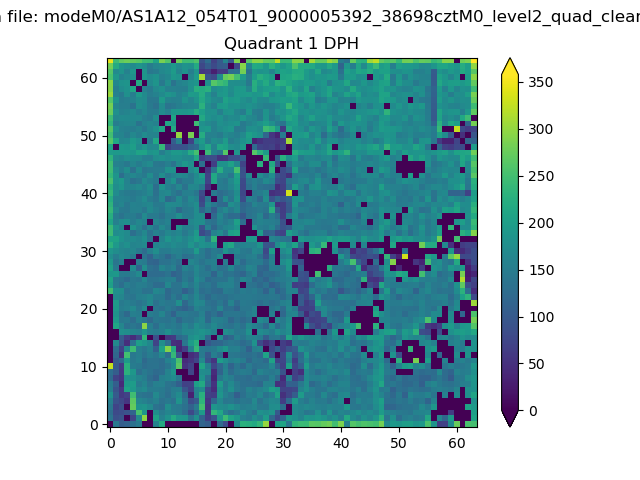 |
Quadrant B |
|---|---|---|---|
| Quadrant D | 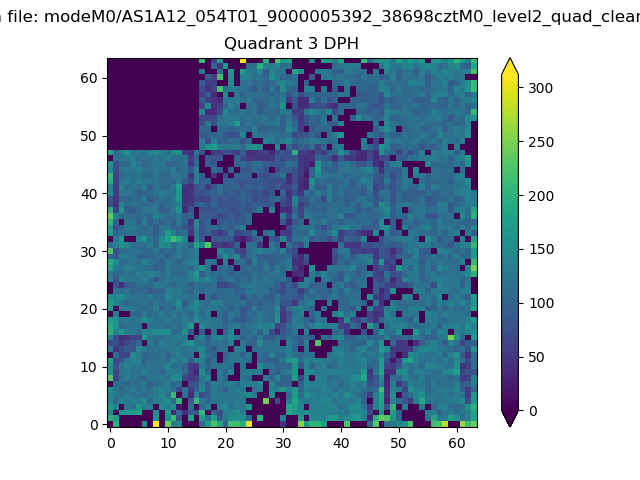 |
 |
Quadrant C |
| Plot type | Count rate plots | Images |
|---|---|---|
| Comparison with Poisson distribution Blue bars denote a histogram of data divided into 1 sec bins. Red curve is a Poisson curve with rate = median count rate of data. |
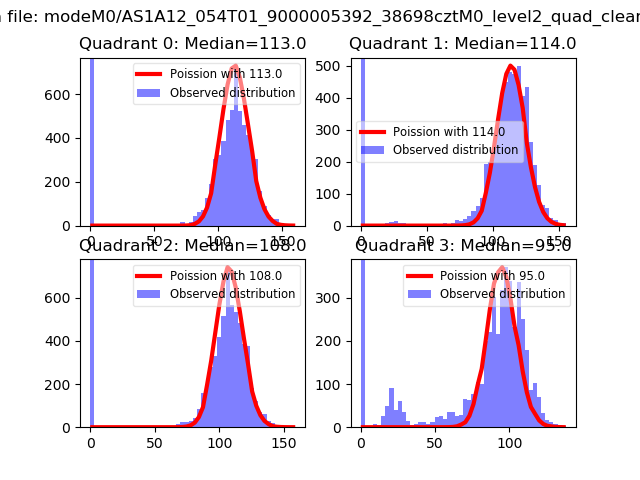 |
 |
| Quadrant-wise count rates Data is divided into 100 sec bins |
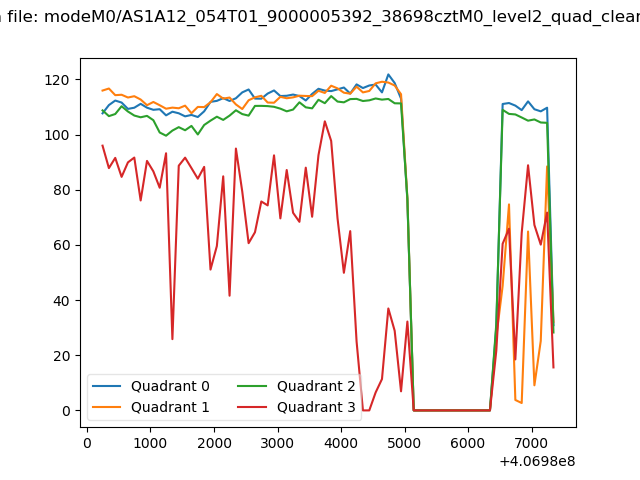 |
|
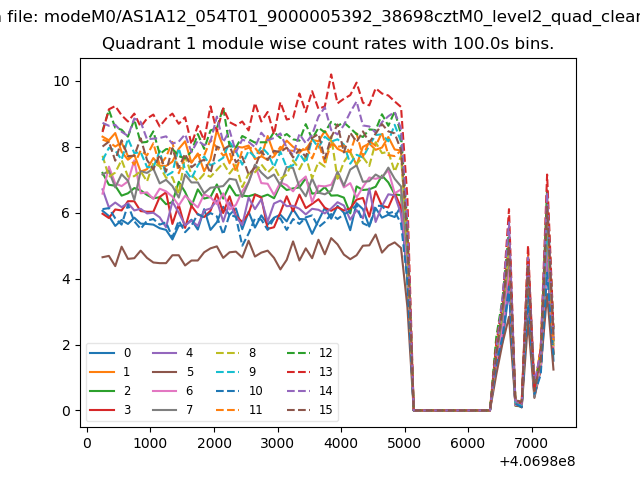
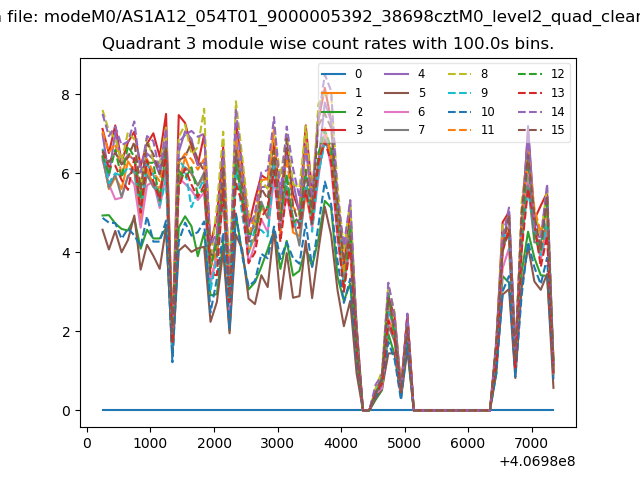
| Module-wise count rates for Quadrant A Data is divided into 100 sec bins |
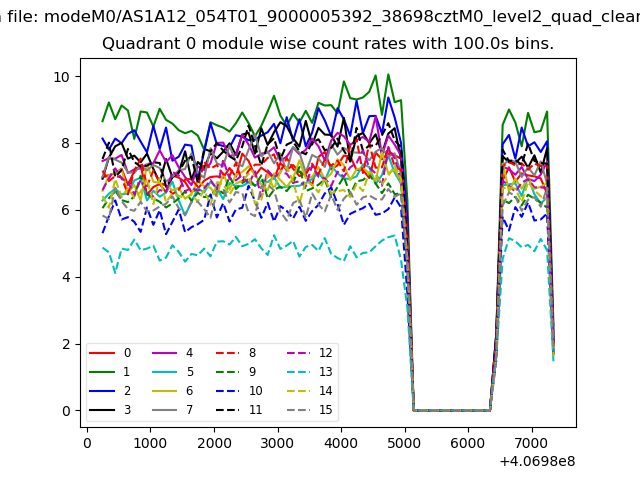 |
 |
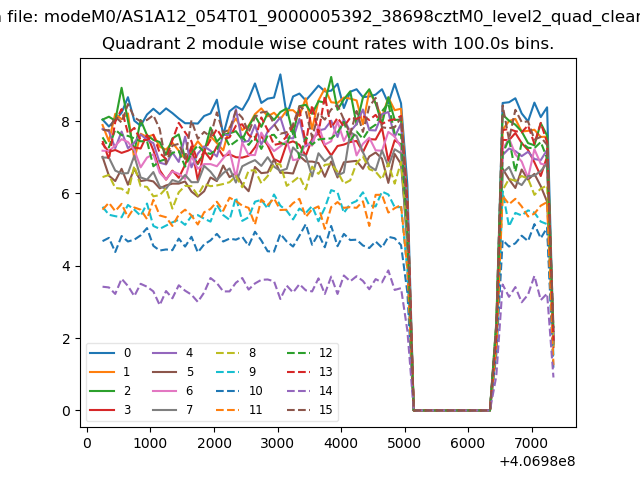
| Module-wise count rates for Quadrant B Data is divided into 100 sec bins |
 |
 |
| Module-wise count rates for Quadrant C Data is divided into 100 sec bins |
 |
 |
| Module-wise count rates for Quadrant D Data is divided into 100 sec bins |
 |
 |
| Parameter | Plot |
|---|---|
| CZT HV Monitor | 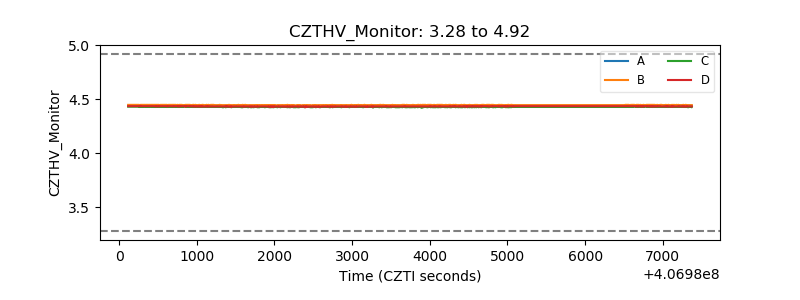 |
| D_VDD | 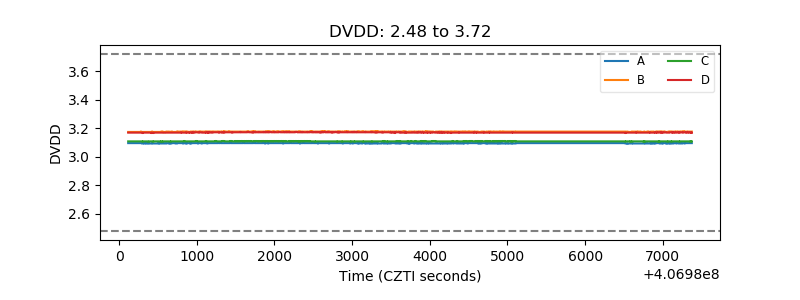 |
| Temperature 1 | 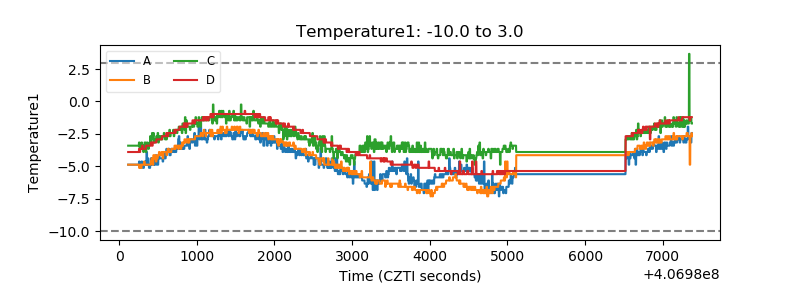 |
| Veto HV Monitor | 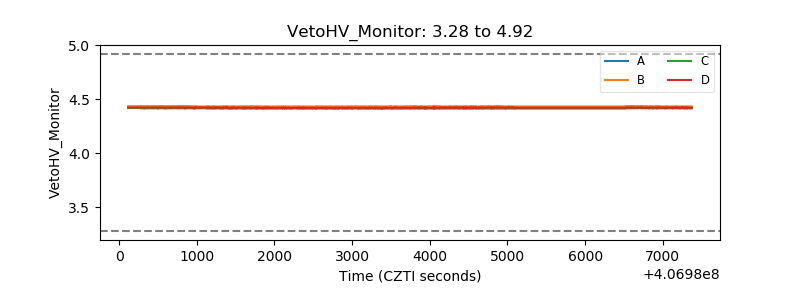 |
| Veto LLD | 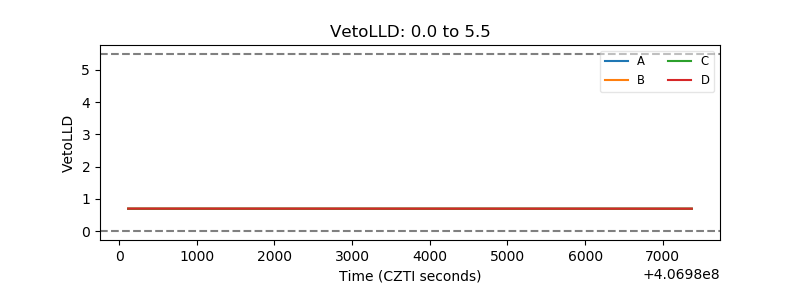 |
| Alpha Counter | 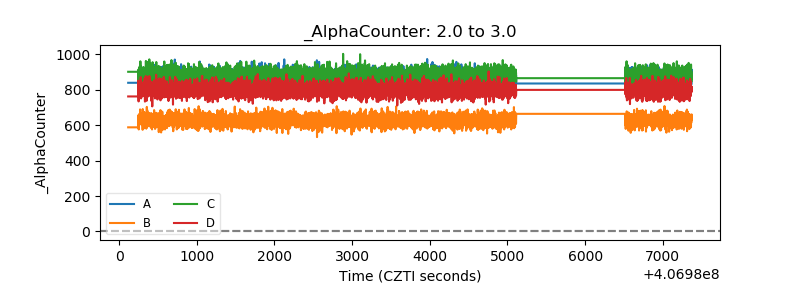 |
| _CPM_Rate | 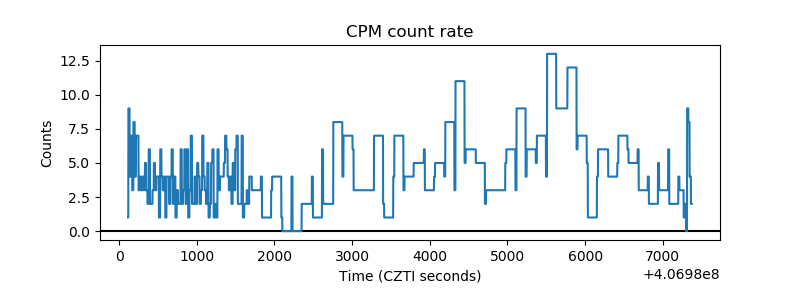 |
| CZT Counter | 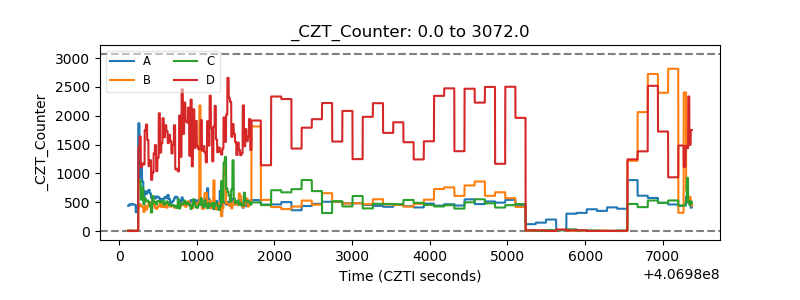 |
| +2.5 Volts monitor | 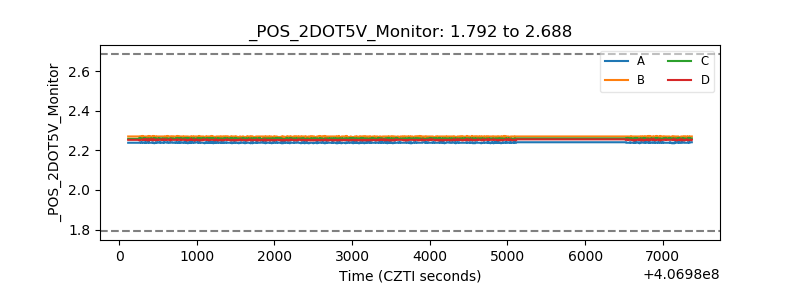 |
| +5 Volts monitor | 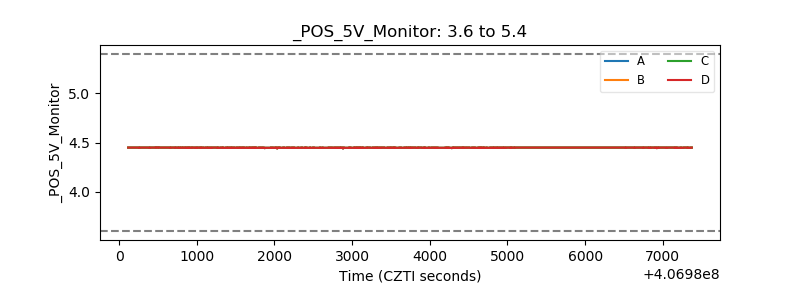 |
| _ROLL_ROT | 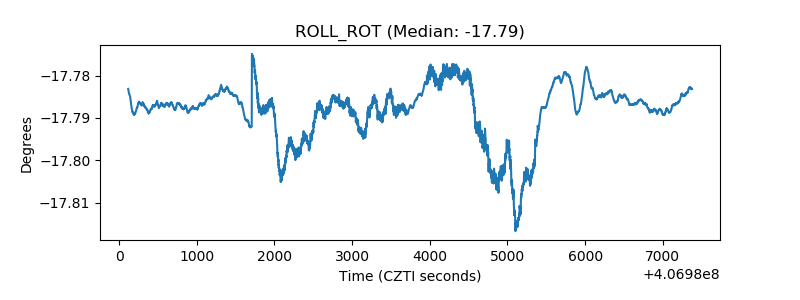 |
| _Roll_DEC | 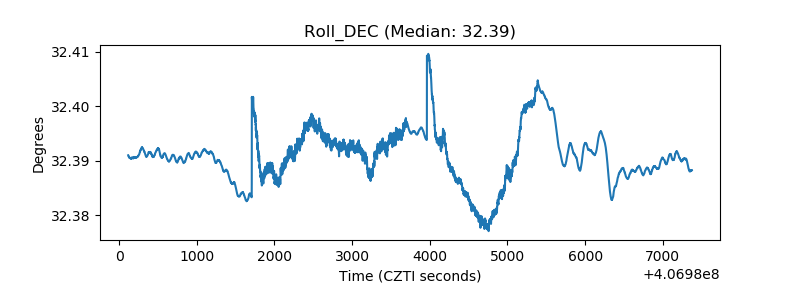 |
| _Roll_RA | 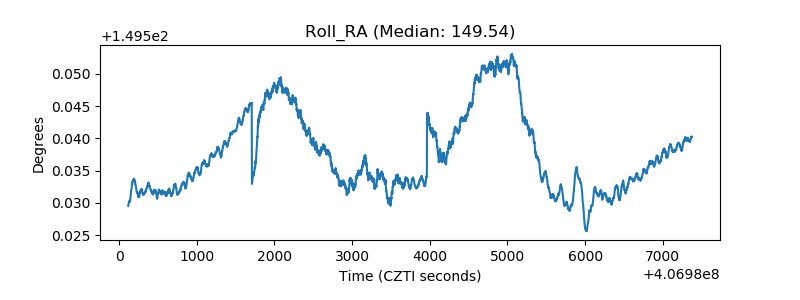 |
| Veto Counter | 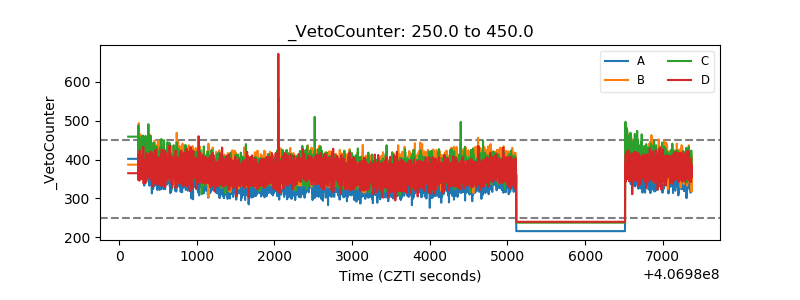 |