| Param | Original file | Final file |
|---|---|---|
| Filename | modeM0/AS1A12_054T01_9000005392_38699cztM0_level2.fits | modeM0/AS1A12_054T01_9000005392_38699cztM0_level2_quad_clean.evt |
| Size (bytes) | 644,230,080 | 87,131,520 |
| Size | 614.4 MB | 83.1 MB |
| Events in quadrant A | 3,080,098 | 666,902 |
| Events in quadrant B | 5,850,662 | 548,180 |
| Events in quadrant C | 3,322,037 | 630,595 |
| Events in quadrant D | 11,135,864 | 378,641 |
| Mode M9 | |||
|---|---|---|---|
| Quadrant | BADHDUFLAG | Total packets | Discarded packets |
| A | 0 | 22 | 0 |
| B | 0 | 22 | 0 |
| C | 0 | 22 | 0 |
| D | 0 | 23 | 0 |
| Mode SS | |||
|---|---|---|---|
| Quadrant | BADHDUFLAG | Total packets | Discarded packets |
| A | 0 | 122 | 0 |
| B | 0 | 122 | 0 |
| C | 0 | 122 | 0 |
| D | 0 | 122 | 0 |
| Mode M0 | |||
|---|---|---|---|
| Quadrant | BADHDUFLAG | Total packets | Discarded packets |
| A | 0 | 12697 | 3 |
| B | 0 | 21341 | 2 |
| C | 0 | 13469 | 2 |
| D | 0 | 37158 | 2 |
| Quadrant | Total seconds | Saturated seconds | Saturation percentage |
|---|---|---|---|
| A | 5915 | 9 | 0.152156% |
| B | 5915 | 1224 | 20.693153% |
| C | 5915 | 68 | 1.149620% |
| D | 5915 | 2725 | 46.069315% |
Noise dominated data is calculated using 1-second bins in cleaned event files. If a bin has >2000 counts, and if more than 50% of those come from <1% of pixels, then it is considered to be noise-dominated and hence unusable.
| Quadrant | # 1 sec bins | Bins with >0 counts | Bins with >2000 counts | High rate bins dominated by noise | Noise dominated (total time) | Noise dominated (detector-on time) | Marked lightcurve |
|---|---|---|---|---|---|---|---|
| A | 7229 | 5915 | 1 | 1 | 0.01% | 0.02% | 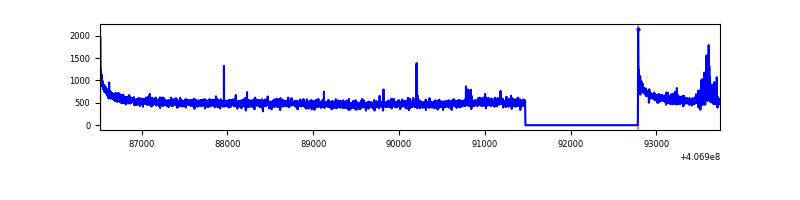 |
| B | 7229 | 5916 | 899 | 899 | 12.44% | 15.20% | 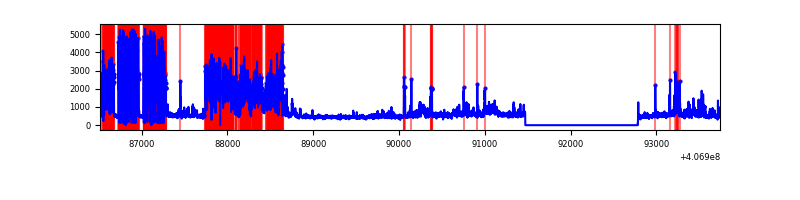 |
| C | 7229 | 5915 | 55 | 55 | 0.76% | 0.93% | 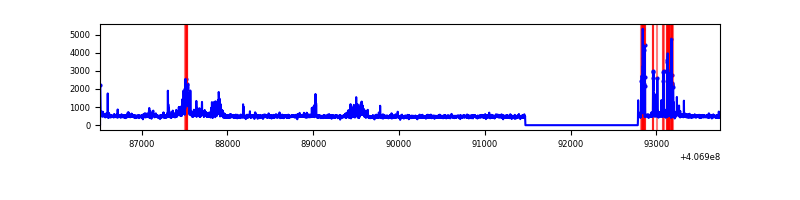 |
| D | 7229 | 5915 | 2249 | 2249 | 31.11% | 38.02% | 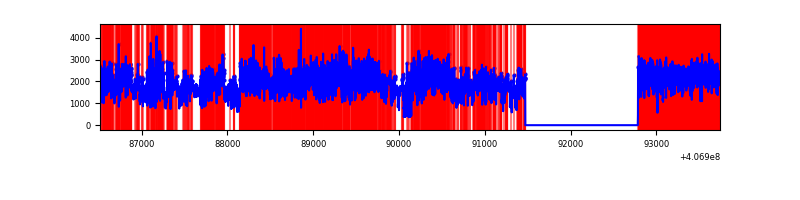 |
Top three noisy pixels from each quadrant. If the there are fewer than three noisy pixels in the level2.evt file, extra rows are filled as -1
| Pixel properties | Quadrant properties | ||||||
|---|---|---|---|---|---|---|---|
| Quadrant | DetID | PixID | Counts | Sigma | Mean | Median | Sigma |
| A | 10 | 83 | 423964 | 3080.08 | 671 | 657 | 137.4 |
| A | 13 | 248 | 34810 | 248.51 | 671 | 657 | 137.4 |
| A | 13 | 254 | 11217 | 76.84 | 671 | 657 | 137.4 |
| B | 4 | 251 | 1598703 | 14009.08 | 586 | 570 | 114.1 |
| B | 4 | 170 | 1533155 | 13434.5 | 586 | 570 | 114.1 |
| B | 4 | 171 | 190975 | 1669.07 | 586 | 570 | 114.1 |
| C | 3 | 233 | 275480 | 1802.62 | 648 | 650 | 152.5 |
| C | 15 | 208 | 253967 | 1661.52 | 648 | 650 | 152.5 |
| C | 15 | 214 | 241109 | 1577.18 | 648 | 650 | 152.5 |
| D | 2 | 16 | 8467014 | 62434.86 | 556 | 540 | 135.6 |
| D | 12 | 233 | 184756 | 1358.48 | 556 | 540 | 135.6 |
| D | 10 | 118 | 75000 | 549.1 | 556 | 540 | 135.6 |
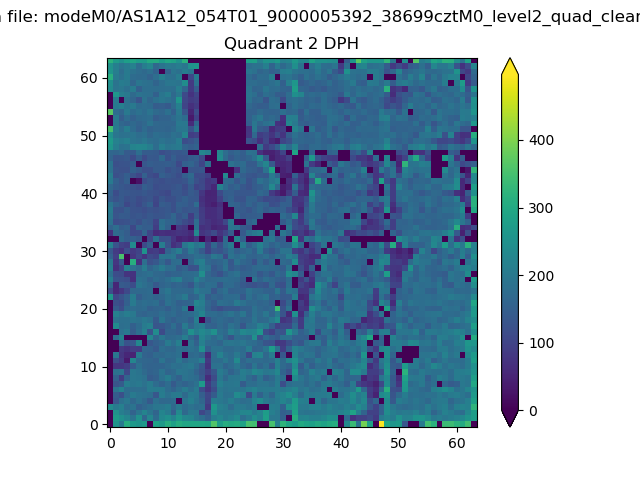
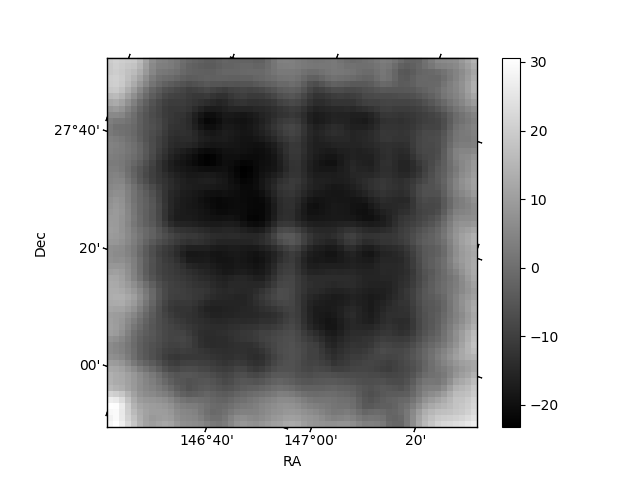
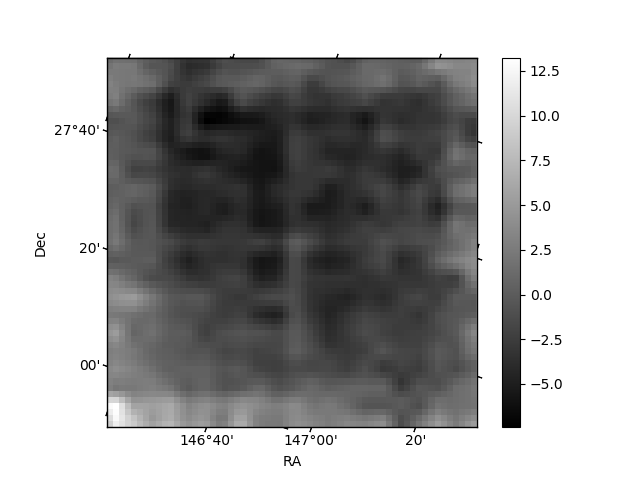
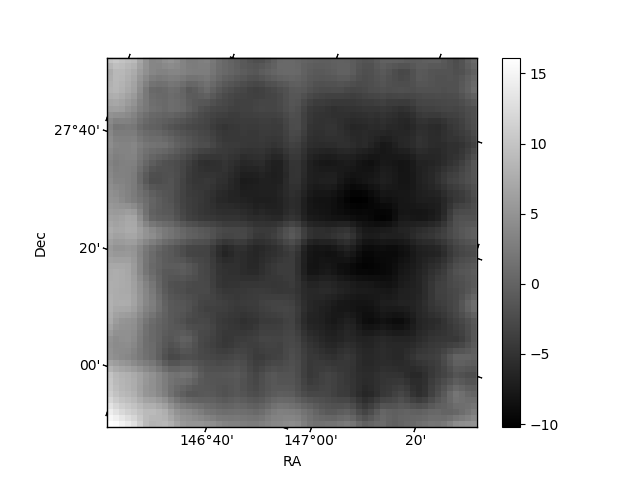
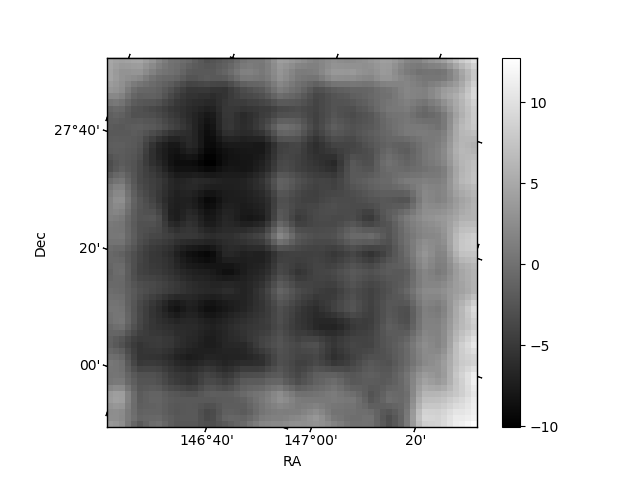
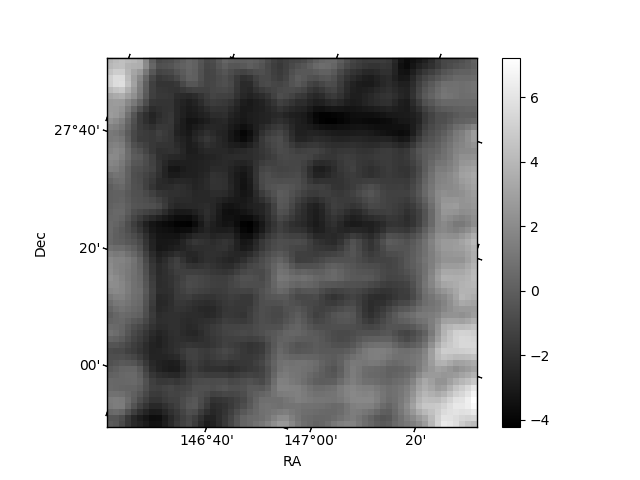
Histogram calculated using DETX and DETY for each event in the final _common_clean file
| Quadrant A | 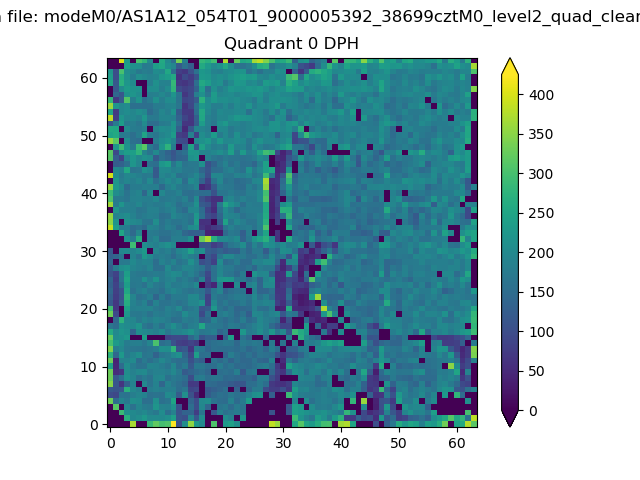 |
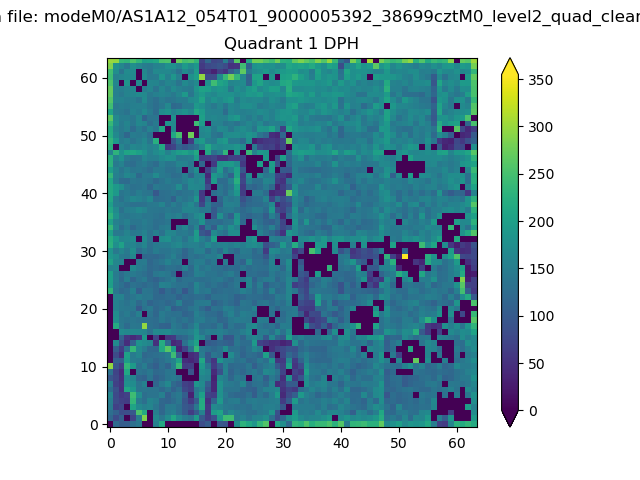 |
Quadrant B |
|---|---|---|---|
| Quadrant D | 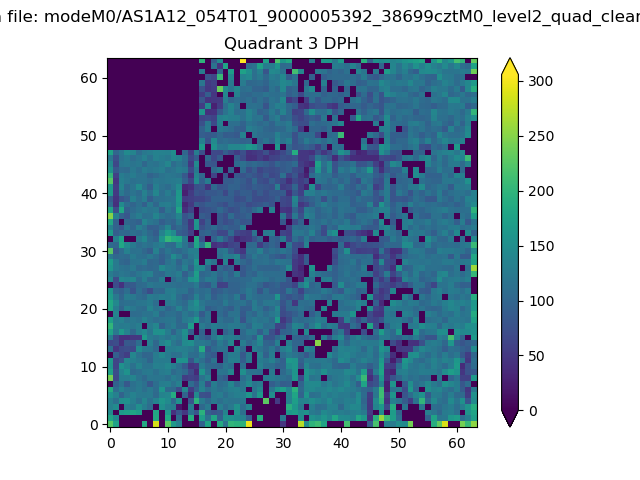 |
 |
Quadrant C |
| Plot type | Count rate plots | Images |
|---|---|---|
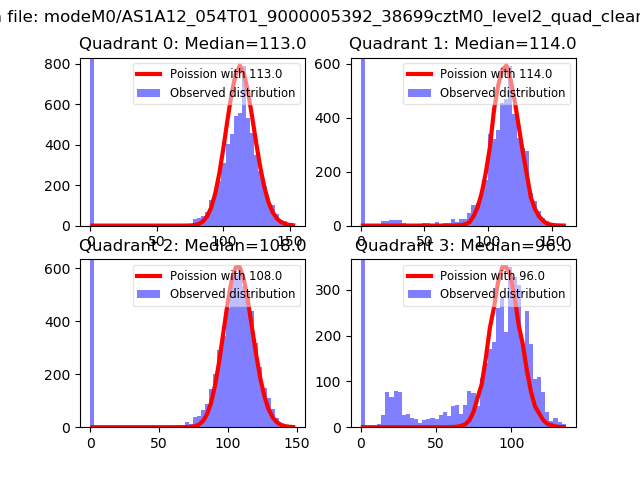
| Comparison with Poisson distribution Blue bars denote a histogram of data divided into 1 sec bins. Red curve is a Poisson curve with rate = median count rate of data. |
 |
 |
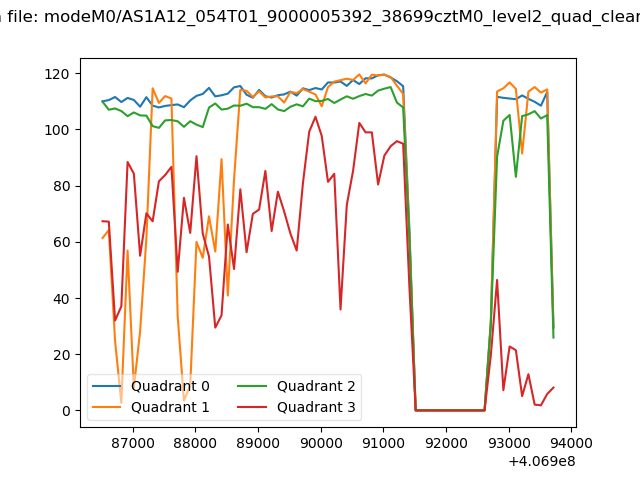
| Quadrant-wise count rates Data is divided into 100 sec bins |
 |
|
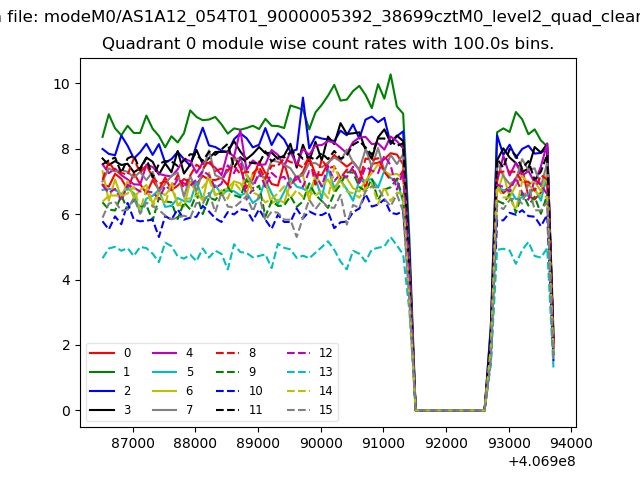
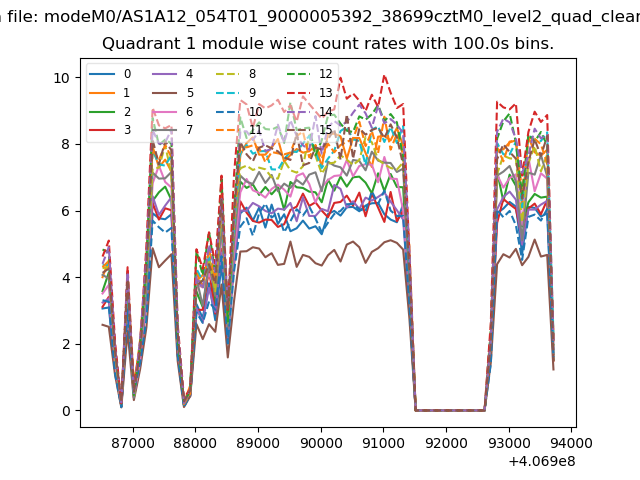
| Module-wise count rates for Quadrant A Data is divided into 100 sec bins |
 |
 |
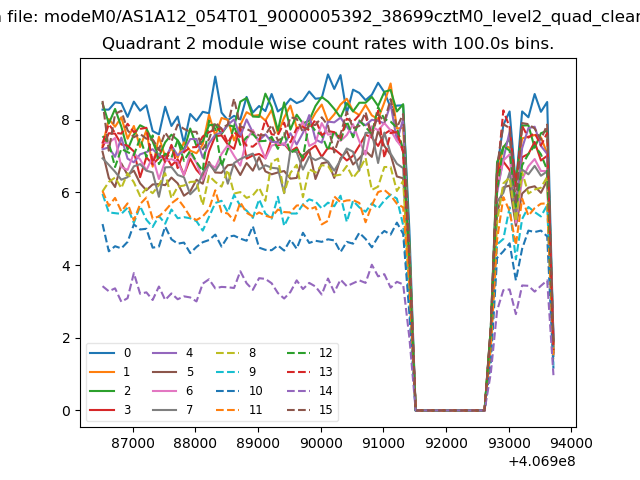
| Module-wise count rates for Quadrant B Data is divided into 100 sec bins |
 |
 |
| Module-wise count rates for Quadrant C Data is divided into 100 sec bins |
 |
 |
| Module-wise count rates for Quadrant D Data is divided into 100 sec bins |
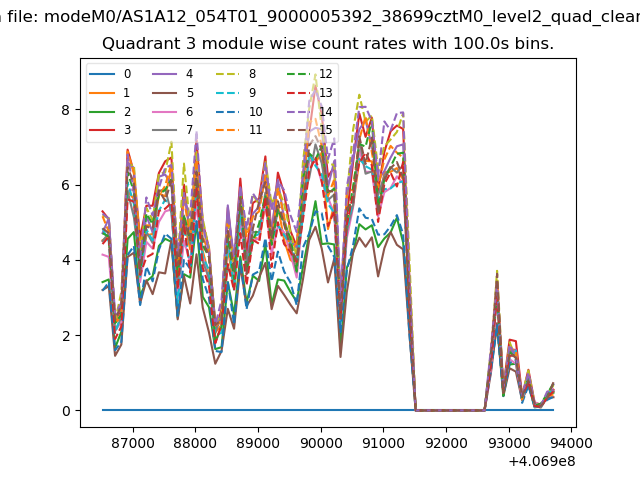 |
 |
| Parameter | Plot |
|---|---|
| CZT HV Monitor |  |
| D_VDD | 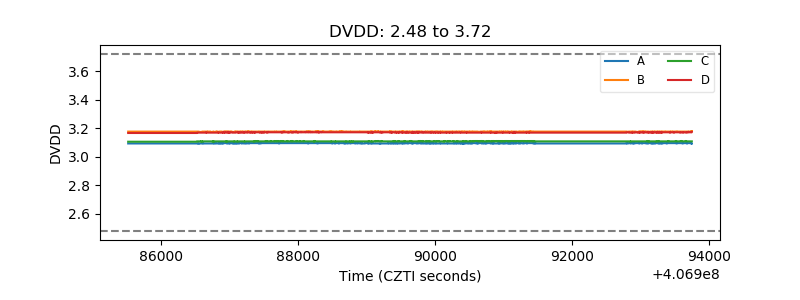 |
| Temperature 1 | 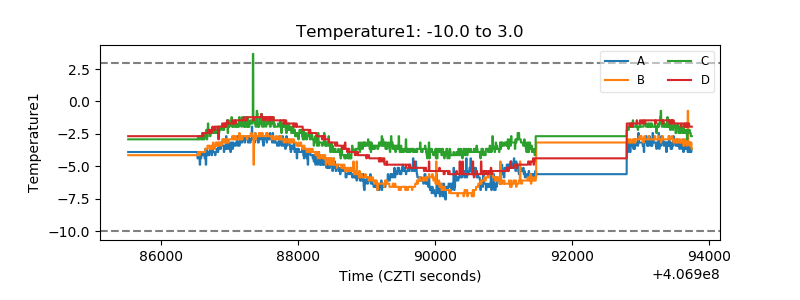 |
| Veto HV Monitor | 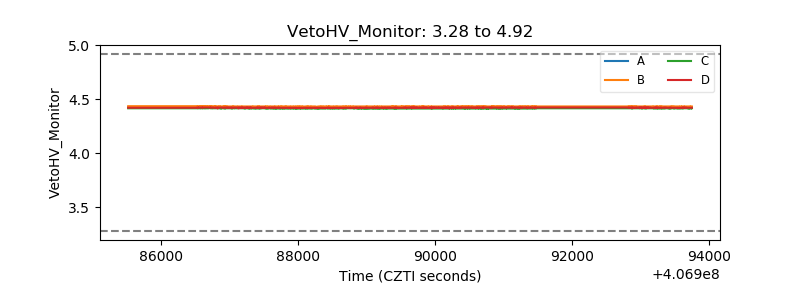 |
| Veto LLD | 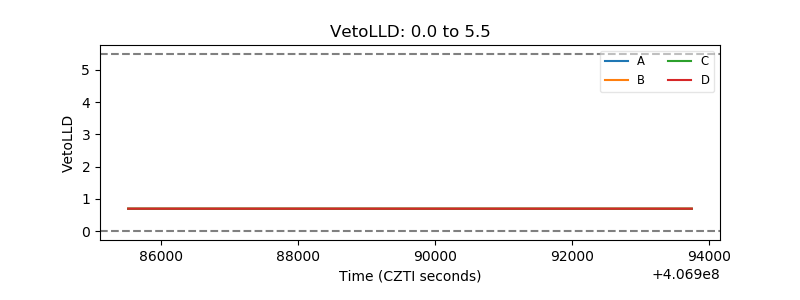 |
| Alpha Counter | 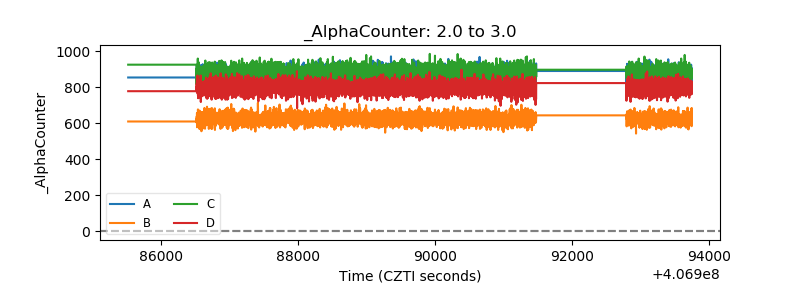 |
| _CPM_Rate | 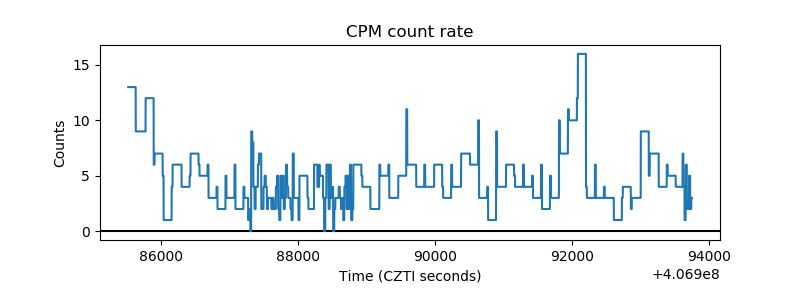 |
| CZT Counter | 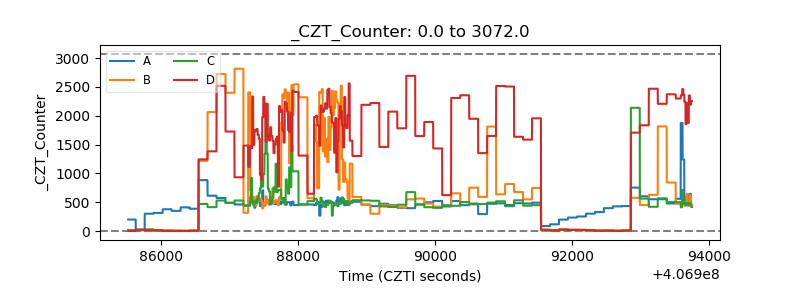 |
| +2.5 Volts monitor | 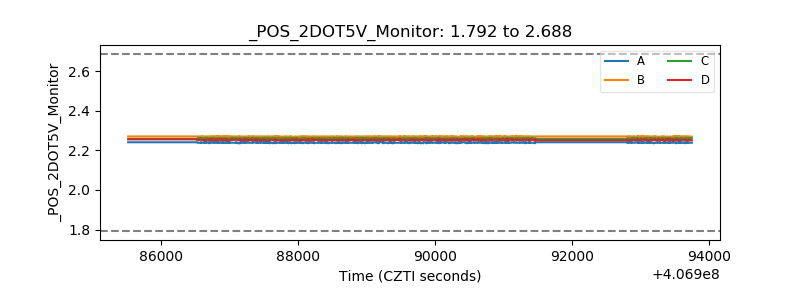 |
| +5 Volts monitor | 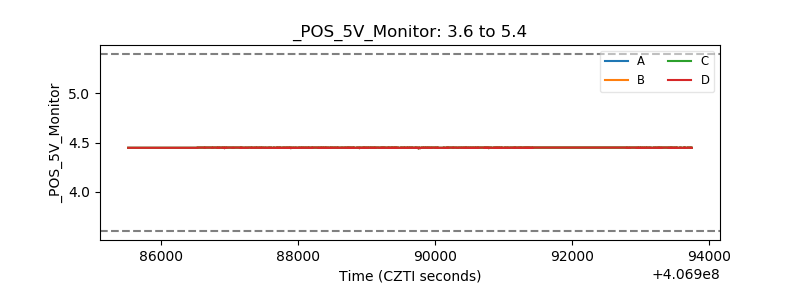 |
| _ROLL_ROT | 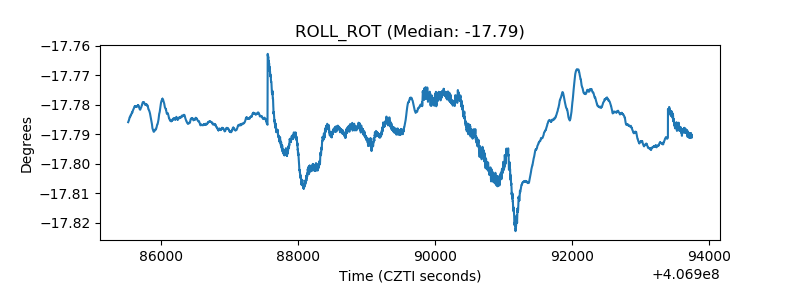 |
| _Roll_DEC | 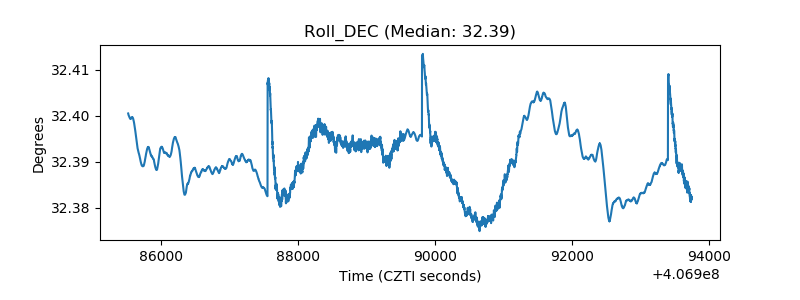 |
| _Roll_RA | 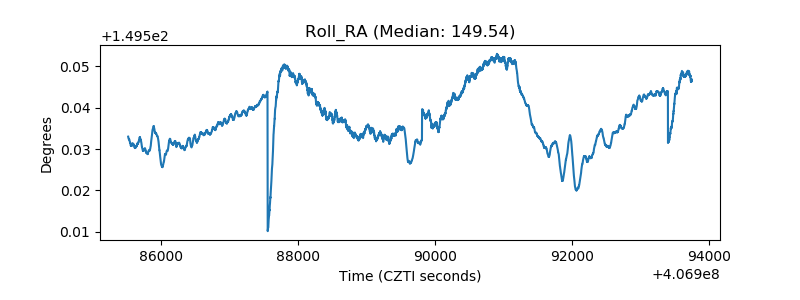 |
| Veto Counter | 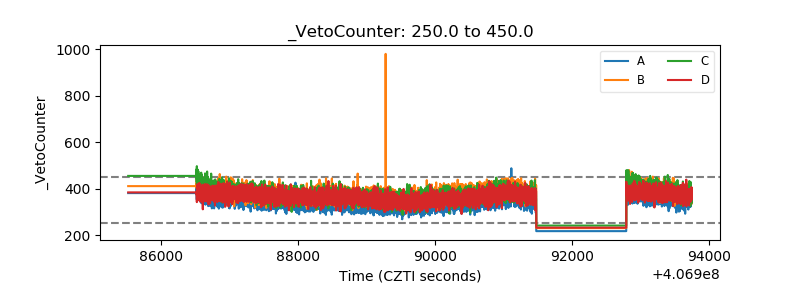 |