| Param | Original file | Final file |
|---|---|---|
| Filename | modeM0/AS1A12_054T01_9000005392_38702cztM0_level2.fits | modeM0/AS1A12_054T01_9000005392_38702cztM0_level2_quad_clean.evt |
| Size (bytes) | 1,380,254,400 | 237,692,160 |
| Size | 1.3 GB | 226.7 MB |
| Events in quadrant A | 8,006,941 | 1,740,350 |
| Events in quadrant B | 7,950,610 | 1,759,520 |
| Events in quadrant C | 7,700,201 | 1,671,671 |
| Events in quadrant D | 26,224,987 | 945,784 |
| Mode M9 | |||
|---|---|---|---|
| Quadrant | BADHDUFLAG | Total packets | Discarded packets |
| A | 0 | 52 | 0 |
| B | 0 | 52 | 0 |
| C | 0 | 52 | 0 |
| D | 0 | 53 | 0 |
| Mode SS | |||
|---|---|---|---|
| Quadrant | BADHDUFLAG | Total packets | Discarded packets |
| A | 0 | 320 | 0 |
| B | 0 | 320 | 0 |
| C | 0 | 320 | 0 |
| D | 0 | 320 | 0 |
| Mode M0 | |||
|---|---|---|---|
| Quadrant | BADHDUFLAG | Total packets | Discarded packets |
| A | 0 | 33450 | 5 |
| B | 0 | 34001 | 4 |
| C | 0 | 32632 | 4 |
| D | 0 | 88631 | 4 |
| Quadrant | Total seconds | Saturated seconds | Saturation percentage |
|---|---|---|---|
| A | 15634 | 40 | 0.255853% |
| B | 15634 | 103 | 0.658821% |
| C | 15634 | 96 | 0.614046% |
| D | 15634 | 6912 | 44.211334% |
Noise dominated data is calculated using 1-second bins in cleaned event files. If a bin has >2000 counts, and if more than 50% of those come from <1% of pixels, then it is considered to be noise-dominated and hence unusable.
| Quadrant | # 1 sec bins | Bins with >0 counts | Bins with >2000 counts | High rate bins dominated by noise | Noise dominated (total time) | Noise dominated (detector-on time) | Marked lightcurve |
|---|---|---|---|---|---|---|---|
| A | 19875 | 15637 | 14 | 14 | 0.07% | 0.09% | 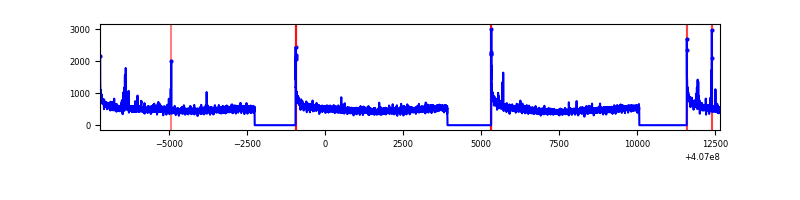 |
| B | 19875 | 15637 | 42 | 42 | 0.21% | 0.27% | 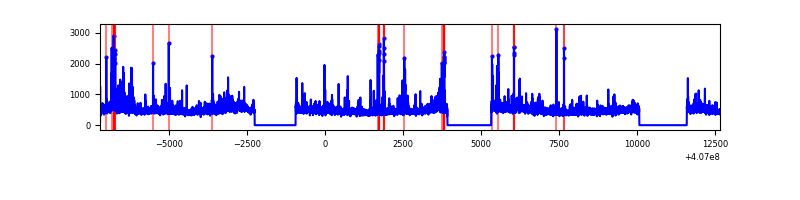 |
| C | 19875 | 15637 | 75 | 75 | 0.38% | 0.48% | 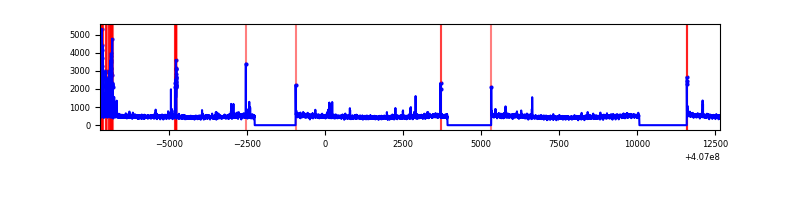 |
| D | 19875 | 15636 | 5771 | 5771 | 29.04% | 36.91% | 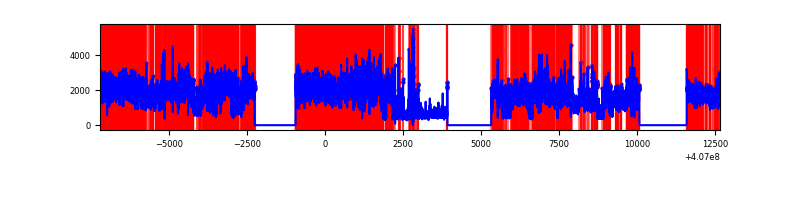 |
Top three noisy pixels from each quadrant. If the there are fewer than three noisy pixels in the level2.evt file, extra rows are filled as -1
| Pixel properties | Quadrant properties | ||||||
|---|---|---|---|---|---|---|---|
| Quadrant | DetID | PixID | Counts | Sigma | Mean | Median | Sigma |
| A | 10 | 83 | 1016218 | 2844.62 | 1763 | 1725 | 356.6 |
| A | 13 | 248 | 69941 | 191.28 | 1763 | 1725 | 356.6 |
| A | 0 | 8 | 41719 | 112.14 | 1763 | 1725 | 356.6 |
| B | 4 | 171 | 399172 | 1181.06 | 1745 | 1696 | 336.5 |
| B | 4 | 251 | 307574 | 908.89 | 1745 | 1696 | 336.5 |
| B | 0 | 213 | 218717 | 644.86 | 1745 | 1696 | 336.5 |
| C | 15 | 214 | 627101 | 1565.09 | 1712 | 1720 | 399.6 |
| C | 15 | 208 | 293952 | 731.35 | 1712 | 1720 | 399.6 |
| C | 15 | 159 | 48426 | 116.89 | 1712 | 1720 | 399.6 |
| D | 2 | 16 | 17766950 | 49438.38 | 1465 | 1425 | 359.3 |
| D | 12 | 227 | 933280 | 2593.19 | 1465 | 1425 | 359.3 |
| D | 13 | 249 | 557646 | 1547.87 | 1465 | 1425 | 359.3 |
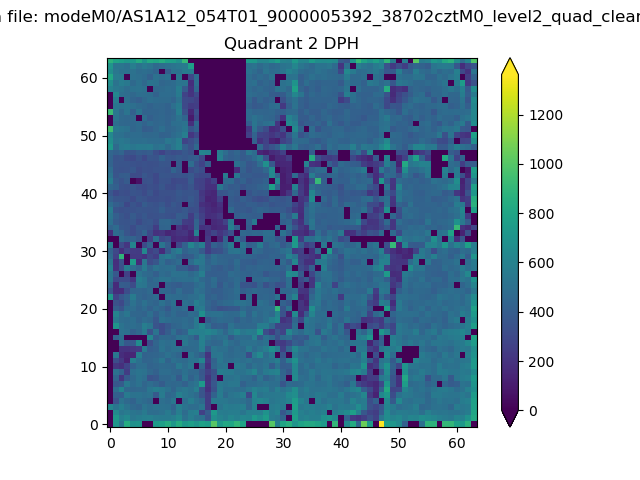
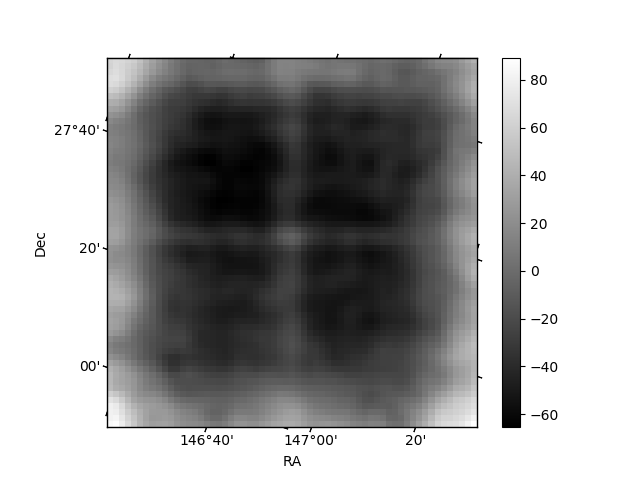
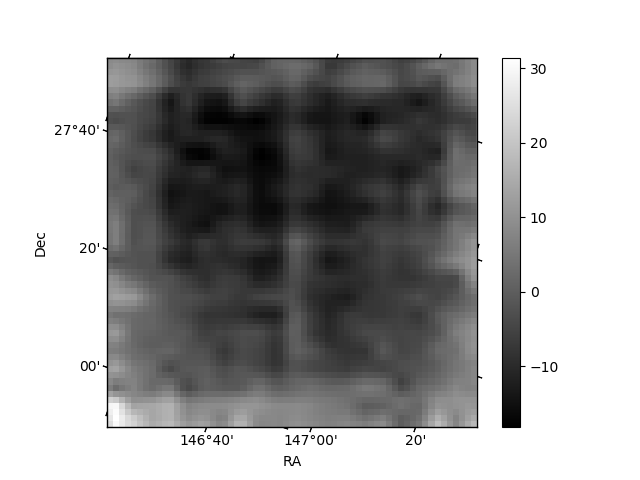
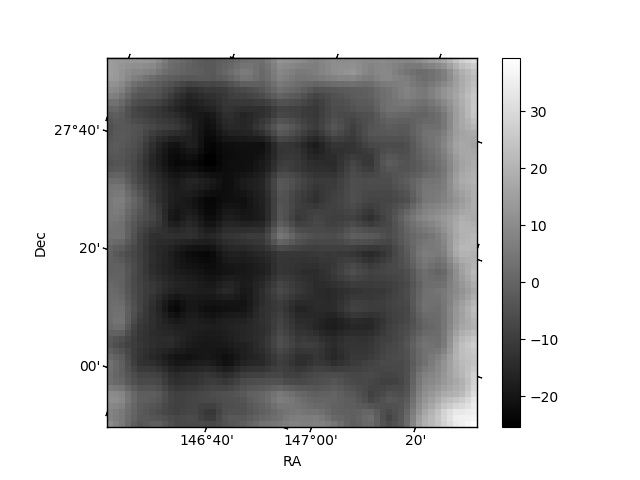
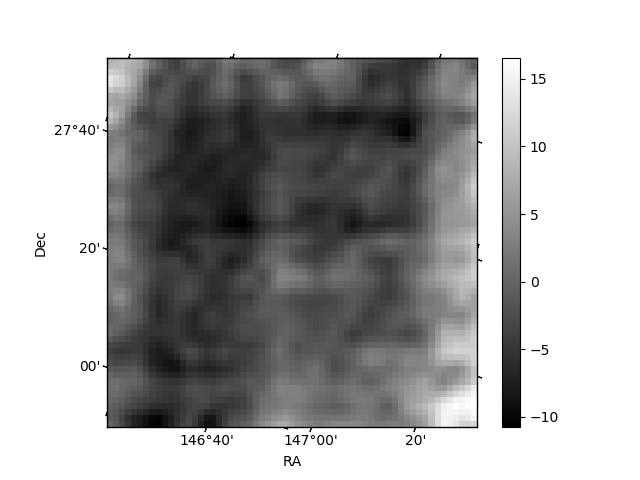
Histogram calculated using DETX and DETY for each event in the final _common_clean file
| Quadrant A | 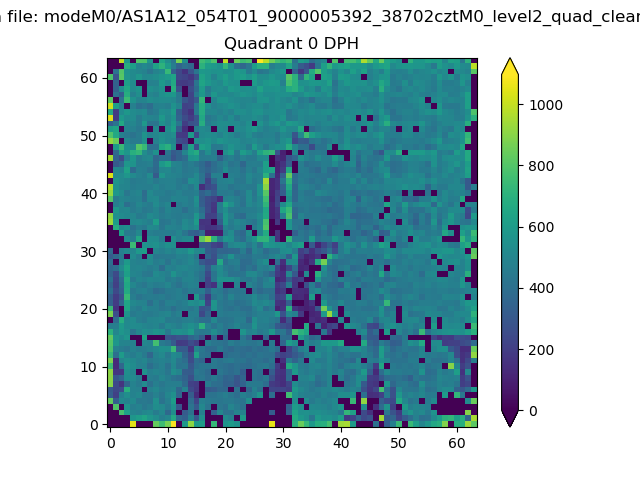 |
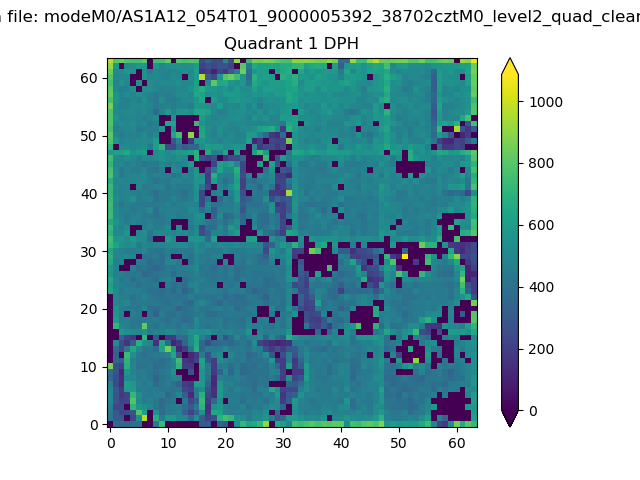 |
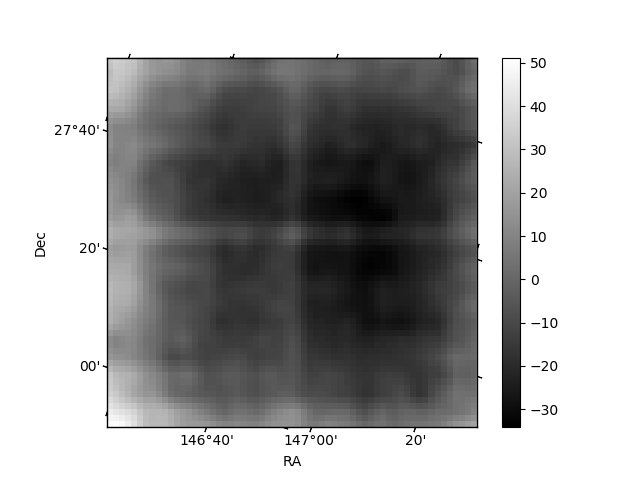
Quadrant B |
|---|---|---|---|
| Quadrant D | 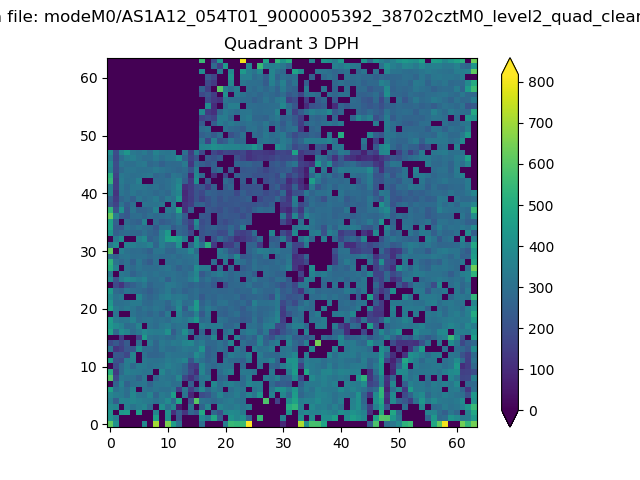 |
 |
Quadrant C |
| Plot type | Count rate plots | Images |
|---|---|---|
| Comparison with Poisson distribution Blue bars denote a histogram of data divided into 1 sec bins. Red curve is a Poisson curve with rate = median count rate of data. |
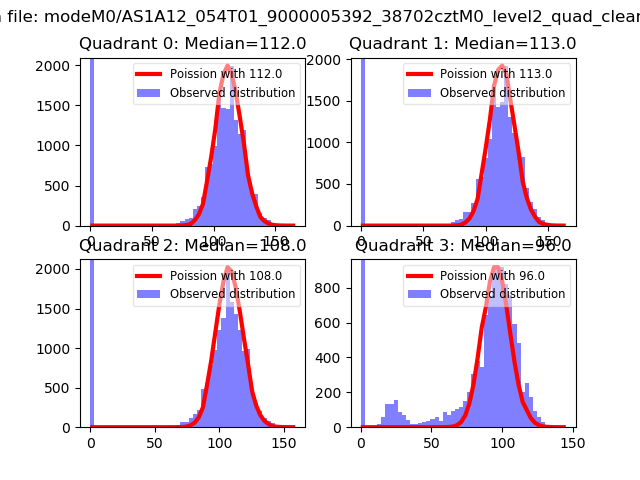 |
 |
| Quadrant-wise count rates Data is divided into 100 sec bins |
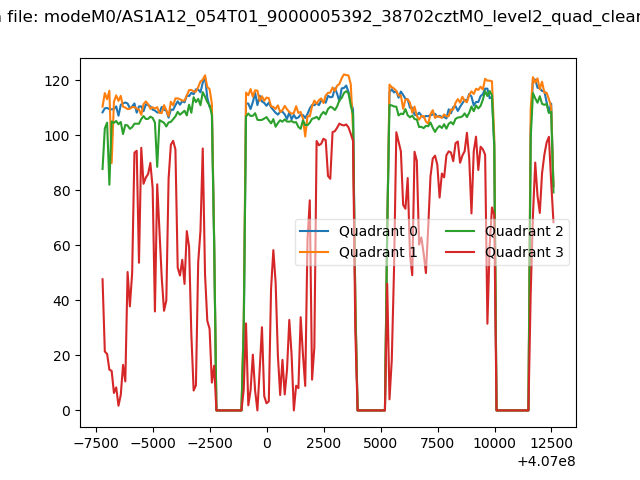 |
|
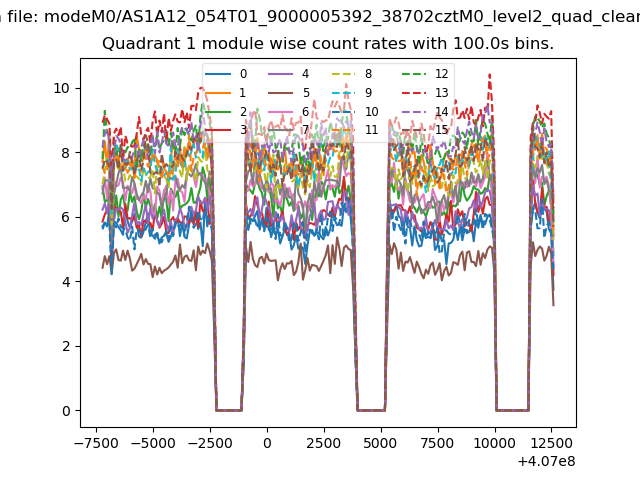
| Module-wise count rates for Quadrant A Data is divided into 100 sec bins |
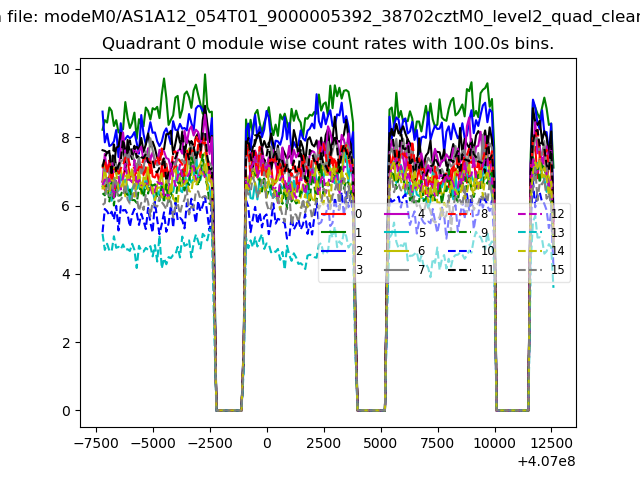 |
 |
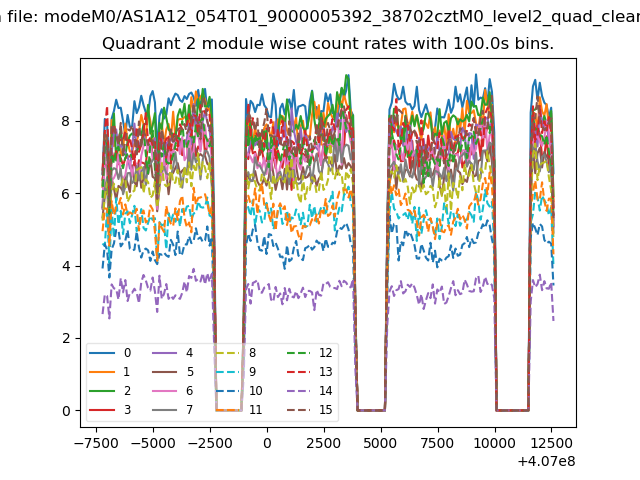
| Module-wise count rates for Quadrant B Data is divided into 100 sec bins |
 |
 |
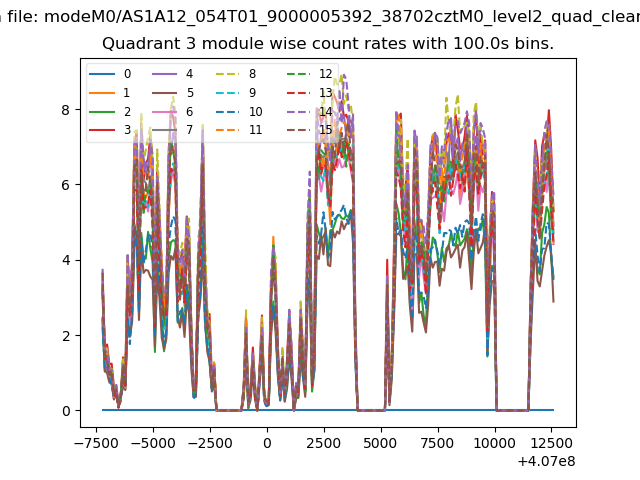
| Module-wise count rates for Quadrant C Data is divided into 100 sec bins |
 |
 |
| Module-wise count rates for Quadrant D Data is divided into 100 sec bins |
 |
 |
| Parameter | Plot |
|---|---|
| CZT HV Monitor | 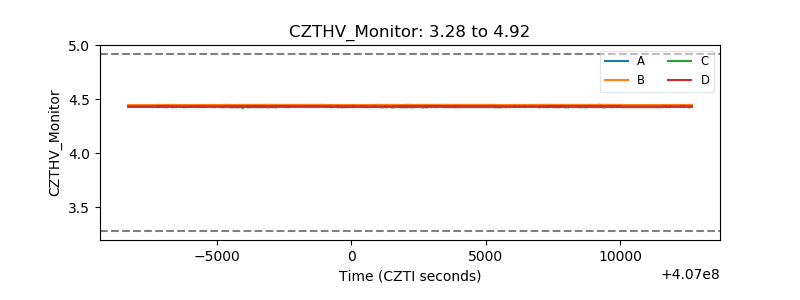 |
| D_VDD | 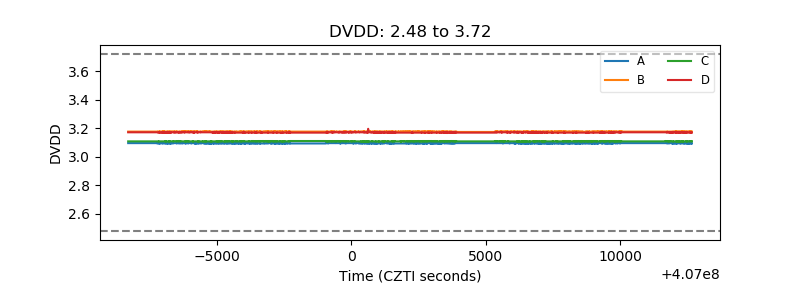 |
| Temperature 1 | 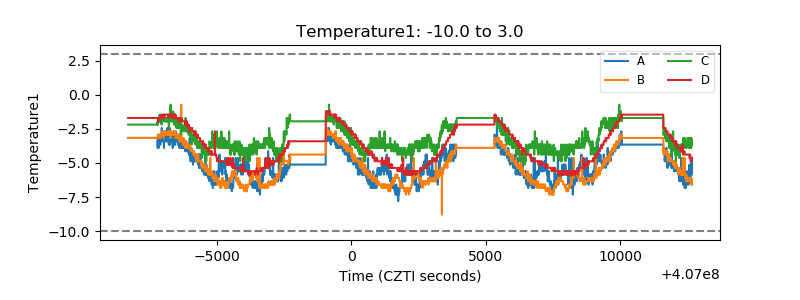 |
| Veto HV Monitor | 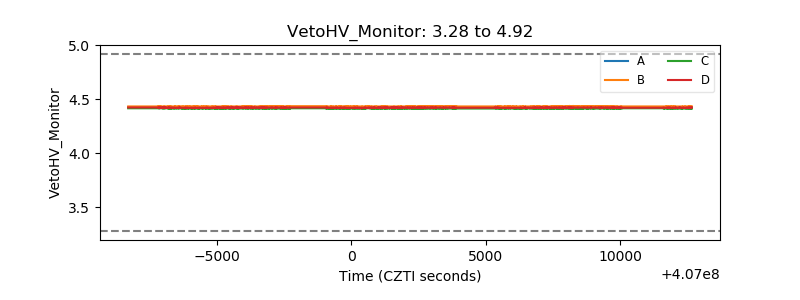 |
| Veto LLD | 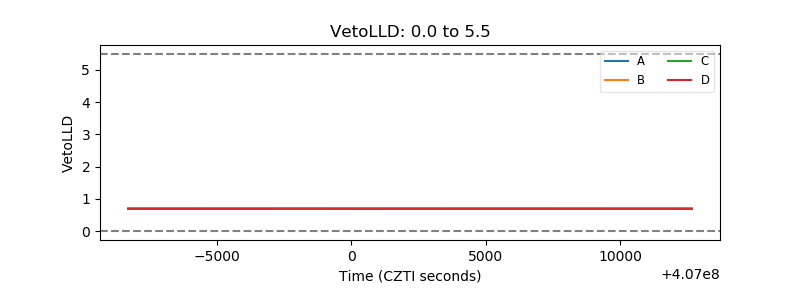 |
| Alpha Counter | 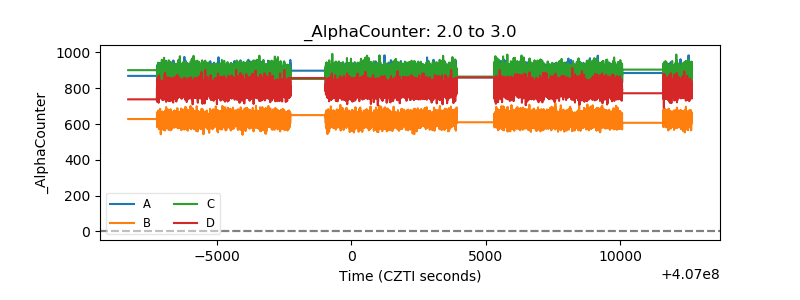 |
| _CPM_Rate | 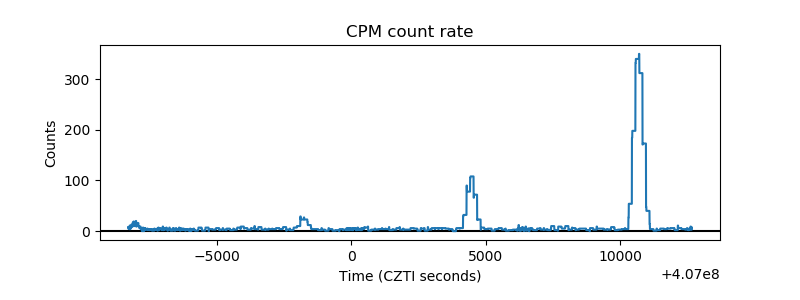 |
| CZT Counter | 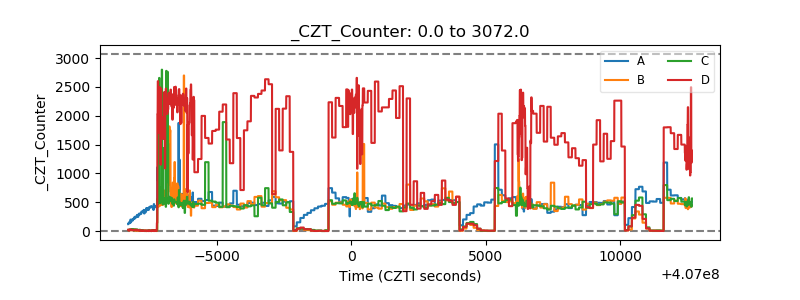 |
| +2.5 Volts monitor | 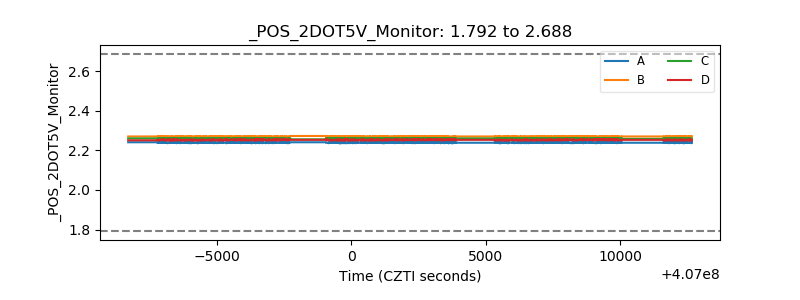 |
| +5 Volts monitor | 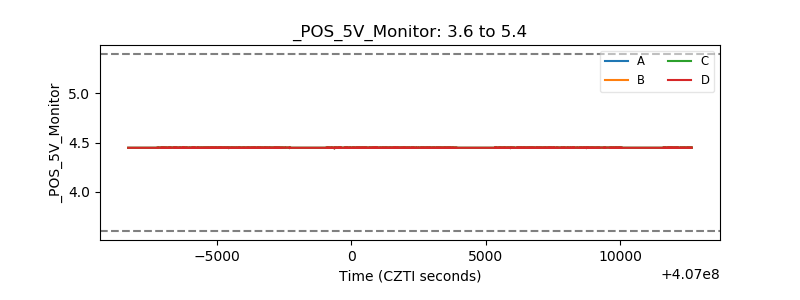 |
| _ROLL_ROT | 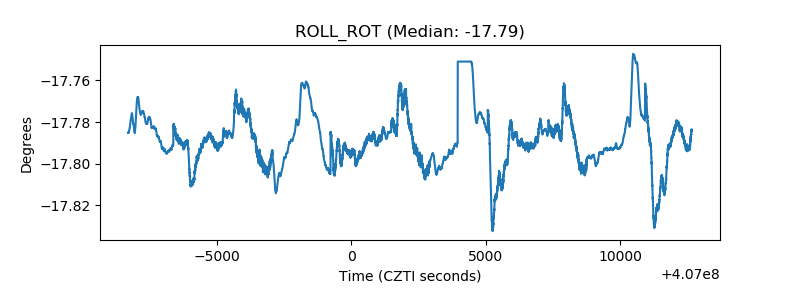 |
| _Roll_DEC | 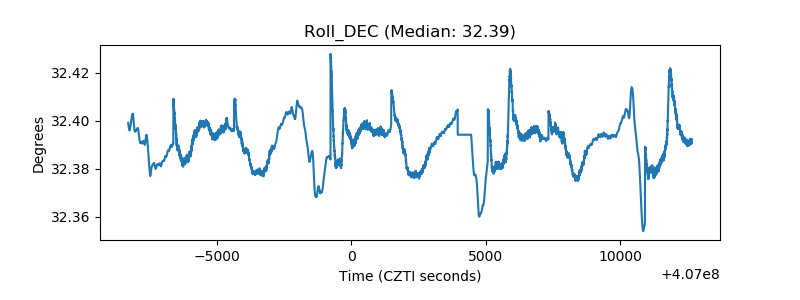 |
| _Roll_RA | 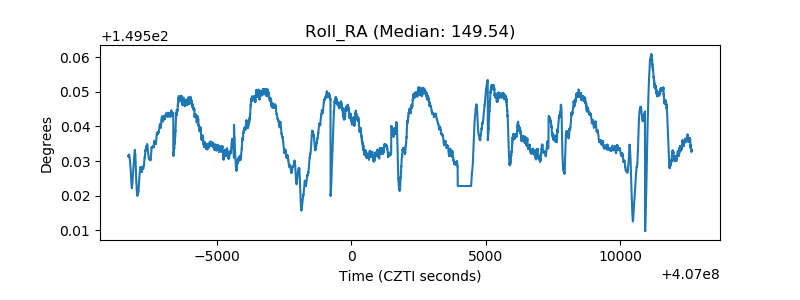 |
| Veto Counter | 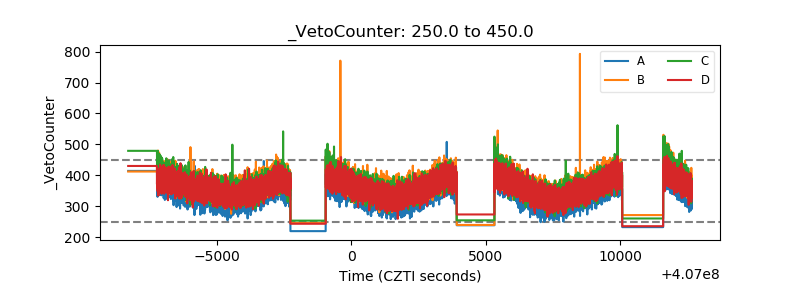 |