| Param | Original file | Final file |
|---|---|---|
| Filename | modeM0/AS1A12_054T01_9000005392_38703cztM0_level2.fits | modeM0/AS1A12_054T01_9000005392_38703cztM0_level2_quad_clean.evt |
| Size (bytes) | 471,977,280 | 91,025,280 |
| Size | 450.1 MB | 86.8 MB |
| Events in quadrant A | 2,895,233 | 628,296 |
| Events in quadrant B | 3,019,918 | 631,253 |
| Events in quadrant C | 2,648,368 | 609,398 |
| Events in quadrant D | 8,478,335 | 499,612 |
| Mode M9 | |||
|---|---|---|---|
| Quadrant | BADHDUFLAG | Total packets | Discarded packets |
| A | 0 | 19 | 0 |
| B | 0 | 19 | 0 |
| C | 0 | 19 | 0 |
| D | 0 | 20 | 0 |
| Mode SS | |||
|---|---|---|---|
| Quadrant | BADHDUFLAG | Total packets | Discarded packets |
| A | 0 | 114 | 0 |
| B | 0 | 114 | 0 |
| C | 0 | 114 | 0 |
| D | 0 | 114 | 0 |
| Mode M0 | |||
|---|---|---|---|
| Quadrant | BADHDUFLAG | Total packets | Discarded packets |
| A | 0 | 12137 | 3 |
| B | 0 | 12667 | 2 |
| C | 0 | 11345 | 2 |
| D | 0 | 29082 | 2 |
| Quadrant | Total seconds | Saturated seconds | Saturation percentage |
|---|---|---|---|
| A | 5534 | 21 | 0.379472% |
| B | 5534 | 103 | 1.861222% |
| C | 5534 | 7 | 0.126491% |
| D | 5534 | 1029 | 18.594145% |
Noise dominated data is calculated using 1-second bins in cleaned event files. If a bin has >2000 counts, and if more than 50% of those come from <1% of pixels, then it is considered to be noise-dominated and hence unusable.
| Quadrant | # 1 sec bins | Bins with >0 counts | Bins with >2000 counts | High rate bins dominated by noise | Noise dominated (total time) | Noise dominated (detector-on time) | Marked lightcurve |
|---|---|---|---|---|---|---|---|
| A | 7177 | 5535 | 6 | 6 | 0.08% | 0.11% | 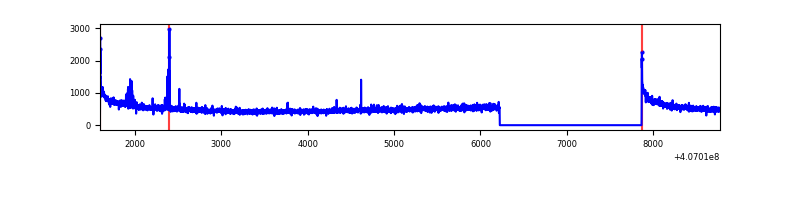 |
| B | 7177 | 5535 | 75 | 75 | 1.05% | 1.36% | 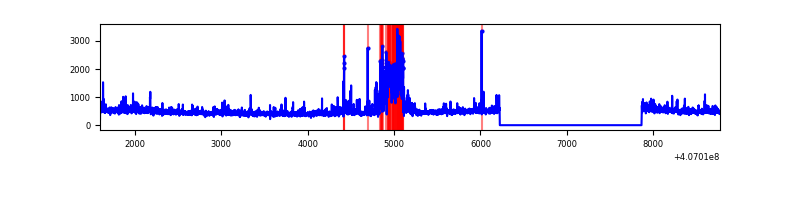 |
| C | 7177 | 5535 | 3 | 3 | 0.04% | 0.05% | 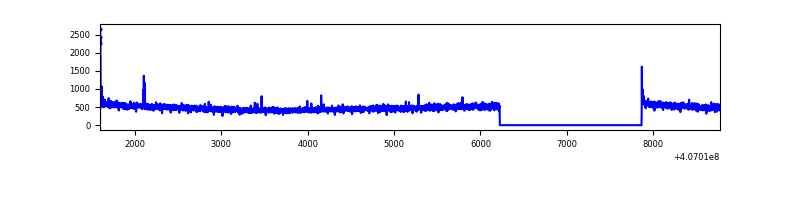 |
| D | 7177 | 5535 | 798 | 798 | 11.12% | 14.42% | 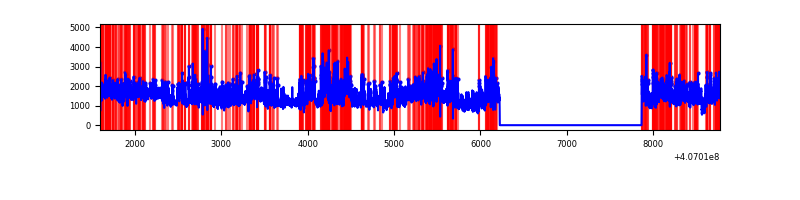 |
Top three noisy pixels from each quadrant. If the there are fewer than three noisy pixels in the level2.evt file, extra rows are filled as -1
| Pixel properties | Quadrant properties | ||||||
|---|---|---|---|---|---|---|---|
| Quadrant | DetID | PixID | Counts | Sigma | Mean | Median | Sigma |
| A | 10 | 83 | 410743 | 3208.82 | 624 | 611 | 127.8 |
| A | 13 | 248 | 30116 | 230.84 | 624 | 611 | 127.8 |
| A | 12 | 189 | 24186 | 184.45 | 624 | 611 | 127.8 |
| B | 4 | 171 | 457077 | 3770.43 | 618 | 598 | 121.1 |
| B | 4 | 251 | 90317 | 741.06 | 618 | 598 | 121.1 |
| B | 12 | 111 | 15451 | 122.68 | 618 | 598 | 121.1 |
| C | 15 | 214 | 227959 | 1596.97 | 609 | 613 | 142.4 |
| C | 0 | 10 | 25023 | 171.47 | 609 | 613 | 142.4 |
| C | 14 | 254 | 10878 | 72.11 | 609 | 613 | 142.4 |
| D | 2 | 16 | 5297850 | 36200.64 | 582 | 565 | 146.3 |
| D | 2 | 153 | 329794 | 2249.89 | 582 | 565 | 146.3 |
| D | 10 | 118 | 172183 | 1172.8 | 582 | 565 | 146.3 |
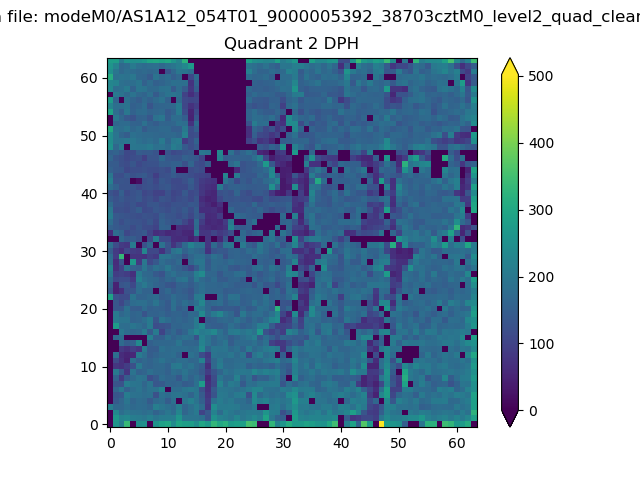
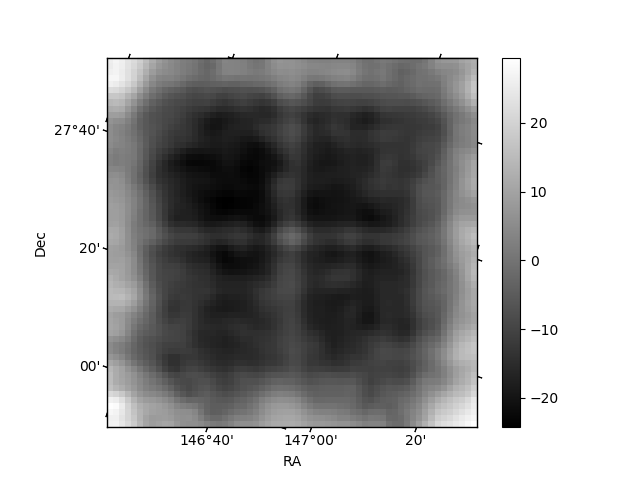
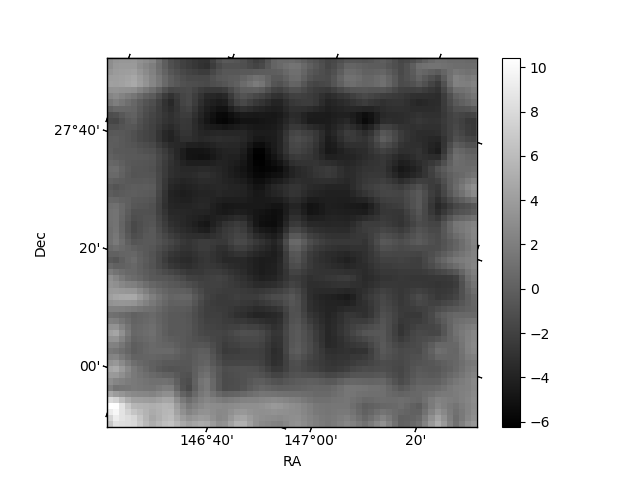
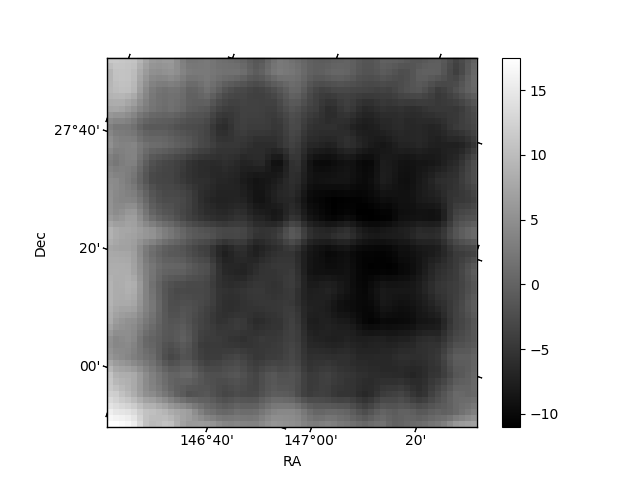
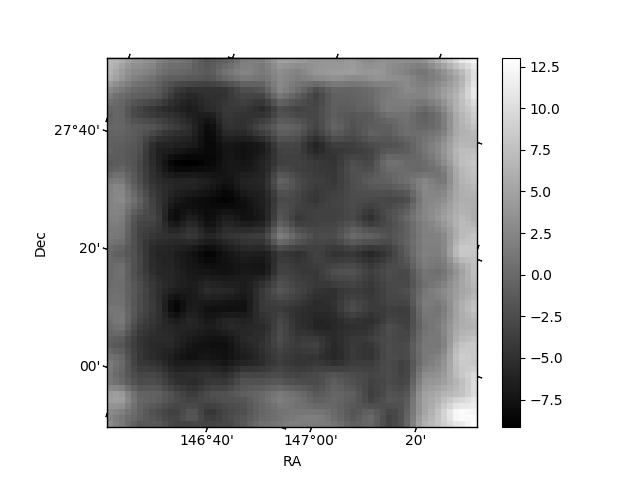
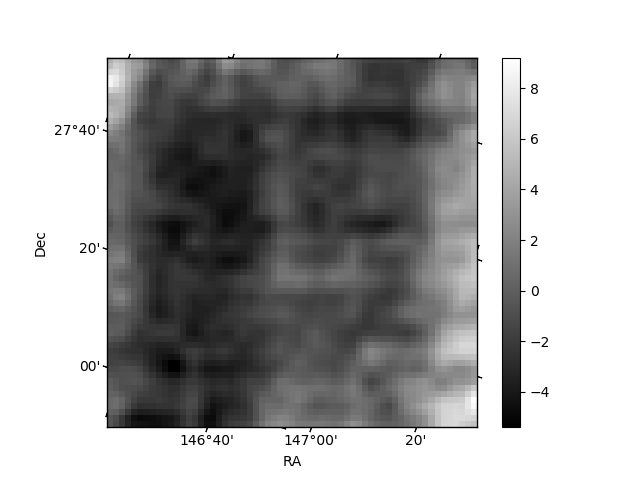
Histogram calculated using DETX and DETY for each event in the final _common_clean file
| Quadrant A | 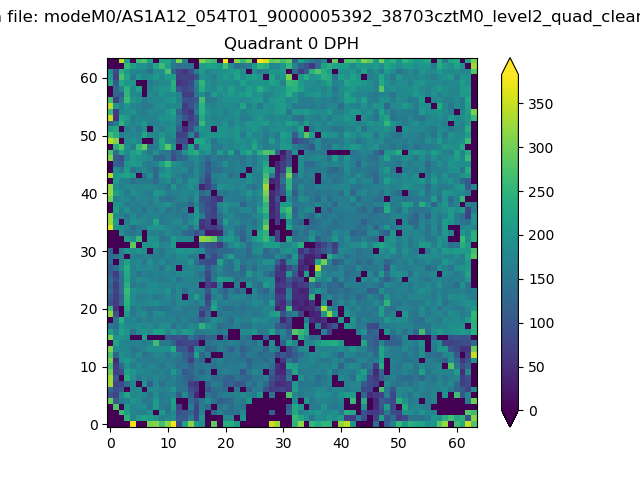 |
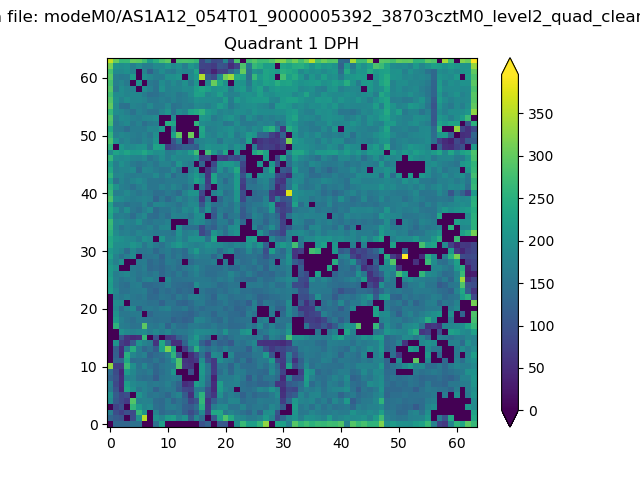 |
Quadrant B |
|---|---|---|---|
| Quadrant D | 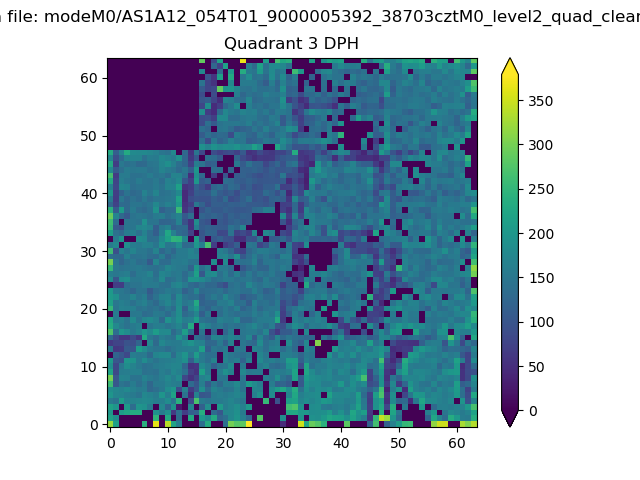 |
 |
Quadrant C |
| Plot type | Count rate plots | Images |
|---|---|---|
| Comparison with Poisson distribution Blue bars denote a histogram of data divided into 1 sec bins. Red curve is a Poisson curve with rate = median count rate of data. |
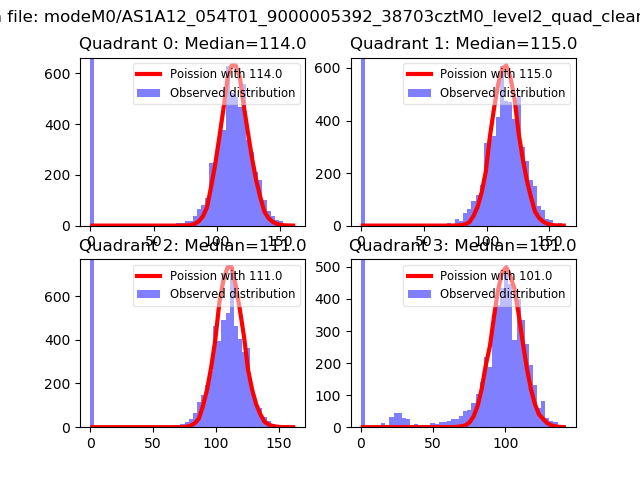 |
 |
| Quadrant-wise count rates Data is divided into 100 sec bins |
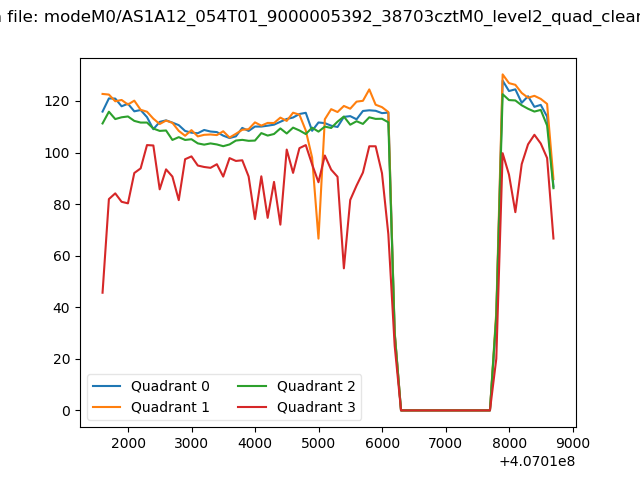 |
|
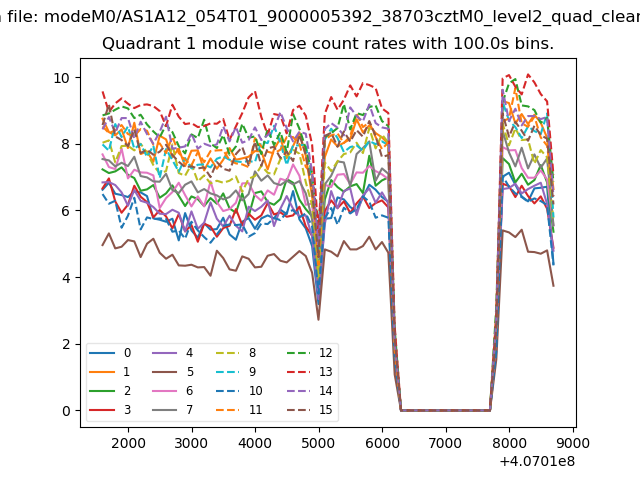
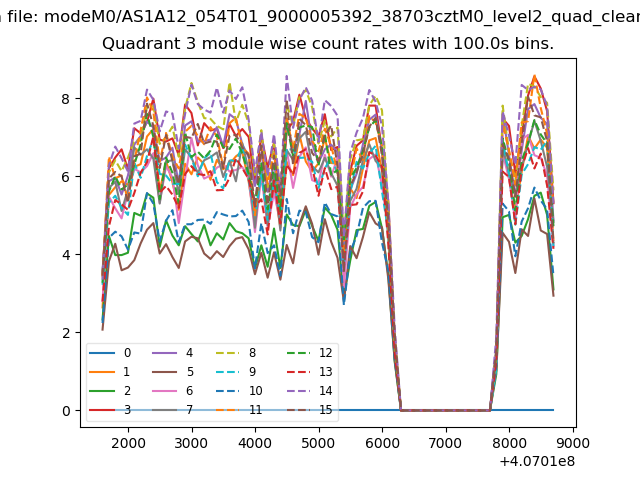
| Module-wise count rates for Quadrant A Data is divided into 100 sec bins |
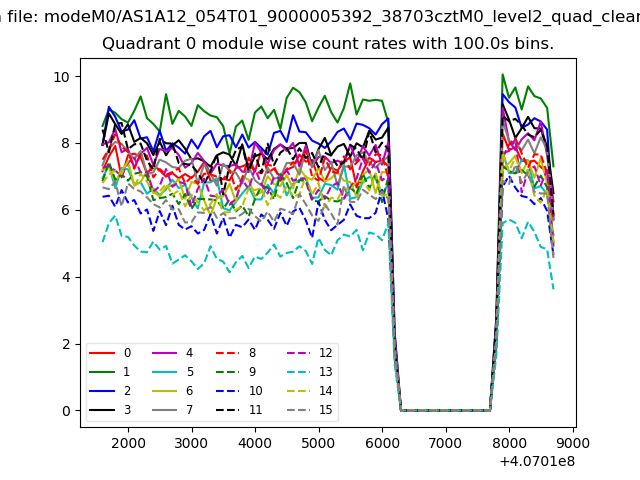 |
 |
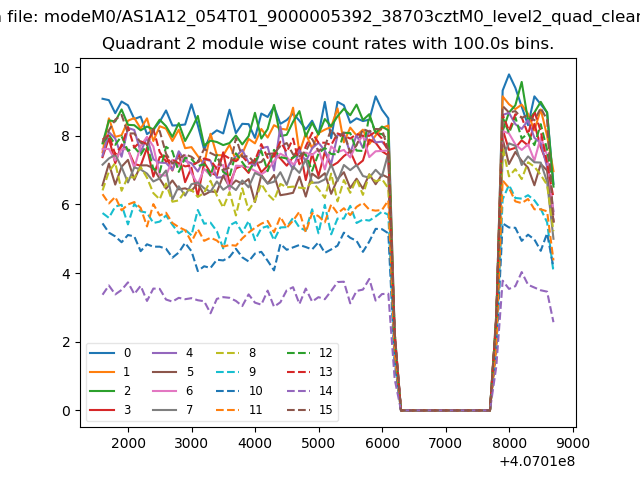
| Module-wise count rates for Quadrant B Data is divided into 100 sec bins |
 |
 |
| Module-wise count rates for Quadrant C Data is divided into 100 sec bins |
 |
 |
| Module-wise count rates for Quadrant D Data is divided into 100 sec bins |
 |
 |
| Parameter | Plot |
|---|---|
| CZT HV Monitor | 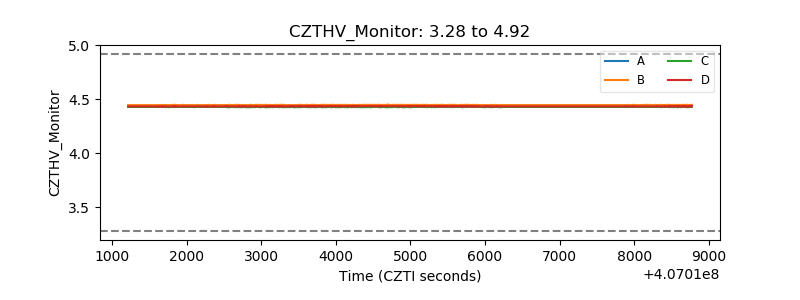 |
| D_VDD | 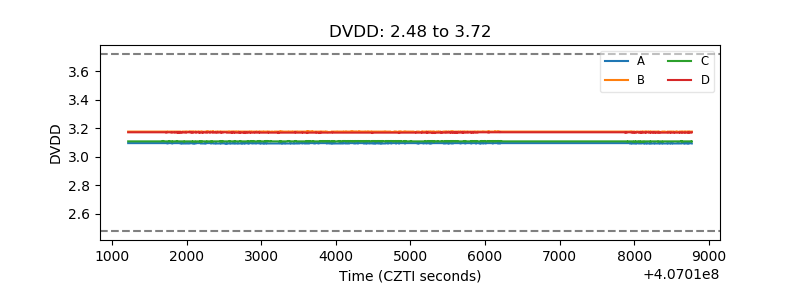 |
| Temperature 1 | 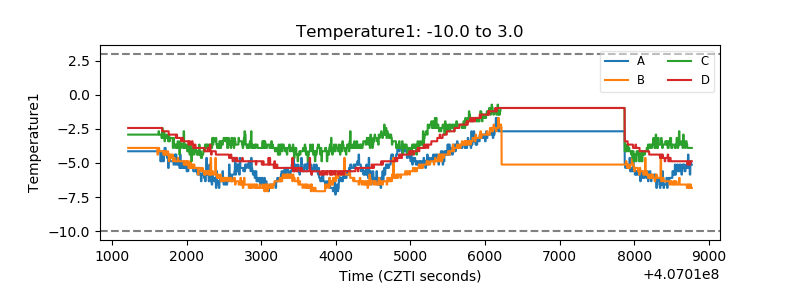 |
| Veto HV Monitor | 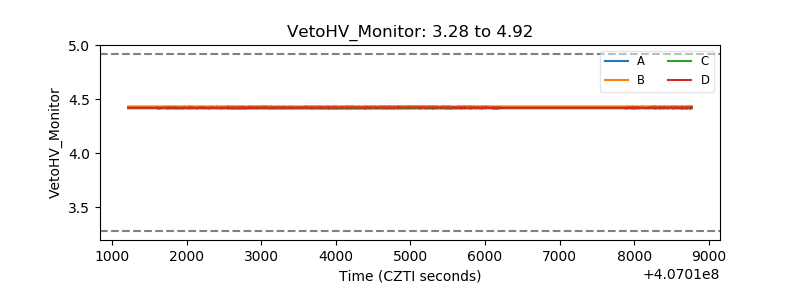 |
| Veto LLD | 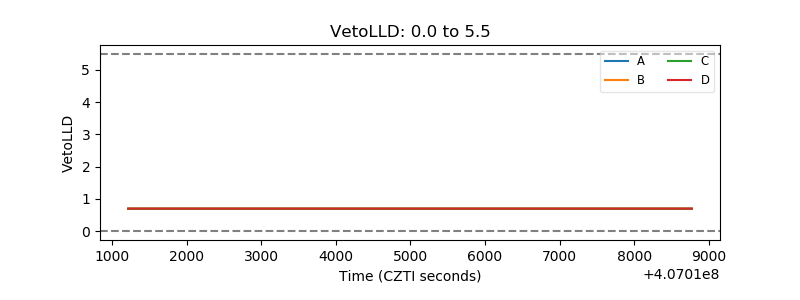 |
| Alpha Counter | 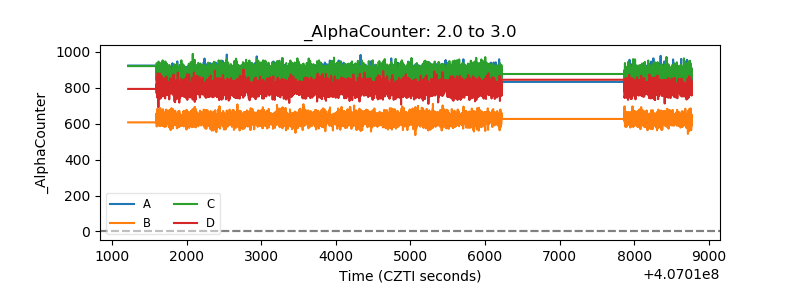 |
| _CPM_Rate |  |
| CZT Counter | 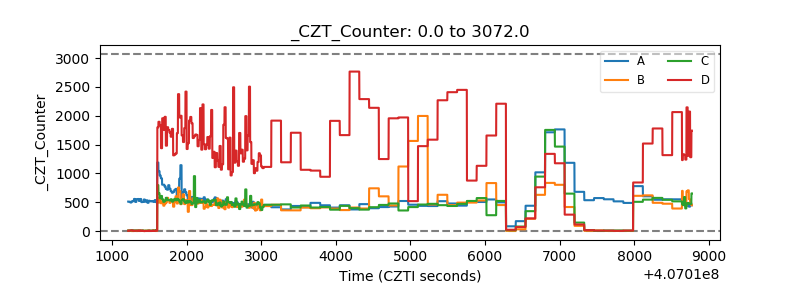 |
| +2.5 Volts monitor | 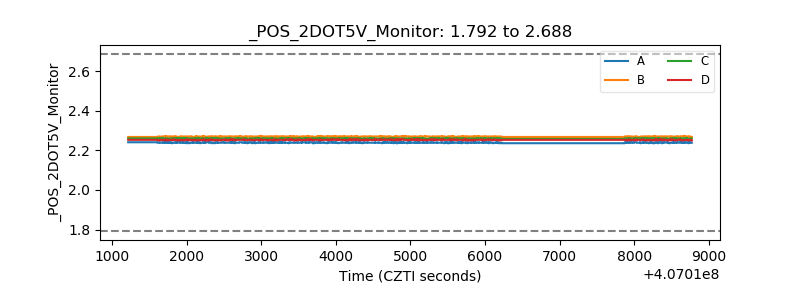 |
| +5 Volts monitor | 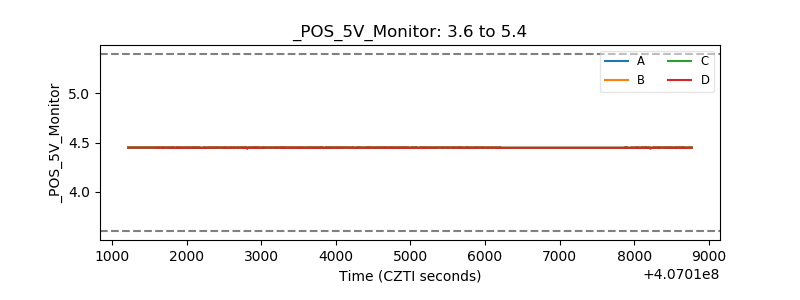 |
| _ROLL_ROT | 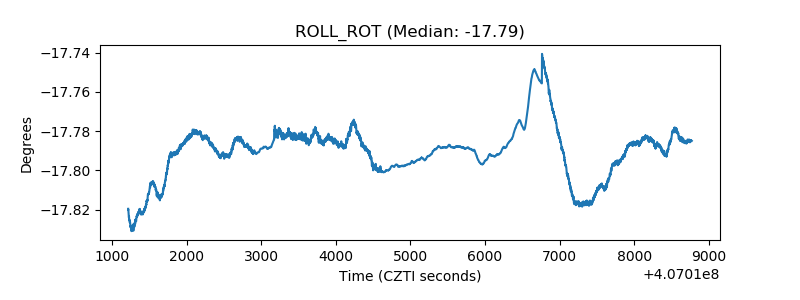 |
| _Roll_DEC | 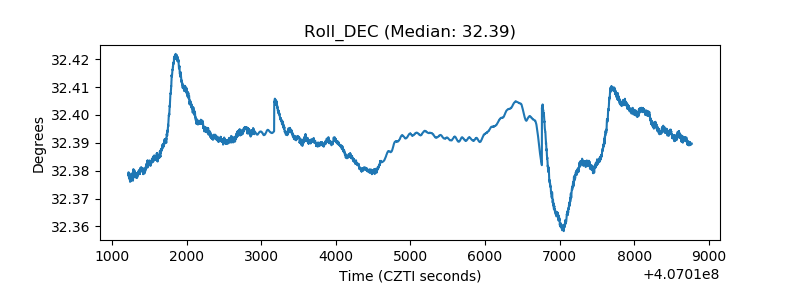 |
| _Roll_RA | 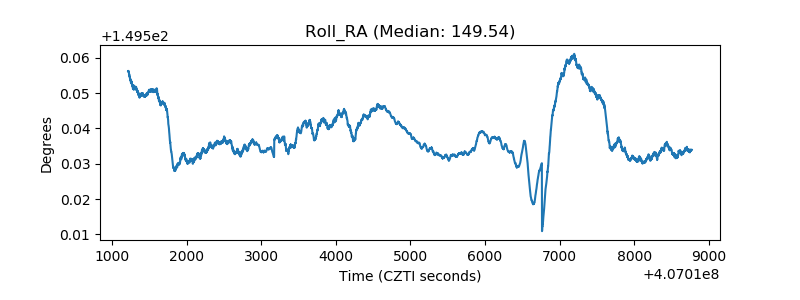 |
| Veto Counter | 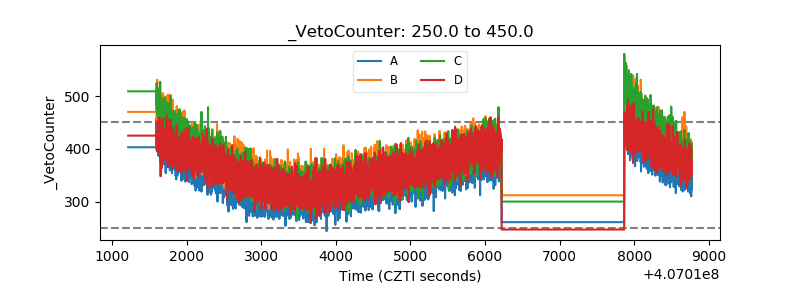 |