| Param | Original file | Final file |
|---|---|---|
| Filename | modeM0/AS1A12_054T01_9000005392_38705cztM0_level2.fits | modeM0/AS1A12_054T01_9000005392_38705cztM0_level2_quad_clean.evt |
| Size (bytes) | 500,938,560 | 88,729,920 |
| Size | 477.7 MB | 84.6 MB |
| Events in quadrant A | 2,810,512 | 633,207 |
| Events in quadrant B | 3,910,928 | 586,575 |
| Events in quadrant C | 2,590,672 | 615,731 |
| Events in quadrant D | 8,811,304 | 472,389 |
| Mode M9 | |||
|---|---|---|---|
| Quadrant | BADHDUFLAG | Total packets | Discarded packets |
| A | 0 | 29 | 0 |
| B | 0 | 29 | 0 |
| C | 0 | 29 | 0 |
| D | 0 | 30 | 0 |
| Mode SS | |||
|---|---|---|---|
| Quadrant | BADHDUFLAG | Total packets | Discarded packets |
| A | 0 | 110 | 0 |
| B | 0 | 110 | 0 |
| C | 0 | 110 | 0 |
| D | 0 | 110 | 0 |
| Mode M0 | |||
|---|---|---|---|
| Quadrant | BADHDUFLAG | Total packets | Discarded packets |
| A | 0 | 11802 | 3 |
| B | 0 | 15238 | 2 |
| C | 0 | 11095 | 2 |
| D | 0 | 29962 | 2 |
| Quadrant | Total seconds | Saturated seconds | Saturation percentage |
|---|---|---|---|
| A | 5408 | 12 | 0.221893% |
| B | 5408 | 527 | 9.744822% |
| C | 5408 | 2 | 0.036982% |
| D | 5408 | 1324 | 24.482249% |
Noise dominated data is calculated using 1-second bins in cleaned event files. If a bin has >2000 counts, and if more than 50% of those come from <1% of pixels, then it is considered to be noise-dominated and hence unusable.
| Quadrant | # 1 sec bins | Bins with >0 counts | Bins with >2000 counts | High rate bins dominated by noise | Noise dominated (total time) | Noise dominated (detector-on time) | Marked lightcurve |
|---|---|---|---|---|---|---|---|
| A | 7170 | 5409 | 6 | 6 | 0.08% | 0.11% | 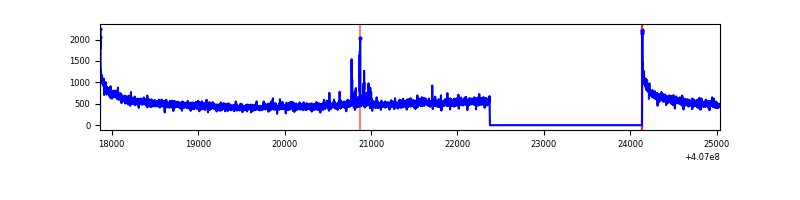 |
| B | 7169 | 5408 | 430 | 430 | 6.00% | 7.95% | 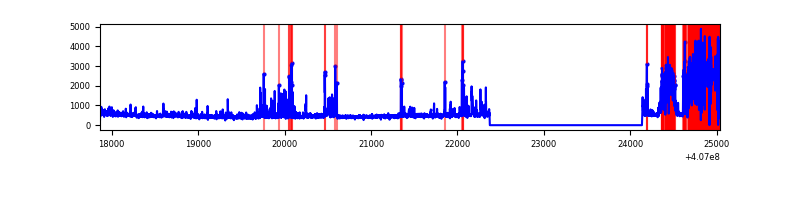 |
| C | 7170 | 5409 | 1 | 1 | 0.01% | 0.02% | 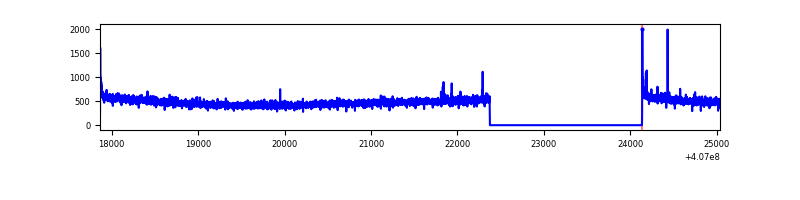 |
| D | 7170 | 5409 | 1191 | 1191 | 16.61% | 22.02% | 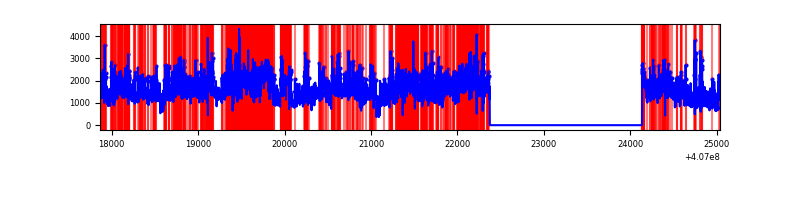 |
Top three noisy pixels from each quadrant. If the there are fewer than three noisy pixels in the level2.evt file, extra rows are filled as -1
| Pixel properties | Quadrant properties | ||||||
|---|---|---|---|---|---|---|---|
| Quadrant | DetID | PixID | Counts | Sigma | Mean | Median | Sigma |
| A | 10 | 83 | 397499 | 3159.33 | 612 | 601 | 125.6 |
| A | 7 | 3 | 30824 | 240.58 | 612 | 601 | 125.6 |
| A | 13 | 254 | 8459 | 62.55 | 612 | 601 | 125.6 |
| B | 5 | 184 | 1204839 | 10729.79 | 574 | 558 | 112.2 |
| B | 4 | 251 | 227774 | 2024.43 | 574 | 558 | 112.2 |
| B | 4 | 171 | 178288 | 1583.52 | 574 | 558 | 112.2 |
| C | 15 | 214 | 221802 | 1581.55 | 598 | 601 | 139.9 |
| C | 0 | 10 | 16594 | 114.35 | 598 | 601 | 139.9 |
| C | 15 | 208 | 6586 | 42.79 | 598 | 601 | 139.9 |
| D | 2 | 16 | 5729706 | 41624.49 | 556 | 540 | 137.6 |
| D | 12 | 235 | 259614 | 1882.27 | 556 | 540 | 137.6 |
| D | 14 | 52 | 165640 | 1199.51 | 556 | 540 | 137.6 |
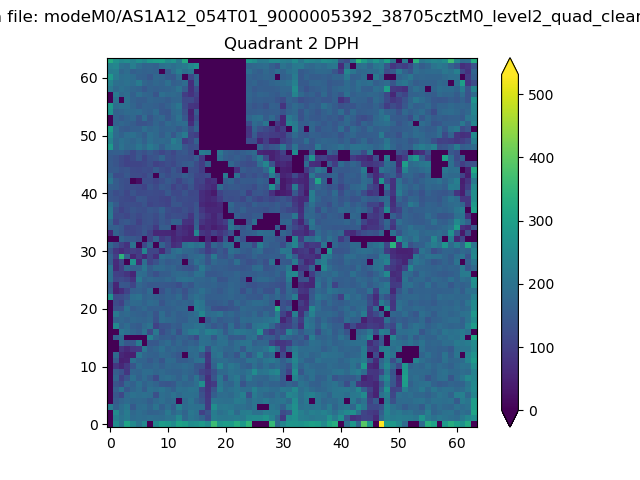
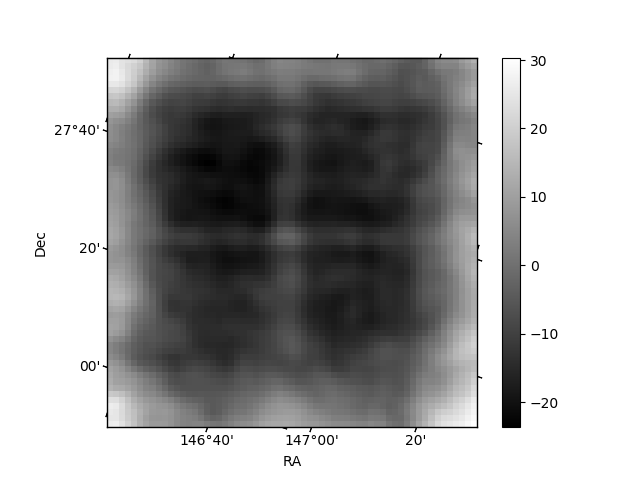
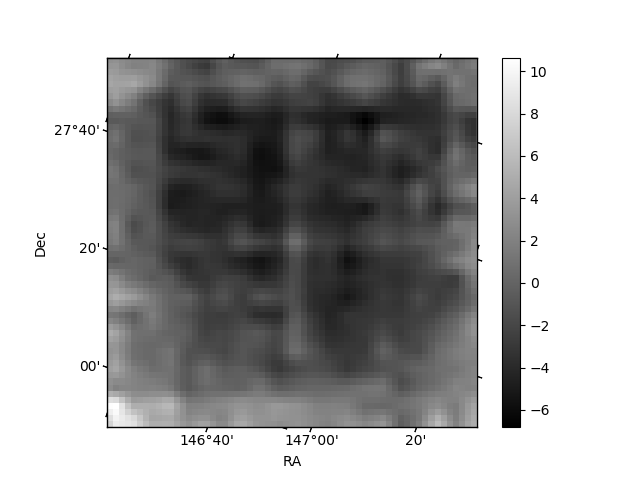
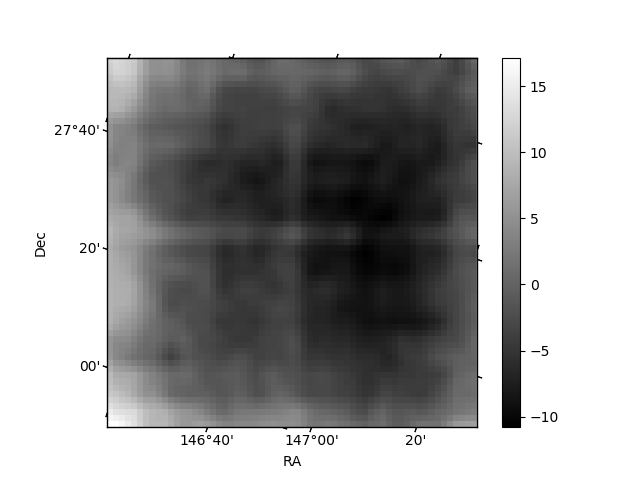
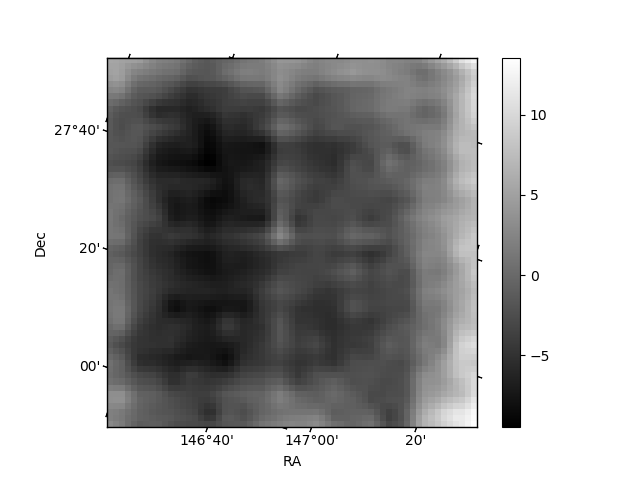
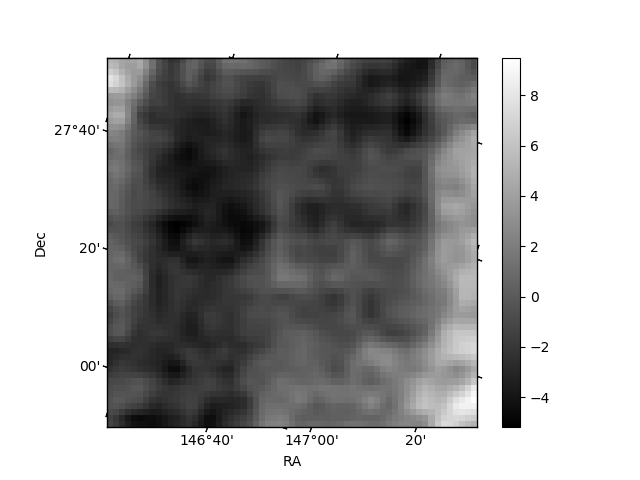
Histogram calculated using DETX and DETY for each event in the final _common_clean file
| Quadrant A | 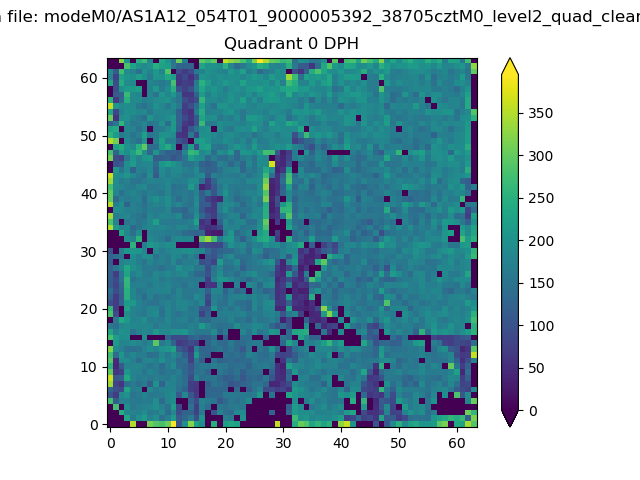 |
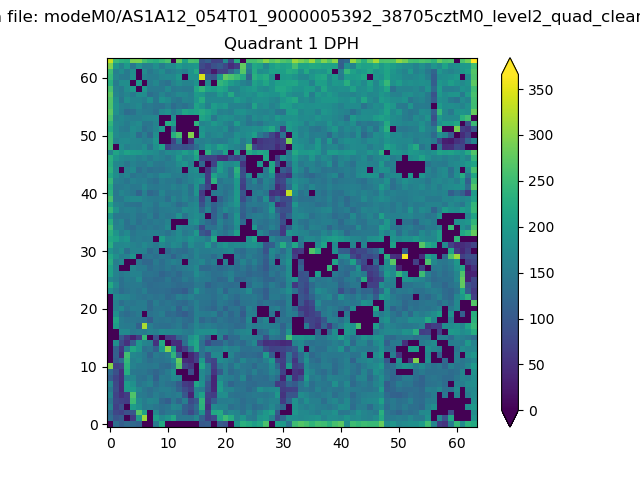 |
Quadrant B |
|---|---|---|---|
| Quadrant D | 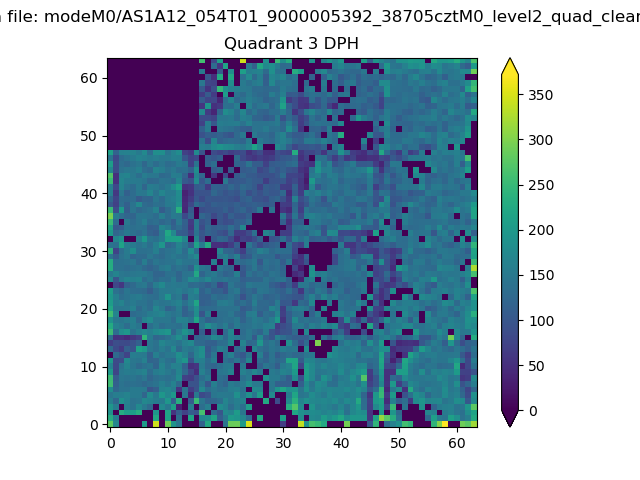 |
 |
Quadrant C |
| Plot type | Count rate plots | Images |
|---|---|---|
| Comparison with Poisson distribution Blue bars denote a histogram of data divided into 1 sec bins. Red curve is a Poisson curve with rate = median count rate of data. |
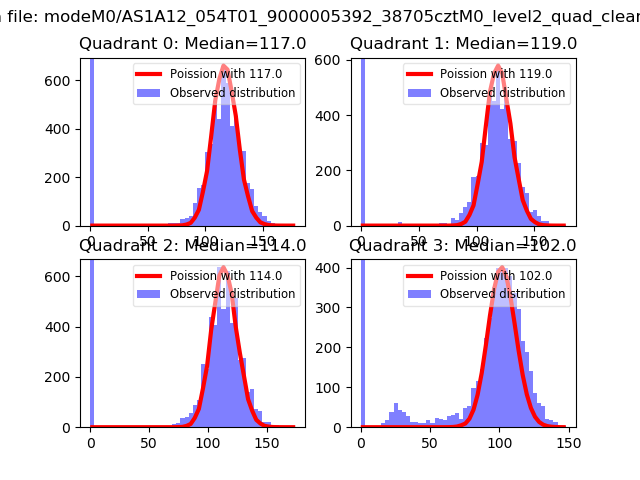 |
 |
| Quadrant-wise count rates Data is divided into 100 sec bins |
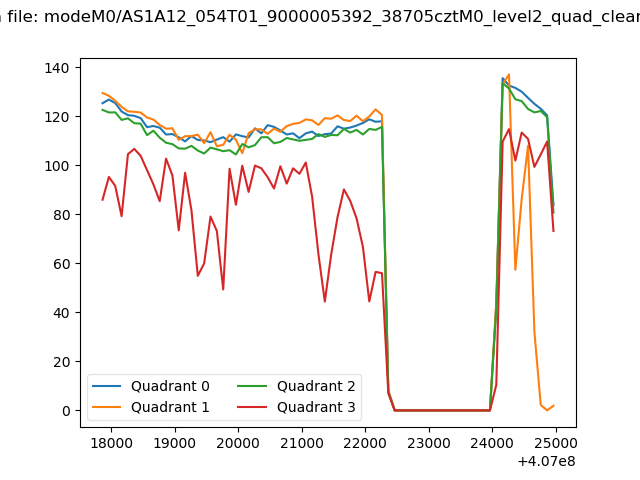 |
|
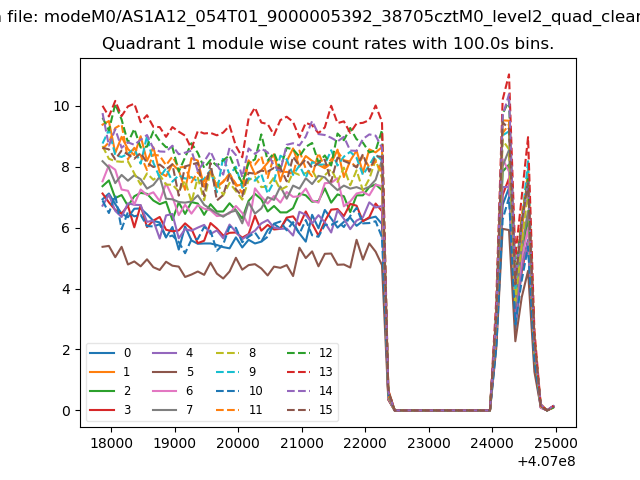
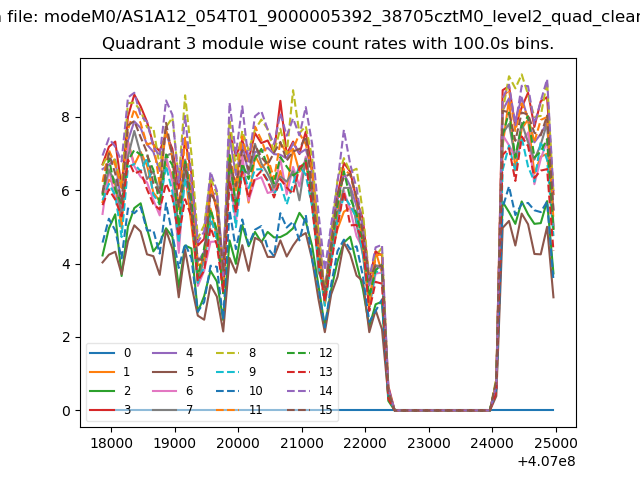
| Module-wise count rates for Quadrant A Data is divided into 100 sec bins |
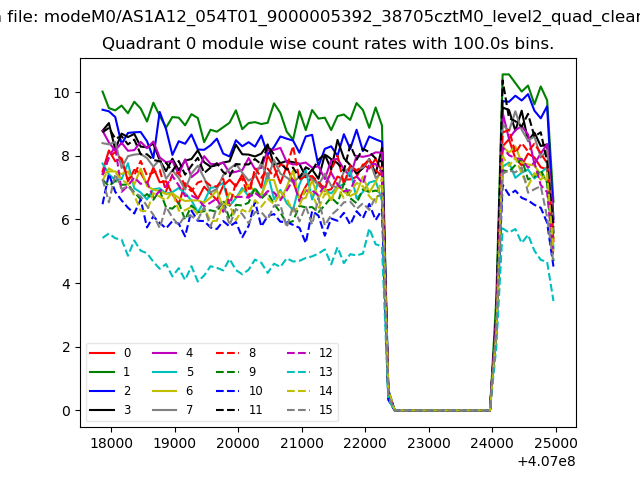 |
 |
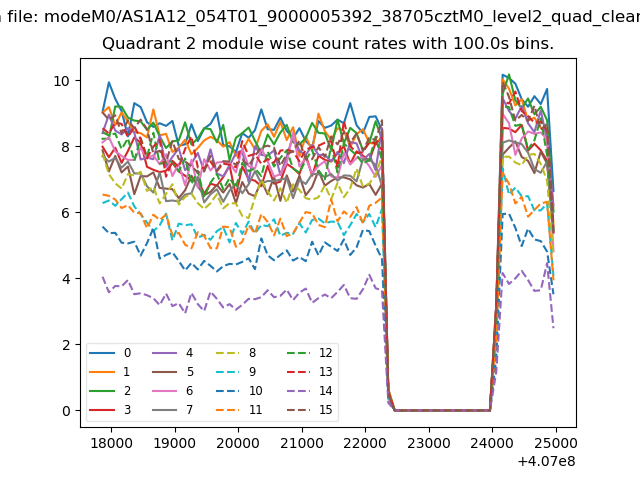
| Module-wise count rates for Quadrant B Data is divided into 100 sec bins |
 |
 |
| Module-wise count rates for Quadrant C Data is divided into 100 sec bins |
 |
 |
| Module-wise count rates for Quadrant D Data is divided into 100 sec bins |
 |
 |
| Parameter | Plot |
|---|---|
| CZT HV Monitor | 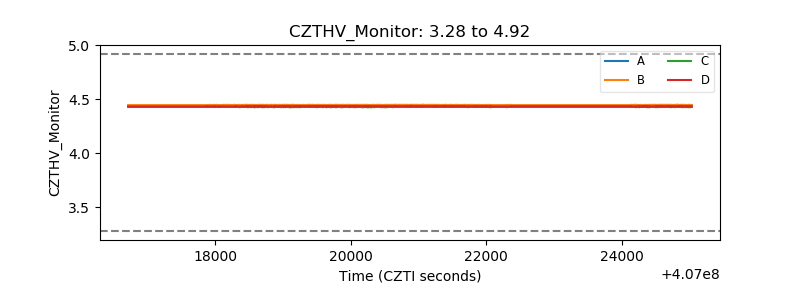 |
| D_VDD | 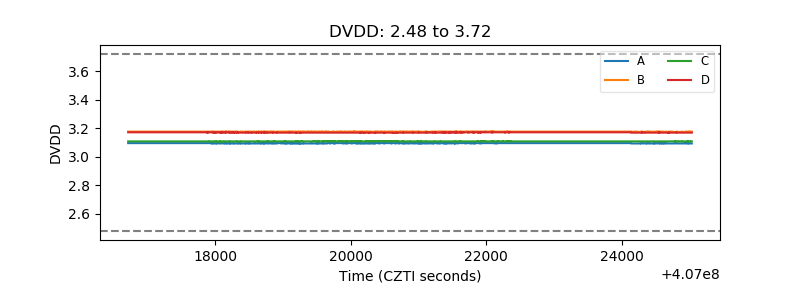 |
| Temperature 1 | 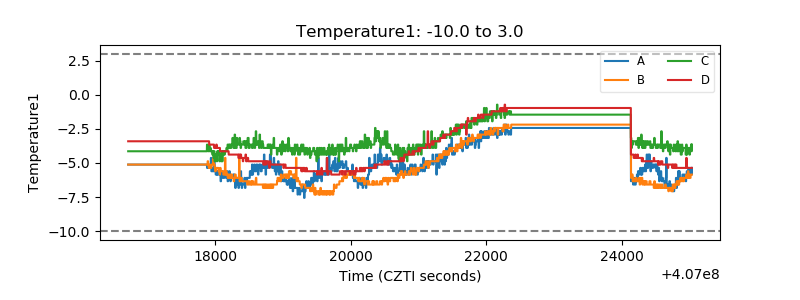 |
| Veto HV Monitor | 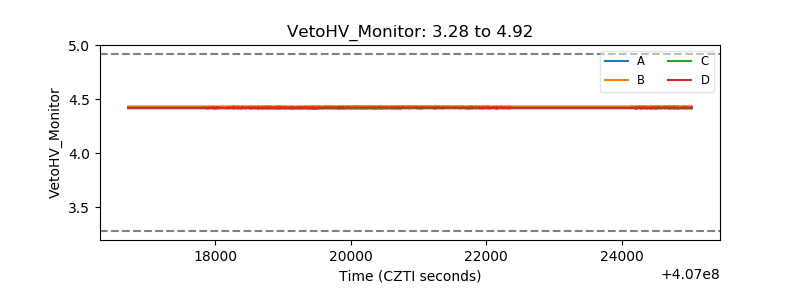 |
| Veto LLD | 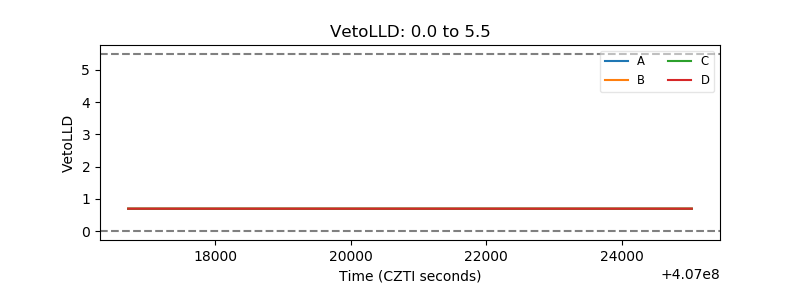 |
| Alpha Counter | 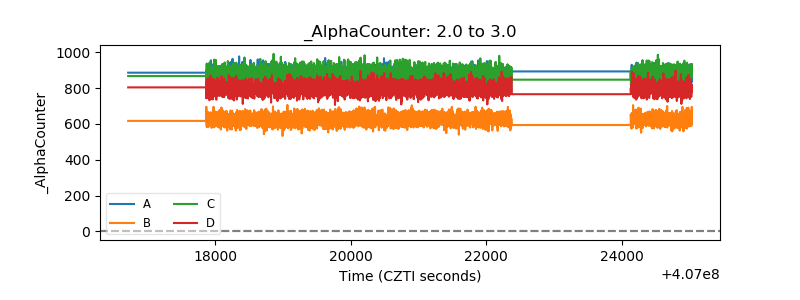 |
| _CPM_Rate | 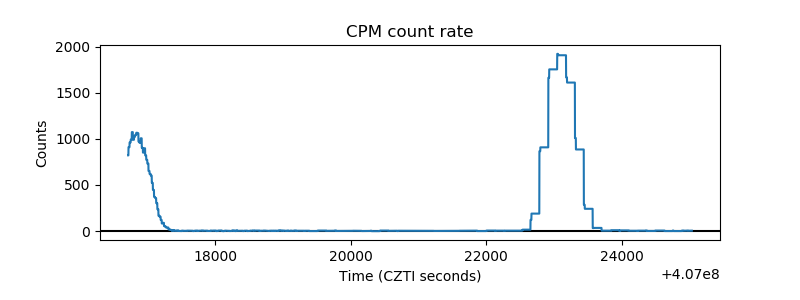 |
| CZT Counter | 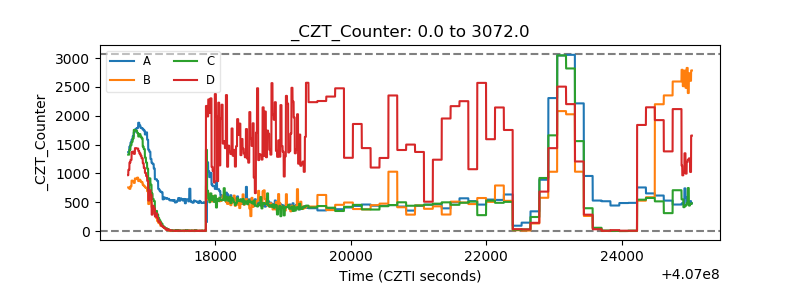 |
| +2.5 Volts monitor | 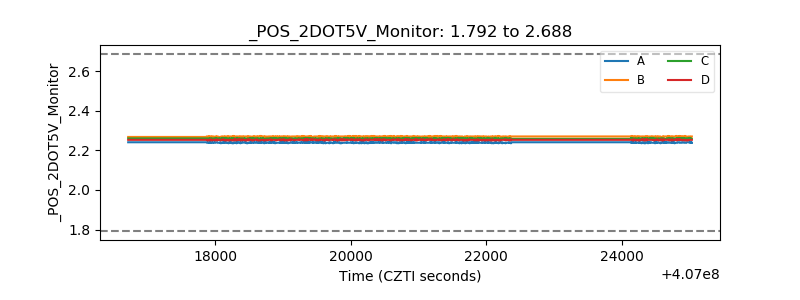 |
| +5 Volts monitor | 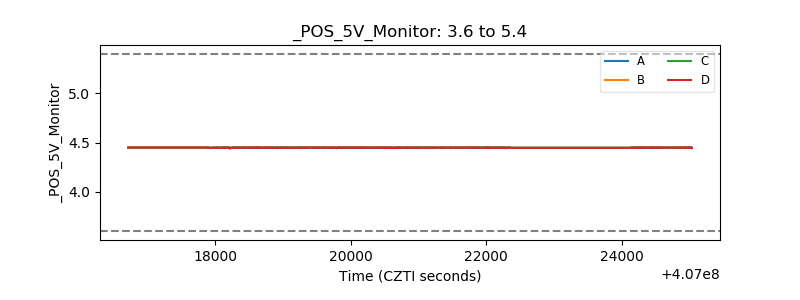 |
| _ROLL_ROT | 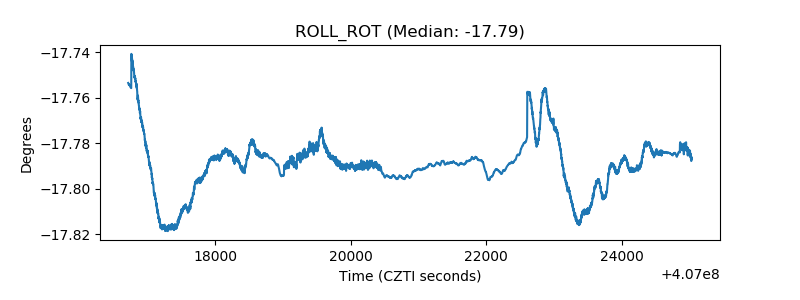 |
| _Roll_DEC | 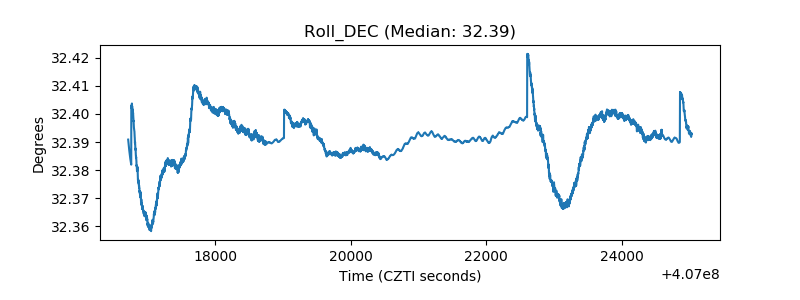 |
| _Roll_RA | 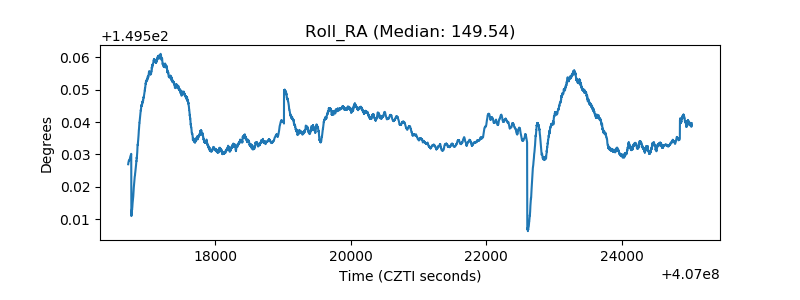 |
| Veto Counter | 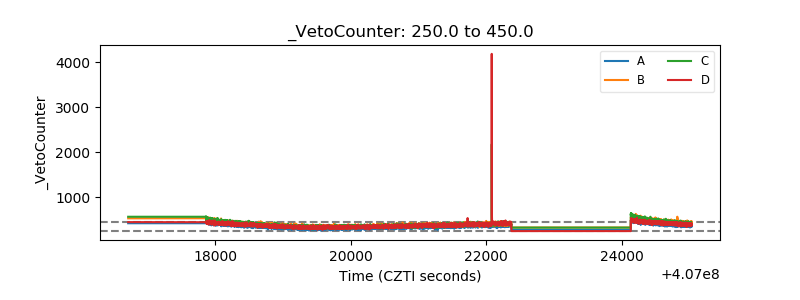 |