| Param | Original file | Final file |
|---|---|---|
| Filename | modeM0/AS1A12_054T01_9000005392_38706cztM0_level2.fits | modeM0/AS1A12_054T01_9000005392_38706cztM0_level2_quad_clean.evt |
| Size (bytes) | 553,020,480 | 85,530,240 |
| Size | 527.4 MB | 81.6 MB |
| Events in quadrant A | 2,787,813 | 644,283 |
| Events in quadrant B | 5,050,220 | 550,702 |
| Events in quadrant C | 2,856,884 | 626,459 |
| Events in quadrant D | 9,363,653 | 396,258 |
| Mode M9 | |||
|---|---|---|---|
| Quadrant | BADHDUFLAG | Total packets | Discarded packets |
| A | 0 | 37 | 0 |
| B | 0 | 37 | 0 |
| C | 0 | 37 | 0 |
| D | 0 | 37 | 0 |
| Mode SS | |||
|---|---|---|---|
| Quadrant | BADHDUFLAG | Total packets | Discarded packets |
| A | 0 | 110 | 0 |
| B | 0 | 110 | 0 |
| C | 0 | 110 | 0 |
| D | 0 | 110 | 0 |
| Mode M0 | |||
|---|---|---|---|
| Quadrant | BADHDUFLAG | Total packets | Discarded packets |
| A | 0 | 11569 | 3 |
| B | 0 | 18287 | 2 |
| C | 0 | 11625 | 2 |
| D | 0 | 31482 | 2 |
| Quadrant | Total seconds | Saturated seconds | Saturation percentage |
|---|---|---|---|
| A | 5311 | 9 | 0.169460% |
| B | 5311 | 993 | 18.697044% |
| C | 5311 | 40 | 0.753154% |
| D | 5311 | 2057 | 38.730936% |
Noise dominated data is calculated using 1-second bins in cleaned event files. If a bin has >2000 counts, and if more than 50% of those come from <1% of pixels, then it is considered to be noise-dominated and hence unusable.
| Quadrant | # 1 sec bins | Bins with >0 counts | Bins with >2000 counts | High rate bins dominated by noise | Noise dominated (total time) | Noise dominated (detector-on time) | Marked lightcurve |
|---|---|---|---|---|---|---|---|
| A | 8955 | 5313 | 6 | 6 | 0.07% | 0.11% | 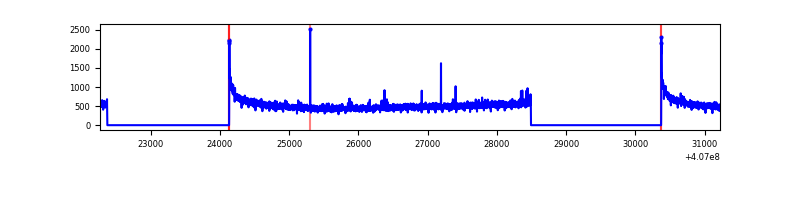 |
| B | 8955 | 5313 | 845 | 845 | 9.44% | 15.90% | 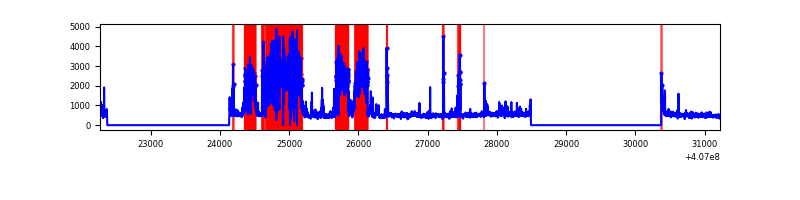 |
| C | 8955 | 5313 | 47 | 47 | 0.52% | 0.88% | 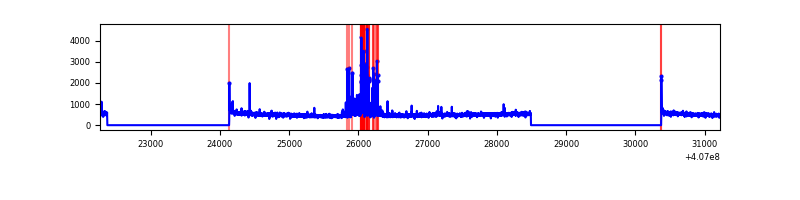 |
| D | 8955 | 5313 | 1730 | 1730 | 19.32% | 32.56% | 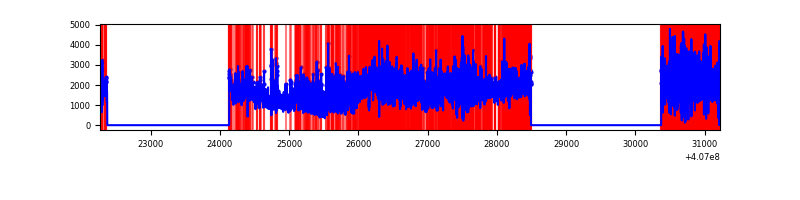 |
Top three noisy pixels from each quadrant. If the there are fewer than three noisy pixels in the level2.evt file, extra rows are filled as -1
| Pixel properties | Quadrant properties | ||||||
|---|---|---|---|---|---|---|---|
| Quadrant | DetID | PixID | Counts | Sigma | Mean | Median | Sigma |
| A | 10 | 83 | 391366 | 3143.48 | 612 | 601 | 124.3 |
| A | 10 | 255 | 8056 | 59.97 | 612 | 601 | 124.3 |
| A | 13 | 254 | 7730 | 57.35 | 612 | 601 | 124.3 |
| B | 5 | 184 | 2597988 | 24736.26 | 551 | 536 | 105.0 |
| B | 4 | 171 | 244954 | 2327.66 | 551 | 536 | 105.0 |
| B | 0 | 230 | 17920 | 165.55 | 551 | 536 | 105.0 |
| C | 14 | 254 | 273129 | 1963.8 | 597 | 599 | 138.8 |
| C | 15 | 214 | 219160 | 1574.91 | 597 | 599 | 138.8 |
| C | 0 | 10 | 18575 | 129.53 | 597 | 599 | 138.8 |
| D | 2 | 16 | 5865247 | 46036.97 | 517 | 502 | 127.4 |
| D | 12 | 227 | 628586 | 4930.32 | 517 | 502 | 127.4 |
| D | 12 | 235 | 525543 | 4121.45 | 517 | 502 | 127.4 |
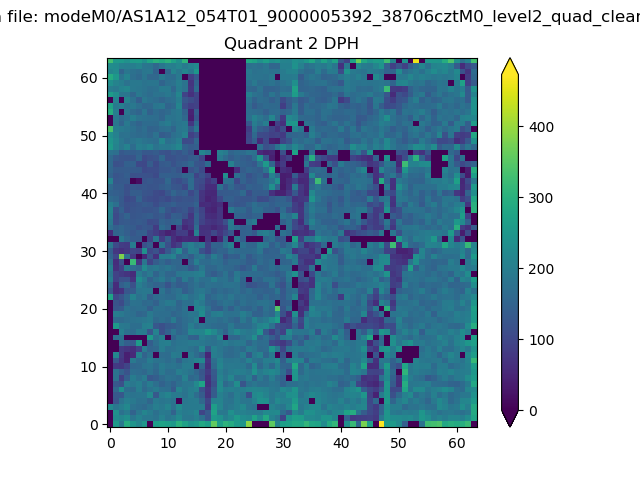
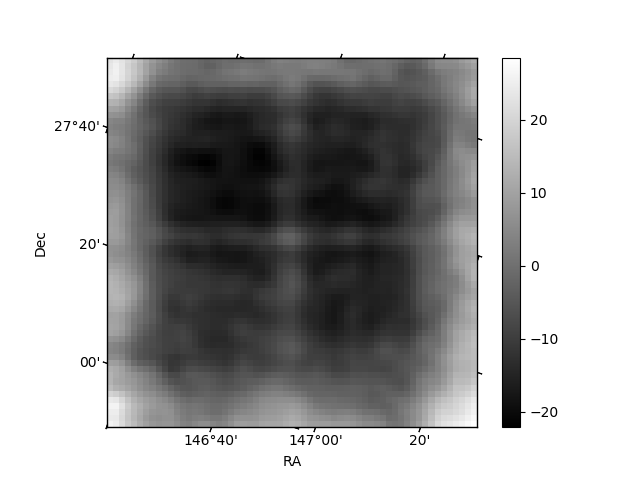
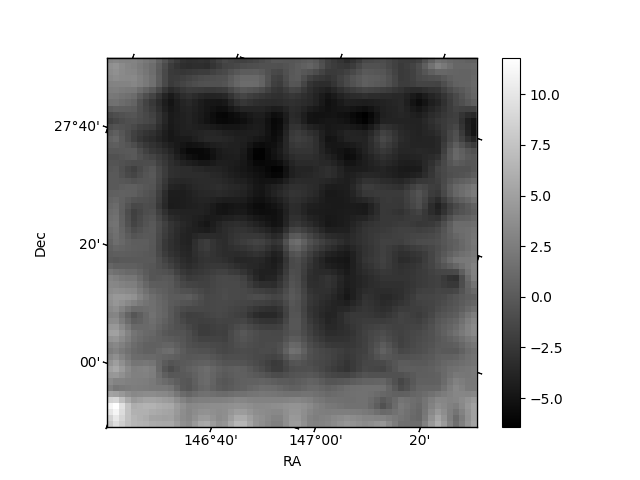
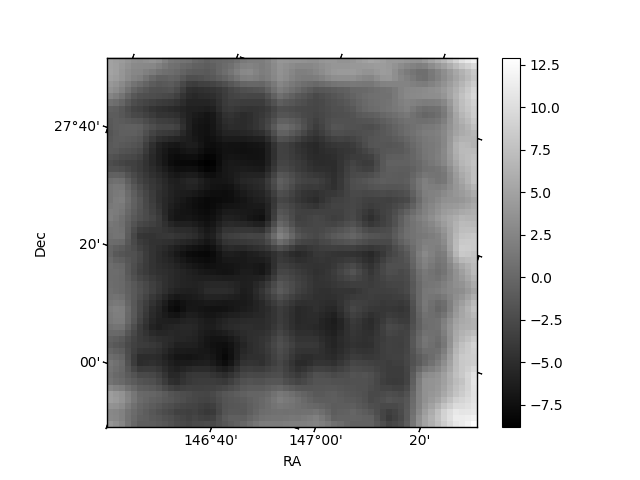
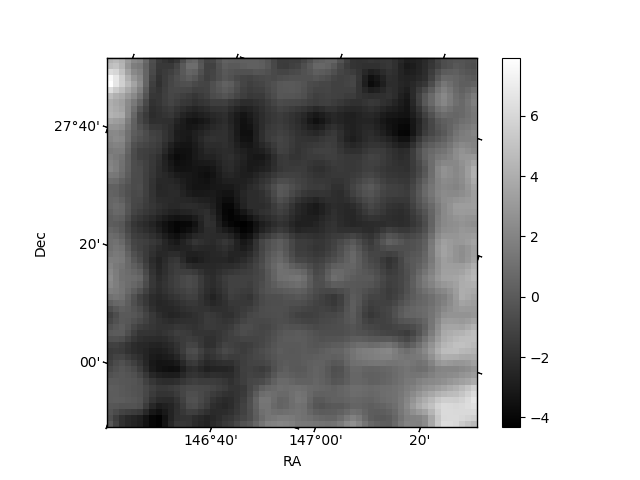
Histogram calculated using DETX and DETY for each event in the final _common_clean file
| Quadrant A | 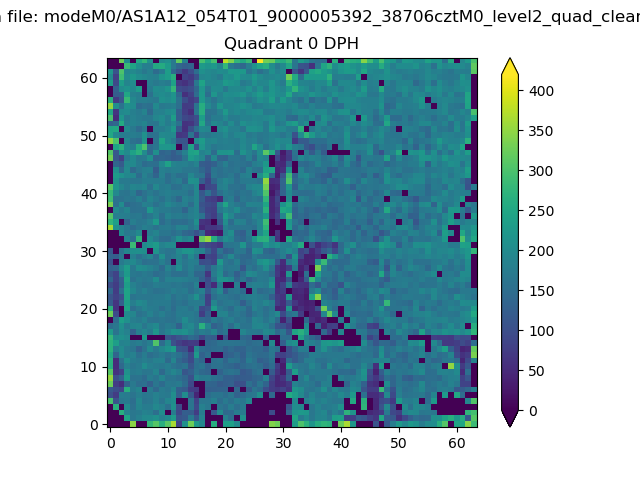 |
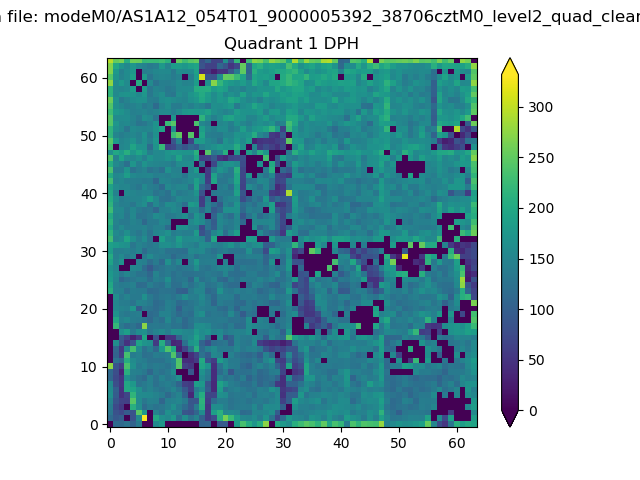 |
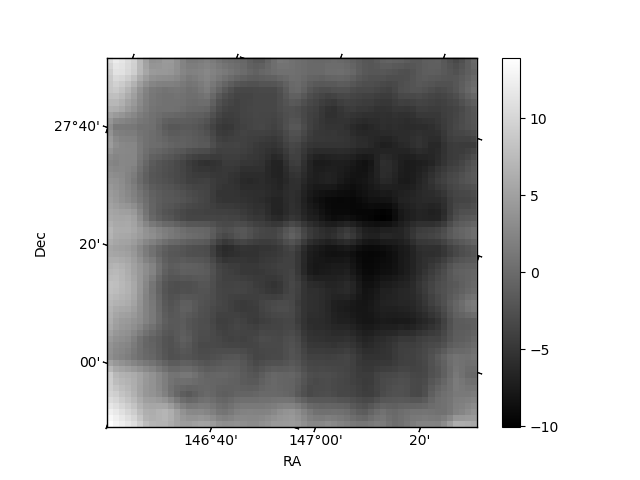
Quadrant B |
|---|---|---|---|
| Quadrant D | 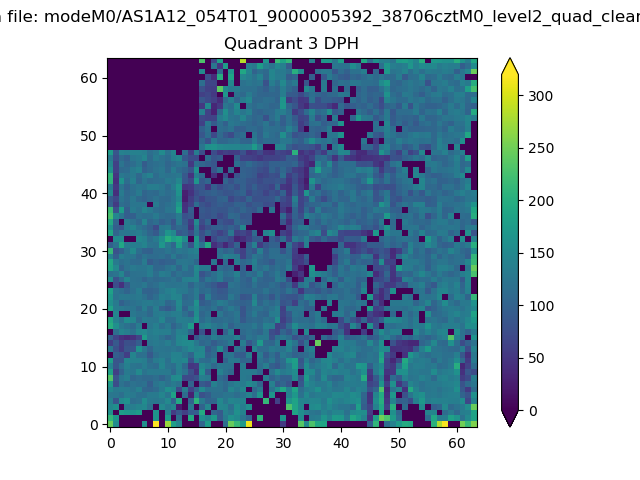 |
 |
Quadrant C |
| Plot type | Count rate plots | Images |
|---|---|---|
| Comparison with Poisson distribution Blue bars denote a histogram of data divided into 1 sec bins. Red curve is a Poisson curve with rate = median count rate of data. |
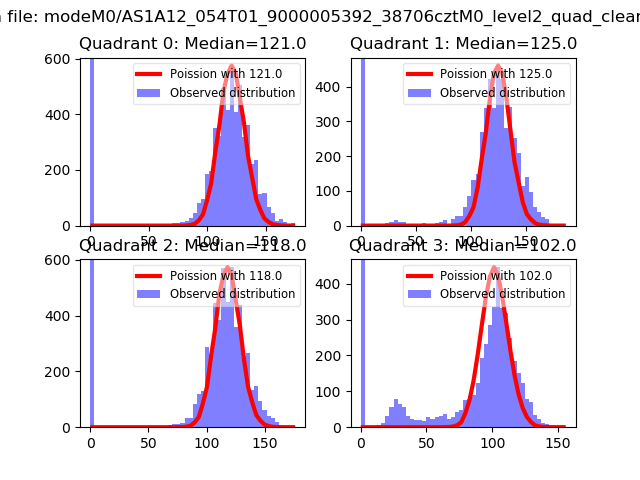 |
 |
| Quadrant-wise count rates Data is divided into 100 sec bins |
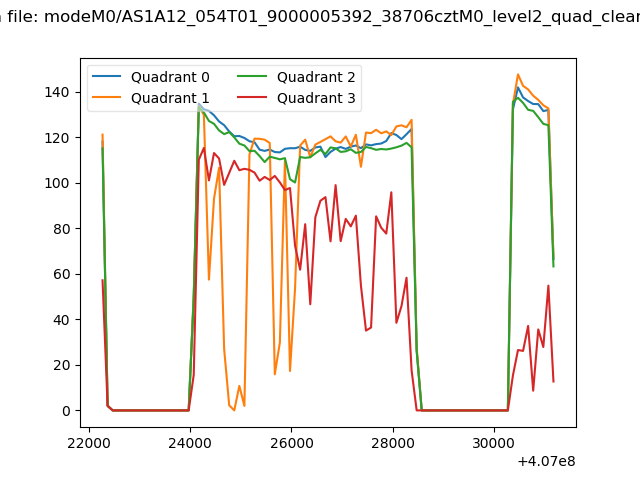 |
|
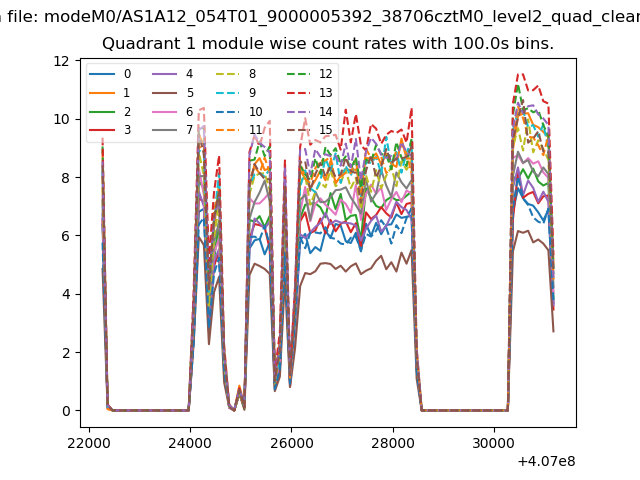
| Module-wise count rates for Quadrant A Data is divided into 100 sec bins |
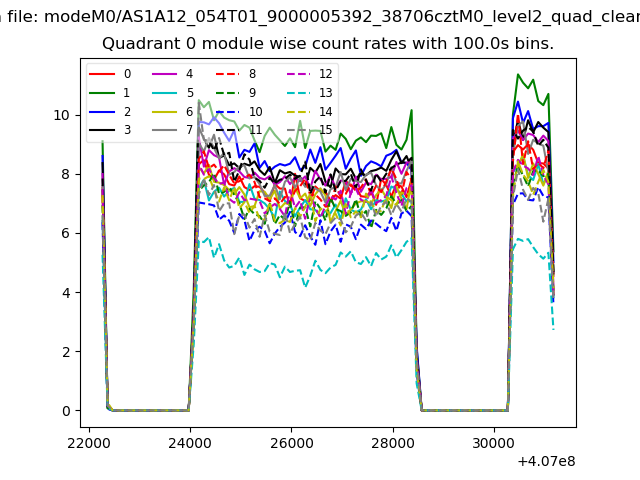 |
 |
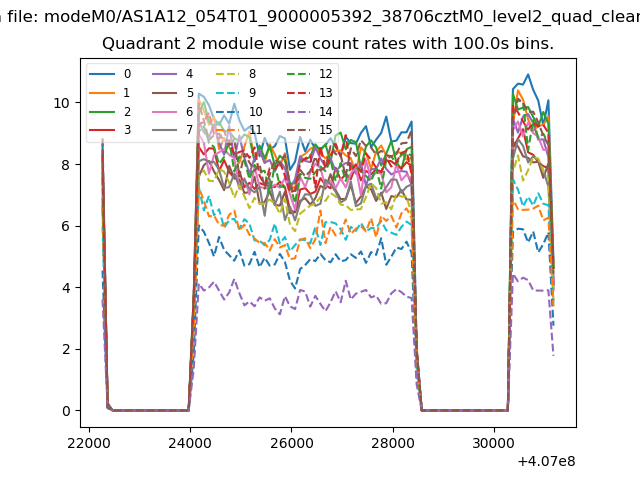
| Module-wise count rates for Quadrant B Data is divided into 100 sec bins |
 |
 |
| Module-wise count rates for Quadrant C Data is divided into 100 sec bins |
 |
 |
| Module-wise count rates for Quadrant D Data is divided into 100 sec bins |
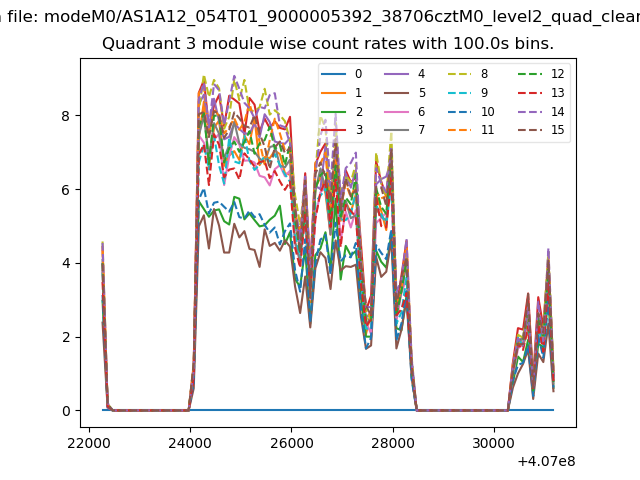 |
 |
| Parameter | Plot |
|---|---|
| CZT HV Monitor | 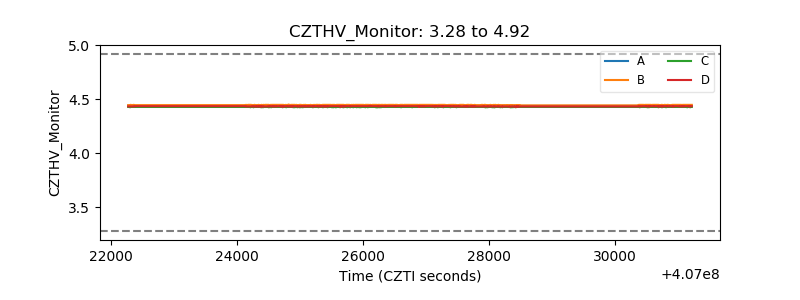 |
| D_VDD | 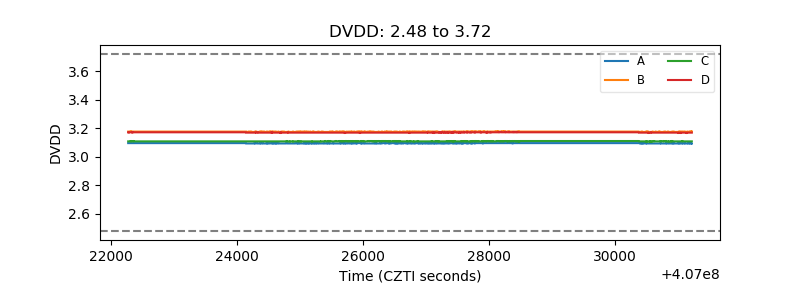 |
| Temperature 1 | 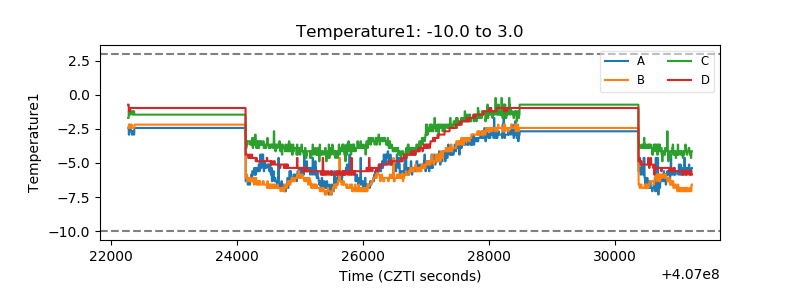 |
| Veto HV Monitor | 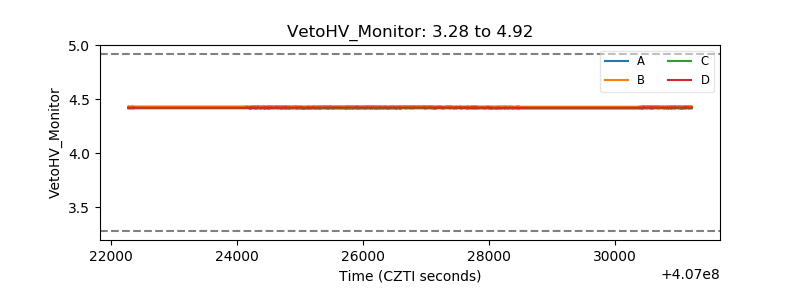 |
| Veto LLD | 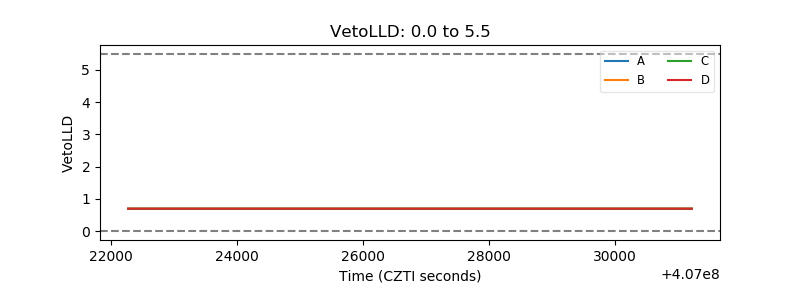 |
| Alpha Counter | 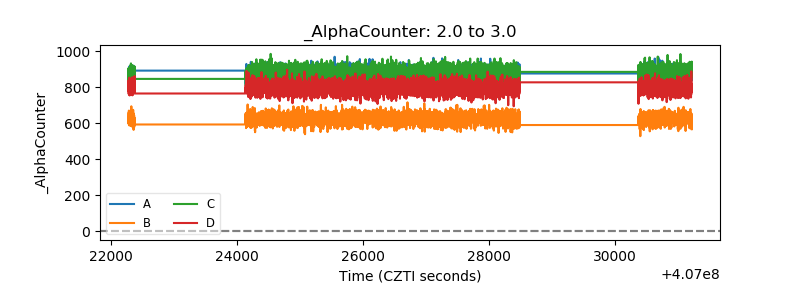 |
| _CPM_Rate | 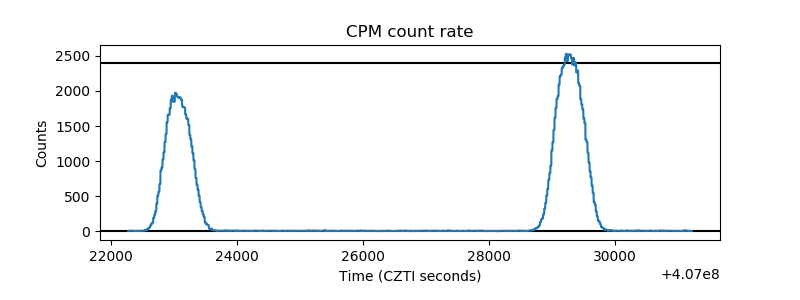 |
| CZT Counter | 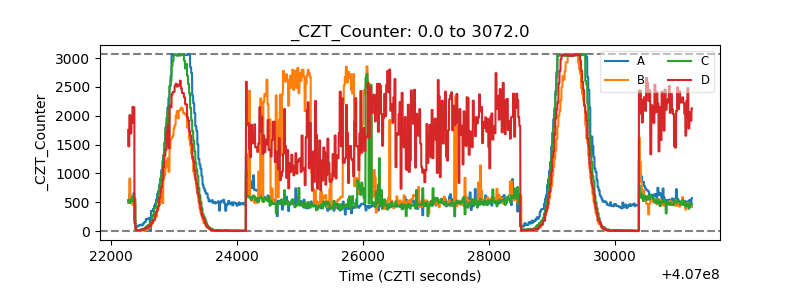 |
| +2.5 Volts monitor | 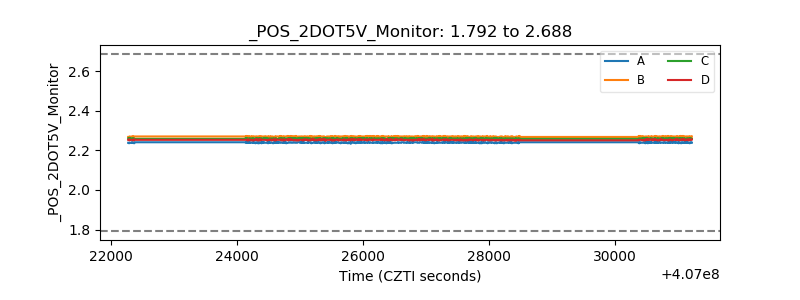 |
| +5 Volts monitor | 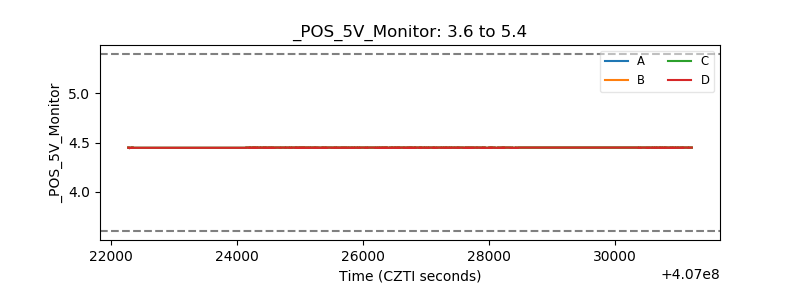 |
| _ROLL_ROT | 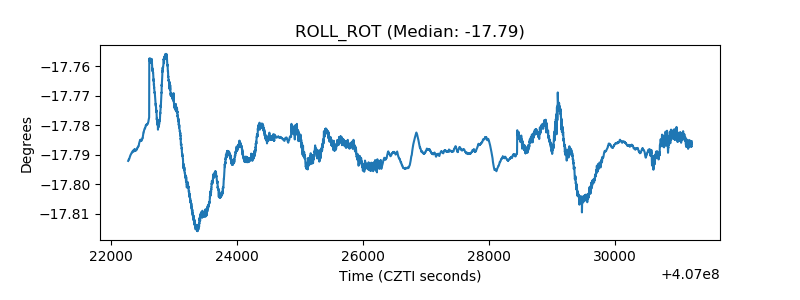 |
| _Roll_DEC | 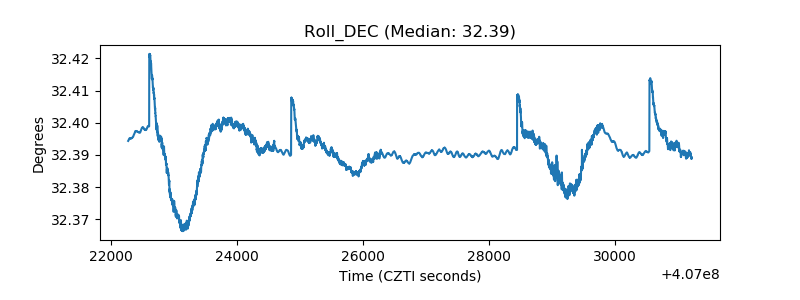 |
| _Roll_RA | 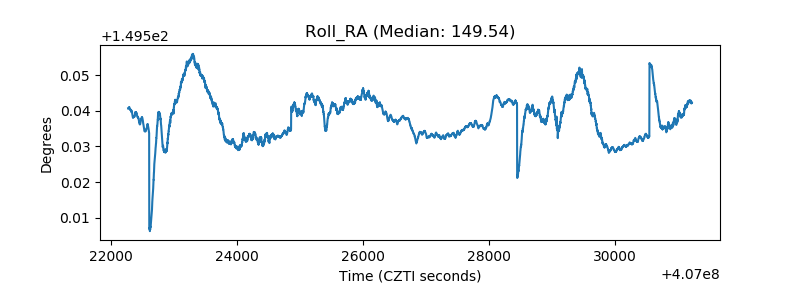 |
| Veto Counter | 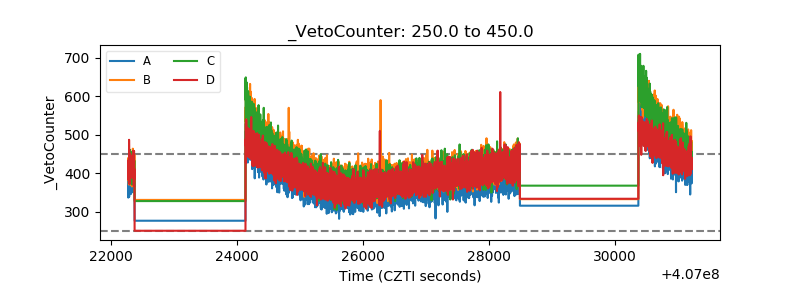 |