| Param | Original file | Final file |
|---|---|---|
| Filename | modeM0/AS1A12_054T01_9000005392_38707cztM0_level2.fits | modeM0/AS1A12_054T01_9000005392_38707cztM0_level2_quad_clean.evt |
| Size (bytes) | 534,810,240 | 91,990,080 |
| Size | 510.0 MB | 87.7 MB |
| Events in quadrant A | 2,893,719 | 685,645 |
| Events in quadrant B | 2,862,746 | 704,842 |
| Events in quadrant C | 2,833,375 | 666,602 |
| Events in quadrant D | 10,784,127 | 347,062 |
| Mode M9 | |||
|---|---|---|---|
| Quadrant | BADHDUFLAG | Total packets | Discarded packets |
| A | 0 | 33 | 0 |
| B | 0 | 33 | 0 |
| C | 0 | 33 | 0 |
| D | 0 | 34 | 0 |
| Mode SS | |||
|---|---|---|---|
| Quadrant | BADHDUFLAG | Total packets | Discarded packets |
| A | 0 | 112 | 0 |
| B | 0 | 112 | 0 |
| C | 0 | 112 | 0 |
| D | 0 | 112 | 0 |
| Mode M0 | |||
|---|---|---|---|
| Quadrant | BADHDUFLAG | Total packets | Discarded packets |
| A | 0 | 11850 | 3 |
| B | 0 | 12046 | 2 |
| C | 0 | 11704 | 2 |
| D | 0 | 35793 | 2 |
| Quadrant | Total seconds | Saturated seconds | Saturation percentage |
|---|---|---|---|
| A | 5442 | 9 | 0.165380% |
| B | 5442 | 63 | 1.157663% |
| C | 5442 | 7 | 0.128629% |
| D | 5442 | 2813 | 51.690555% |
Noise dominated data is calculated using 1-second bins in cleaned event files. If a bin has >2000 counts, and if more than 50% of those come from <1% of pixels, then it is considered to be noise-dominated and hence unusable.
| Quadrant | # 1 sec bins | Bins with >0 counts | Bins with >2000 counts | High rate bins dominated by noise | Noise dominated (total time) | Noise dominated (detector-on time) | Marked lightcurve |
|---|---|---|---|---|---|---|---|
| A | 7444 | 5443 | 6 | 6 | 0.08% | 0.11% | 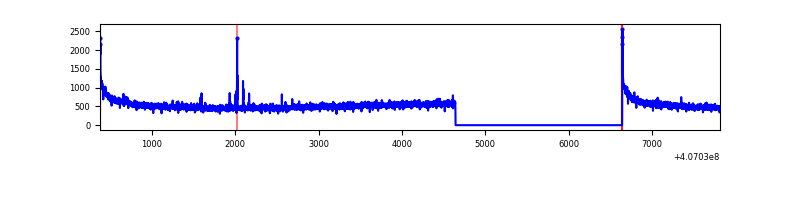 |
| B | 7444 | 5443 | 30 | 30 | 0.40% | 0.55% | 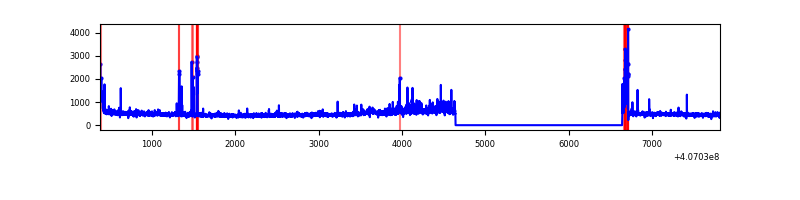 |
| C | 7444 | 5443 | 9 | 9 | 0.12% | 0.17% | 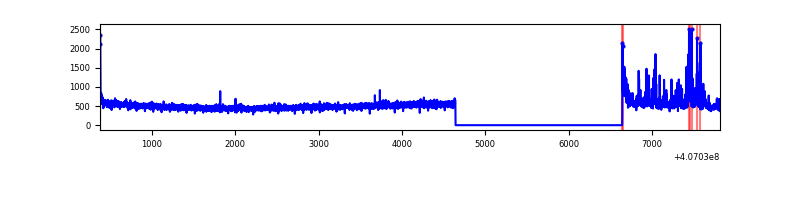 |
| D | 7444 | 5443 | 2749 | 2749 | 36.93% | 50.51% | 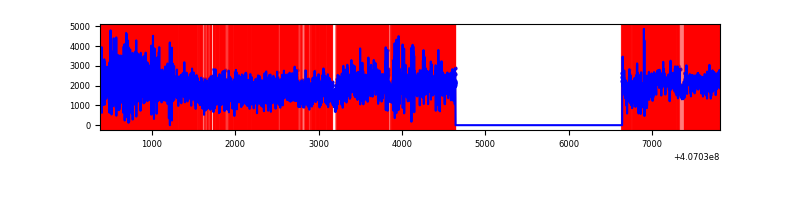 |
Top three noisy pixels from each quadrant. If the there are fewer than three noisy pixels in the level2.evt file, extra rows are filled as -1
| Pixel properties | Quadrant properties | ||||||
|---|---|---|---|---|---|---|---|
| Quadrant | DetID | PixID | Counts | Sigma | Mean | Median | Sigma |
| A | 10 | 83 | 408832 | 3196.59 | 635 | 627 | 127.7 |
| A | 7 | 3 | 17173 | 129.57 | 635 | 627 | 127.7 |
| A | 13 | 254 | 6917 | 49.26 | 635 | 627 | 127.7 |
| B | 4 | 171 | 225572 | 1866.21 | 635 | 620 | 120.5 |
| B | 4 | 251 | 66634 | 547.65 | 635 | 620 | 120.5 |
| B | 5 | 184 | 22530 | 181.77 | 635 | 620 | 120.5 |
| C | 15 | 214 | 224338 | 1547.13 | 619 | 624 | 144.6 |
| C | 14 | 254 | 145526 | 1002.09 | 619 | 624 | 144.6 |
| C | 0 | 10 | 29402 | 199.02 | 619 | 624 | 144.6 |
| D | 2 | 16 | 7213155 | 57944.47 | 506 | 494 | 124.5 |
| D | 12 | 235 | 1101036 | 8841.44 | 506 | 494 | 124.5 |
| D | 12 | 227 | 258392 | 2071.88 | 506 | 494 | 124.5 |
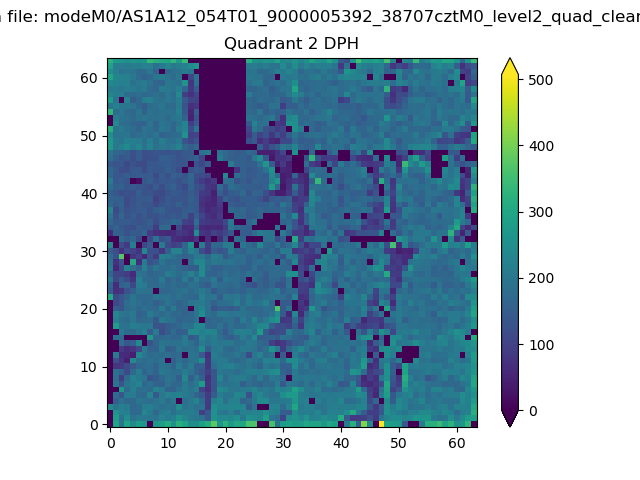
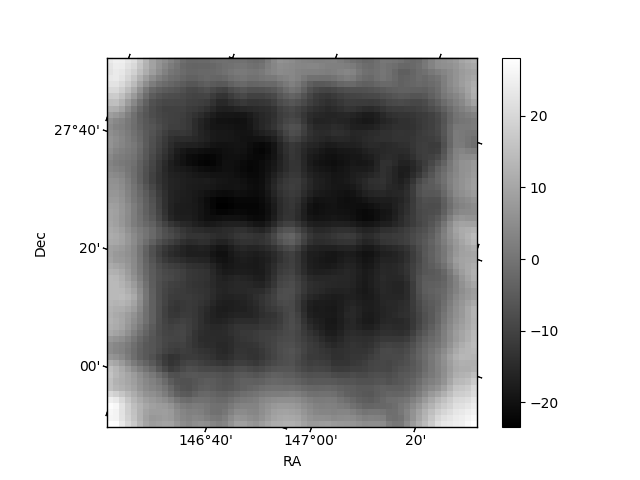
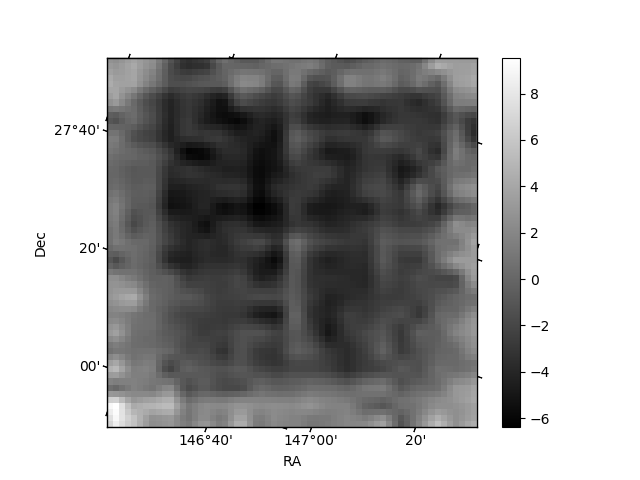
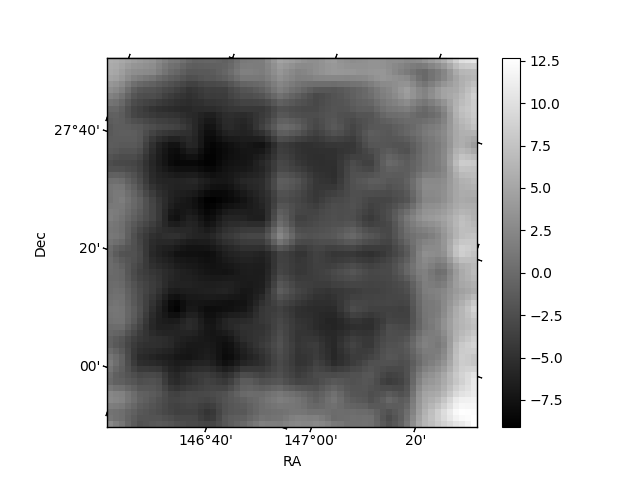
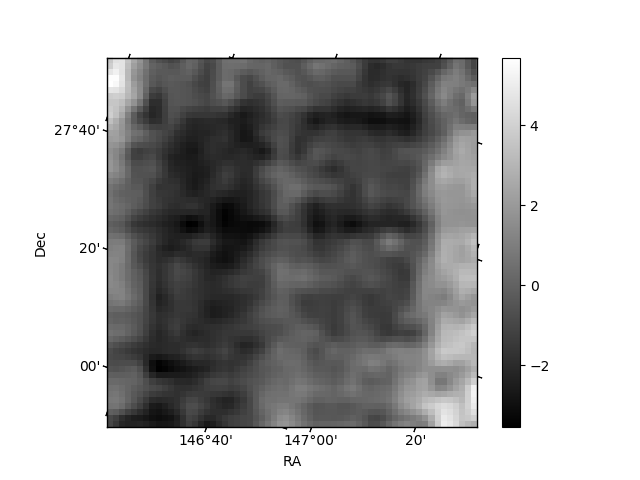
Histogram calculated using DETX and DETY for each event in the final _common_clean file
| Quadrant A | 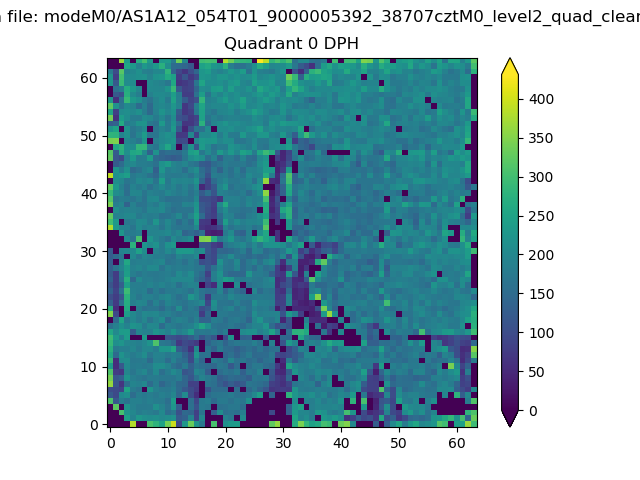 |
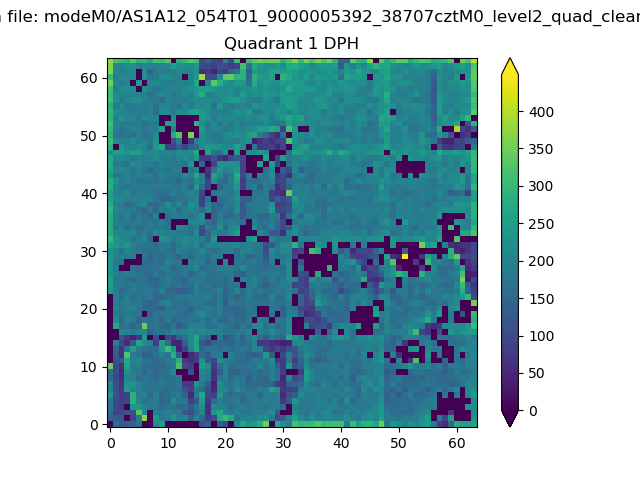 |
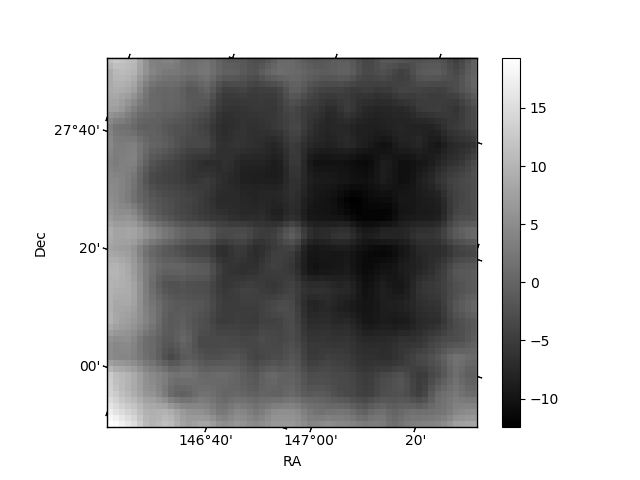
Quadrant B |
|---|---|---|---|
| Quadrant D | 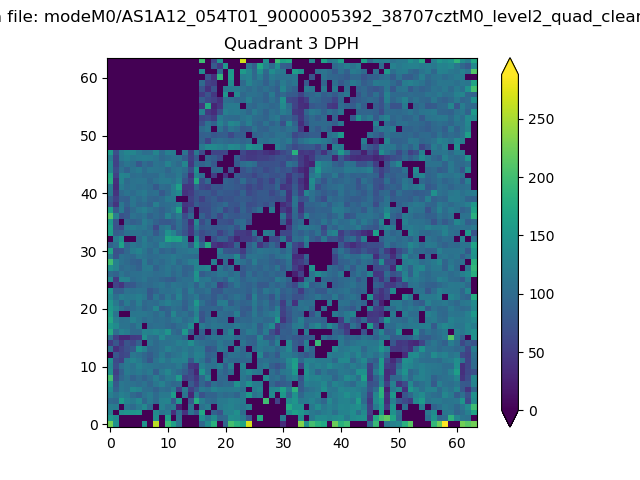 |
 |
Quadrant C |
| Plot type | Count rate plots | Images |
|---|---|---|
| Comparison with Poisson distribution Blue bars denote a histogram of data divided into 1 sec bins. Red curve is a Poisson curve with rate = median count rate of data. |
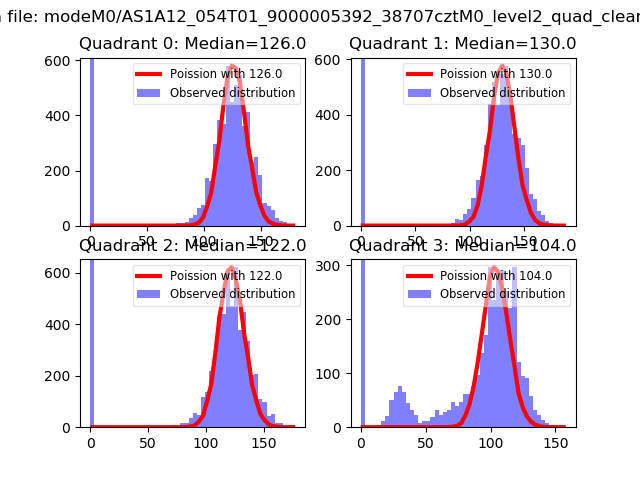 |
 |
| Quadrant-wise count rates Data is divided into 100 sec bins |
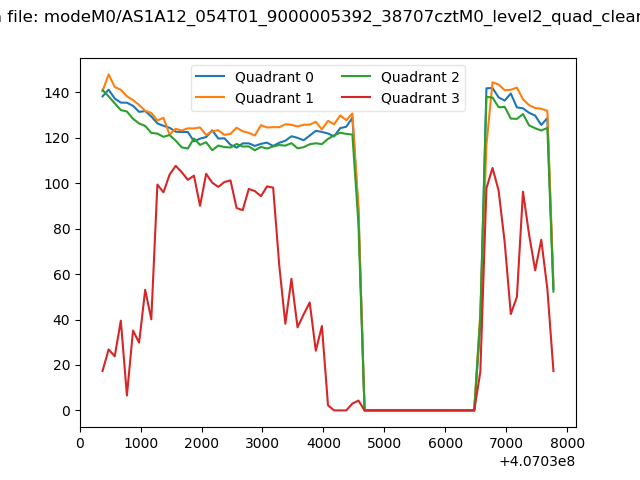 |
|
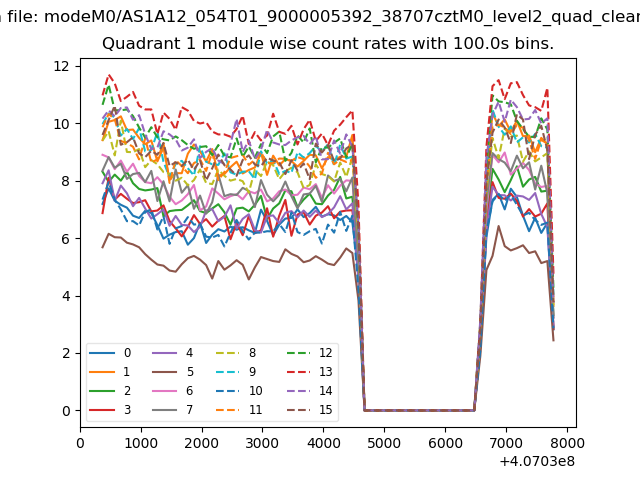
| Module-wise count rates for Quadrant A Data is divided into 100 sec bins |
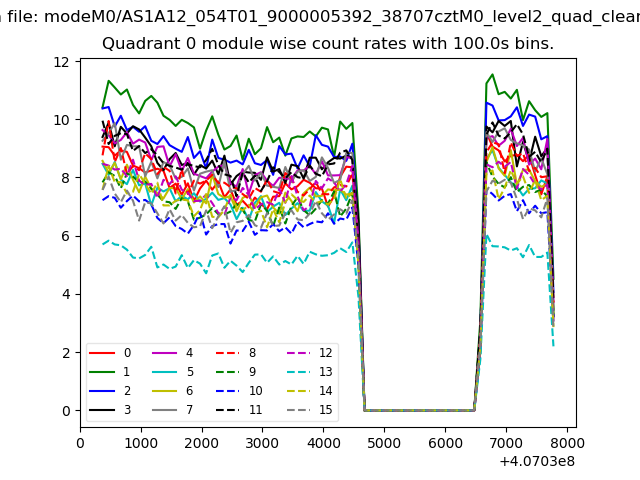 |
 |
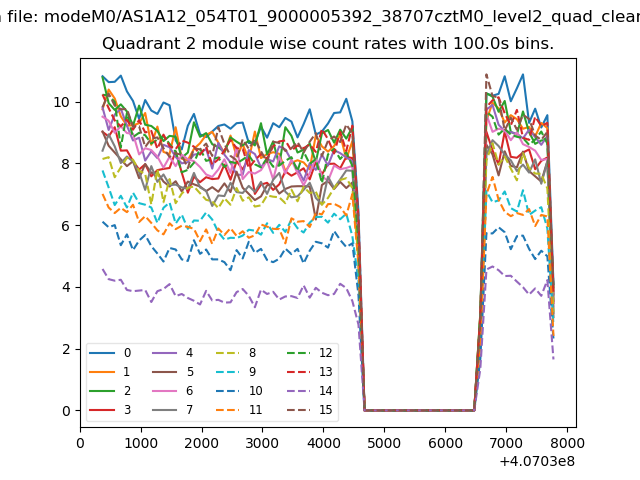
| Module-wise count rates for Quadrant B Data is divided into 100 sec bins |
 |
 |
| Module-wise count rates for Quadrant C Data is divided into 100 sec bins |
 |
 |
| Module-wise count rates for Quadrant D Data is divided into 100 sec bins |
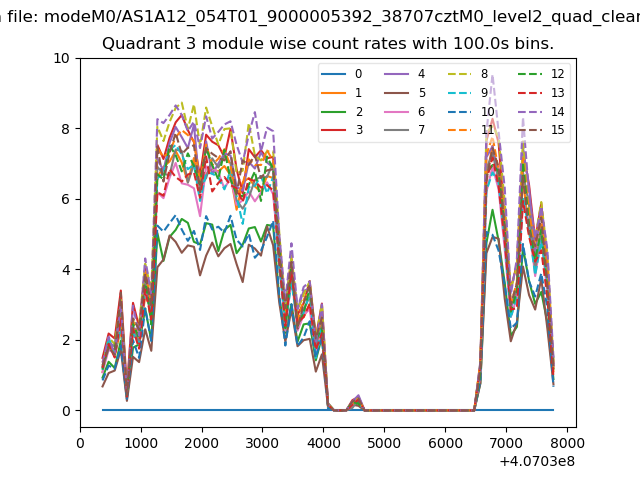 |
 |
| Parameter | Plot |
|---|---|
| CZT HV Monitor | 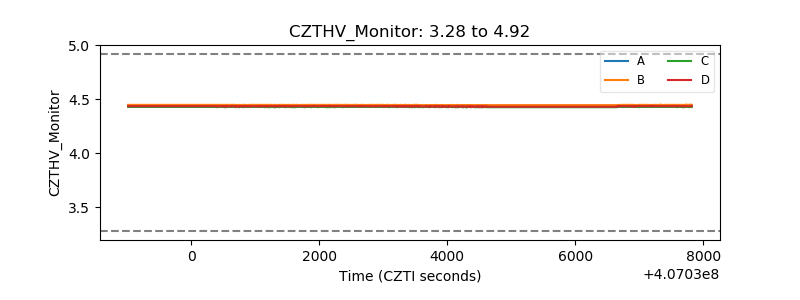 |
| D_VDD | 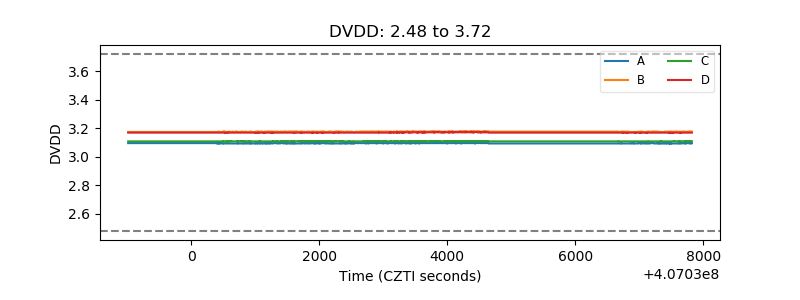 |
| Temperature 1 | 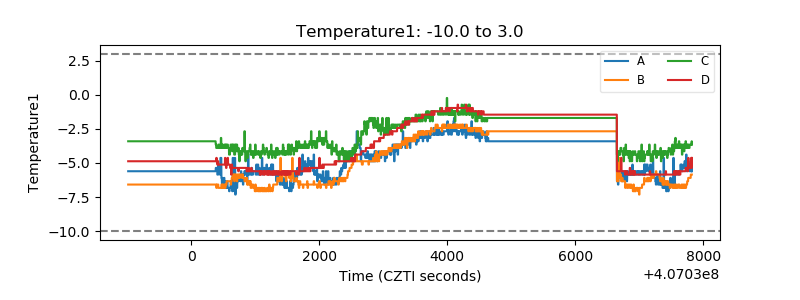 |
| Veto HV Monitor | 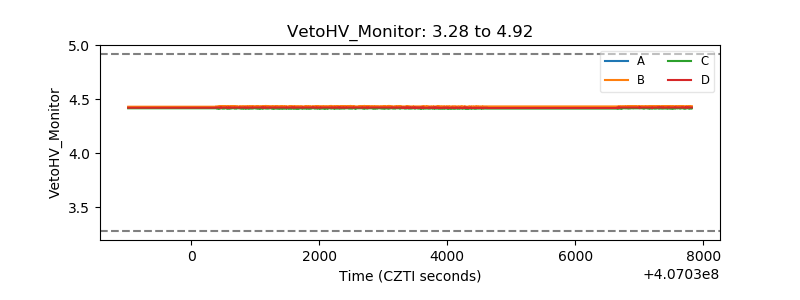 |
| Veto LLD | 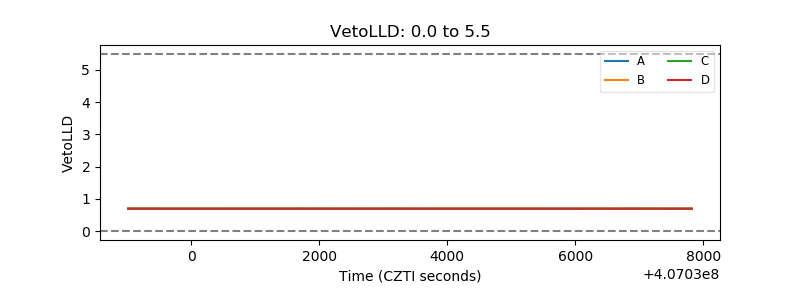 |
| Alpha Counter | 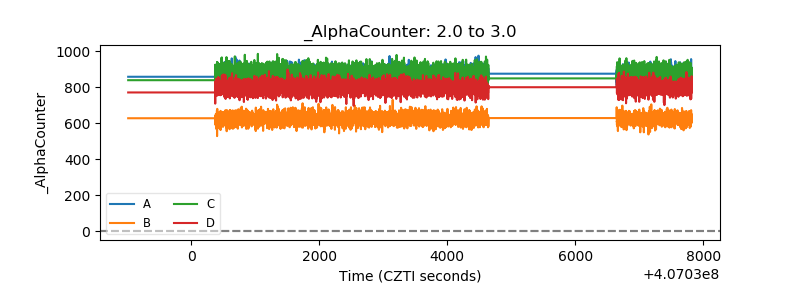 |
| _CPM_Rate | 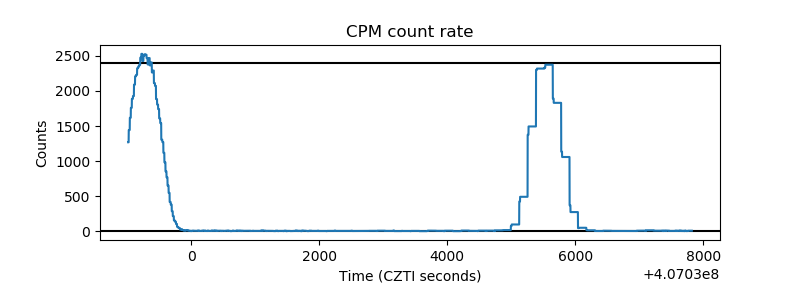 |
| CZT Counter | 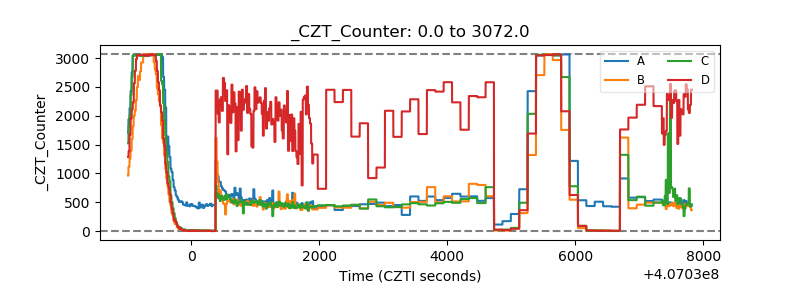 |
| +2.5 Volts monitor | 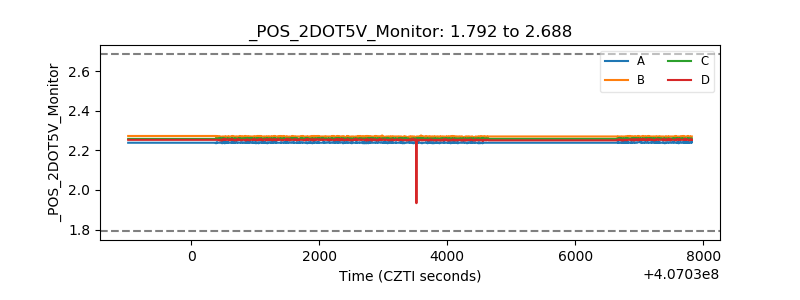 |
| +5 Volts monitor | 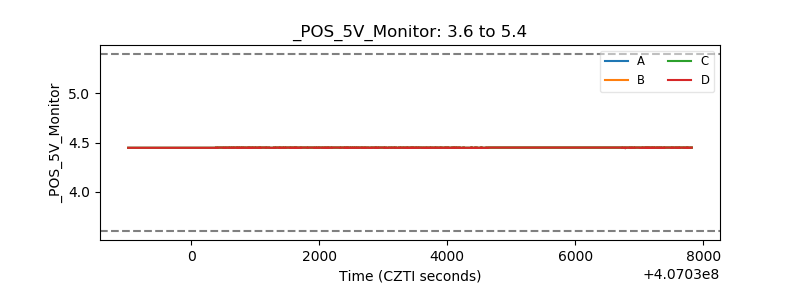 |
| _ROLL_ROT | 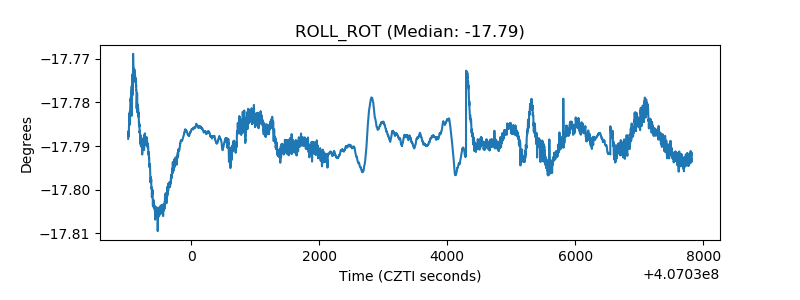 |
| _Roll_DEC | 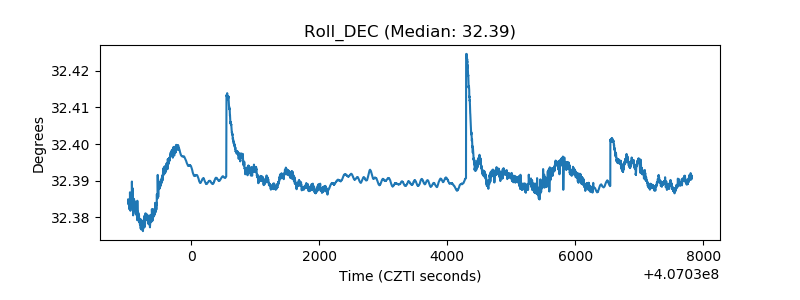 |
| _Roll_RA | 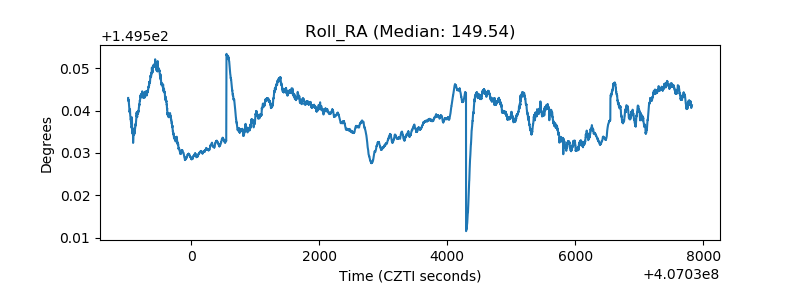 |
| Veto Counter | 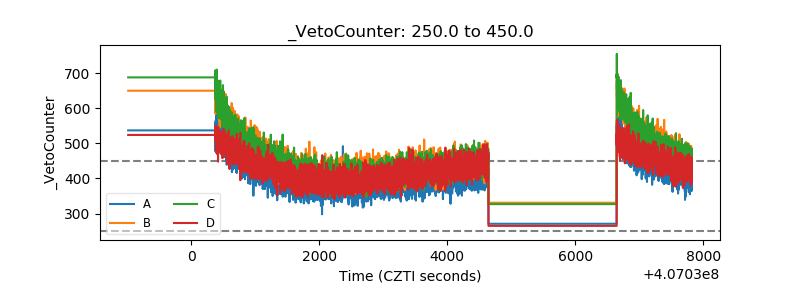 |