| Param | Original file | Final file |
|---|---|---|
| Filename | modeM0/AS1A12_054T01_9000005392_38708cztM0_level2.fits | modeM0/AS1A12_054T01_9000005392_38708cztM0_level2_quad_clean.evt |
| Size (bytes) | 522,570,240 | 90,596,160 |
| Size | 498.4 MB | 86.4 MB |
| Events in quadrant A | 2,813,746 | 668,181 |
| Events in quadrant B | 2,821,752 | 677,380 |
| Events in quadrant C | 4,464,871 | 596,710 |
| Events in quadrant D | 8,835,702 | 432,687 |
| Mode M9 | |||
|---|---|---|---|
| Quadrant | BADHDUFLAG | Total packets | Discarded packets |
| A | 0 | 32 | 0 |
| B | 0 | 32 | 0 |
| C | 0 | 32 | 0 |
| D | 0 | 33 | 0 |
| Mode SS | |||
|---|---|---|---|
| Quadrant | BADHDUFLAG | Total packets | Discarded packets |
| A | 0 | 108 | 0 |
| B | 0 | 108 | 0 |
| C | 0 | 108 | 0 |
| D | 0 | 108 | 0 |
| Mode M0 | |||
|---|---|---|---|
| Quadrant | BADHDUFLAG | Total packets | Discarded packets |
| A | 0 | 11464 | 3 |
| B | 0 | 11730 | 2 |
| C | 0 | 16650 | 2 |
| D | 0 | 29907 | 2 |
| Quadrant | Total seconds | Saturated seconds | Saturation percentage |
|---|---|---|---|
| A | 5255 | 14 | 0.266413% |
| B | 5255 | 134 | 2.549952% |
| C | 5255 | 459 | 8.734539% |
| D | 5255 | 1922 | 36.574691% |
Noise dominated data is calculated using 1-second bins in cleaned event files. If a bin has >2000 counts, and if more than 50% of those come from <1% of pixels, then it is considered to be noise-dominated and hence unusable.
| Quadrant | # 1 sec bins | Bins with >0 counts | Bins with >2000 counts | High rate bins dominated by noise | Noise dominated (total time) | Noise dominated (detector-on time) | Marked lightcurve |
|---|---|---|---|---|---|---|---|
| A | 7347 | 5255 | 6 | 6 | 0.08% | 0.11% | 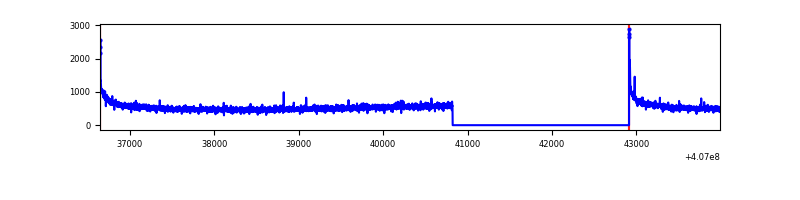 |
| B | 7347 | 5255 | 59 | 59 | 0.80% | 1.12% | 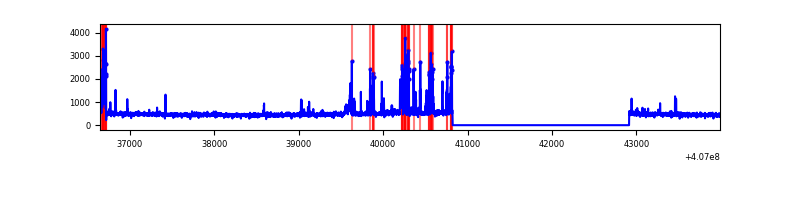 |
| C | 7347 | 5255 | 404 | 404 | 5.50% | 7.69% | 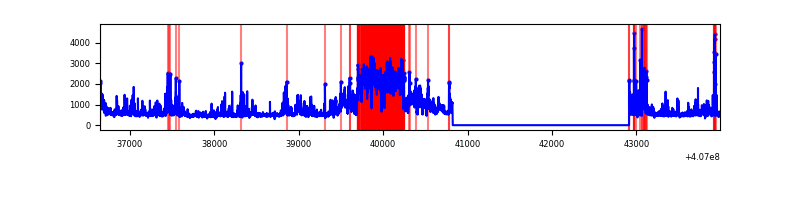 |
| D | 7347 | 5254 | 1908 | 1908 | 25.97% | 36.32% | 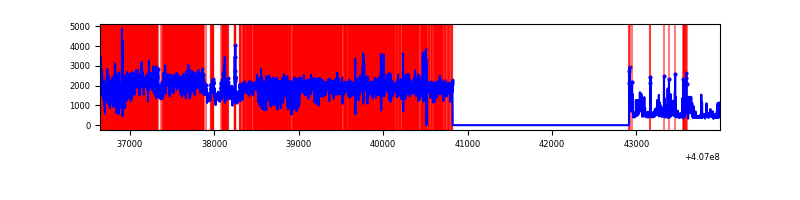 |
Top three noisy pixels from each quadrant. If the there are fewer than three noisy pixels in the level2.evt file, extra rows are filled as -1
| Pixel properties | Quadrant properties | ||||||
|---|---|---|---|---|---|---|---|
| Quadrant | DetID | PixID | Counts | Sigma | Mean | Median | Sigma |
| A | 10 | 83 | 389566 | 3106.15 | 620 | 609 | 125.2 |
| A | 0 | 8 | 21865 | 169.75 | 620 | 609 | 125.2 |
| A | 13 | 254 | 7866 | 57.95 | 620 | 609 | 125.2 |
| B | 4 | 171 | 347947 | 2976.49 | 613 | 598 | 116.7 |
| B | 5 | 200 | 34055 | 286.7 | 613 | 598 | 116.7 |
| B | 0 | 230 | 18029 | 149.37 | 613 | 598 | 116.7 |
| C | 14 | 254 | 1467503 | 10864.7 | 585 | 590 | 135.0 |
| C | 3 | 110 | 455884 | 3372.14 | 585 | 590 | 135.0 |
| C | 15 | 214 | 214606 | 1585.11 | 585 | 590 | 135.0 |
| D | 2 | 16 | 5910191 | 43822.76 | 552 | 536 | 134.9 |
| D | 12 | 227 | 292979 | 2168.6 | 552 | 536 | 134.9 |
| D | 13 | 249 | 108605 | 801.38 | 552 | 536 | 134.9 |
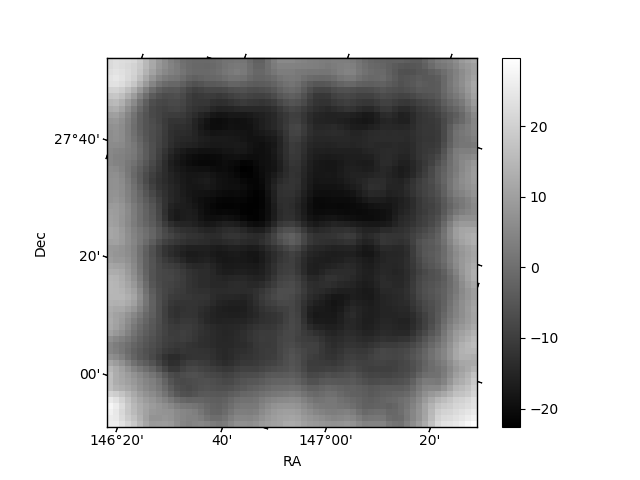
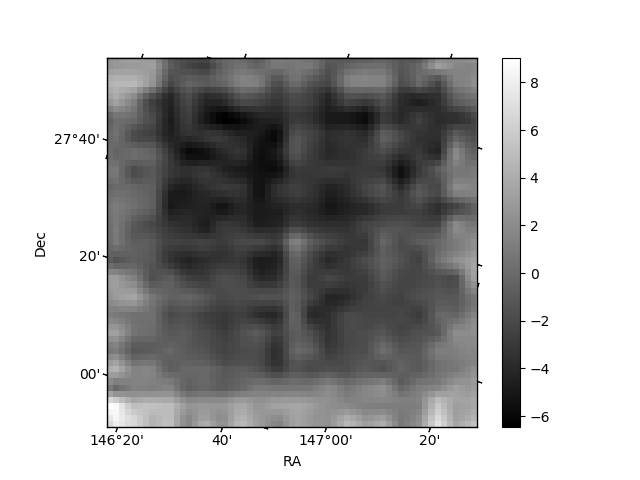
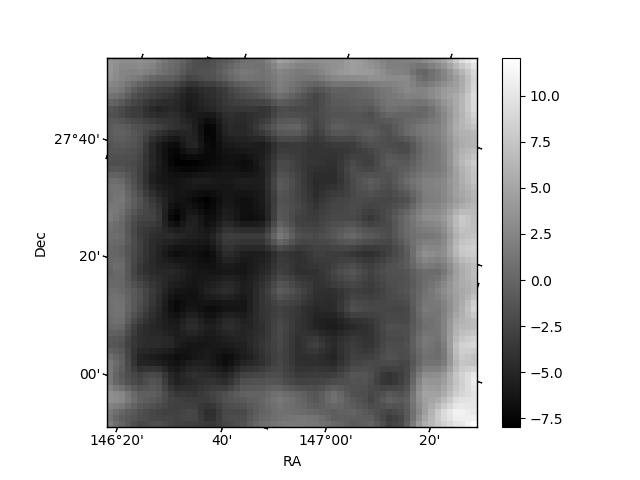
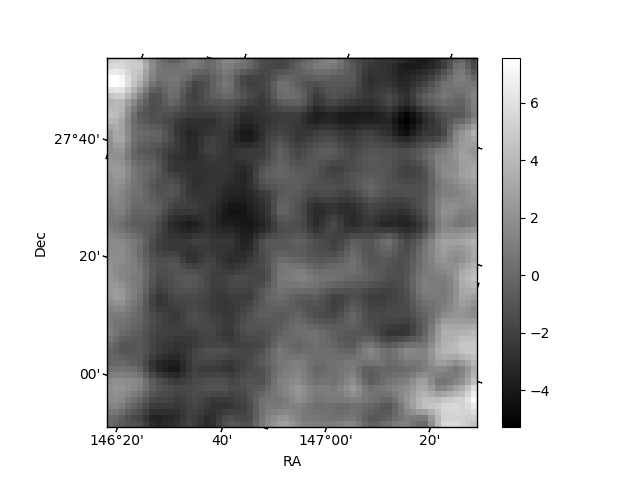
Histogram calculated using DETX and DETY for each event in the final _common_clean file
| Quadrant A | 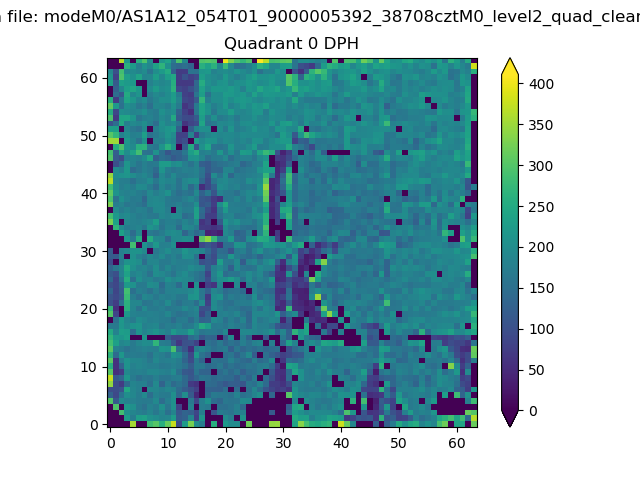 |
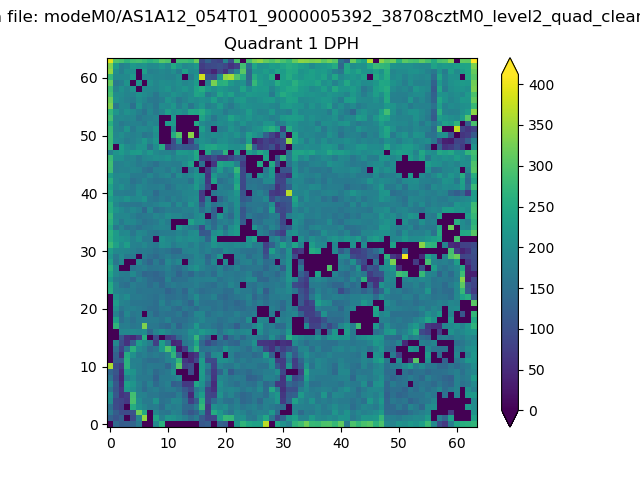 |
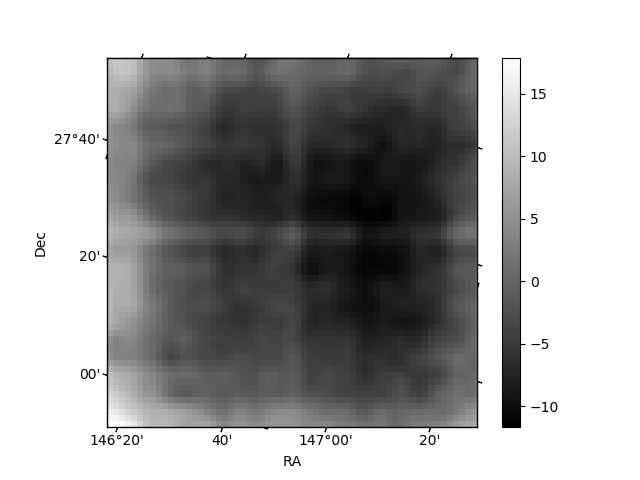
Quadrant B |
|---|---|---|---|
| Quadrant D | 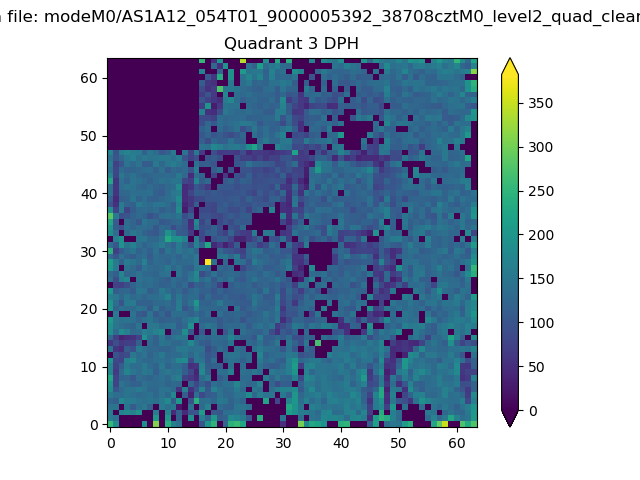 |
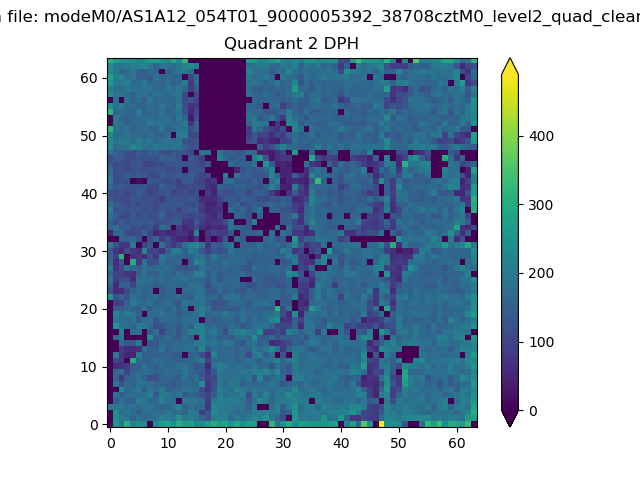 |
Quadrant C |
| Plot type | Count rate plots | Images |
|---|---|---|
| Comparison with Poisson distribution Blue bars denote a histogram of data divided into 1 sec bins. Red curve is a Poisson curve with rate = median count rate of data. |
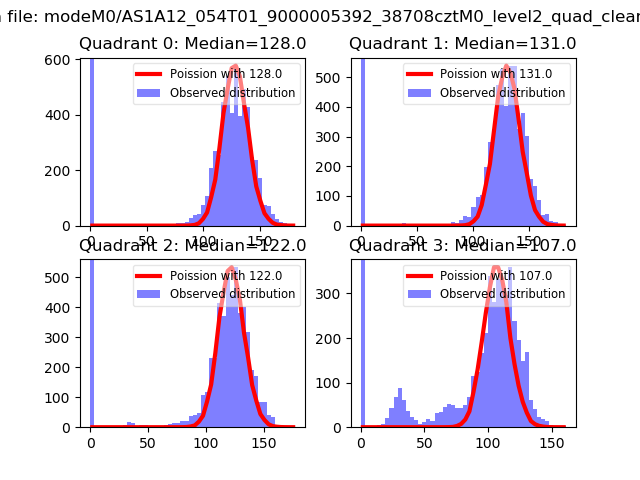 |
 |
| Quadrant-wise count rates Data is divided into 100 sec bins |
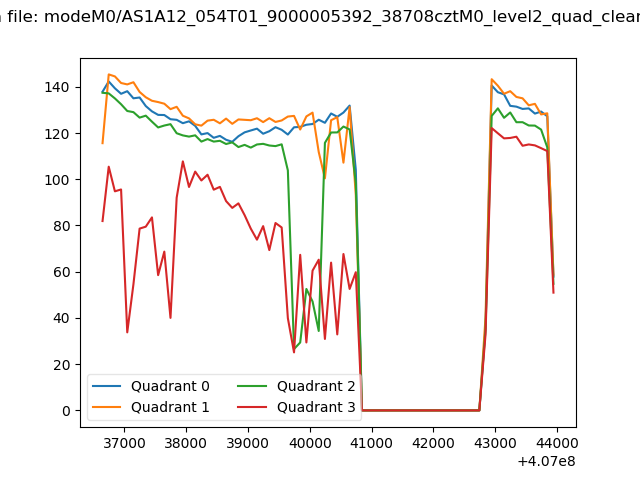 |
|
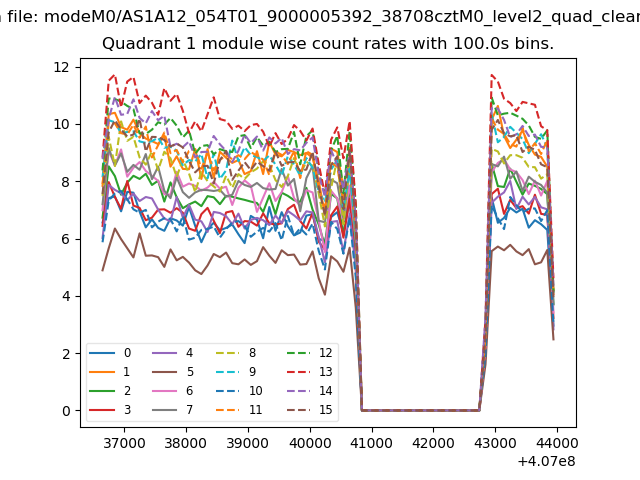
| Module-wise count rates for Quadrant A Data is divided into 100 sec bins |
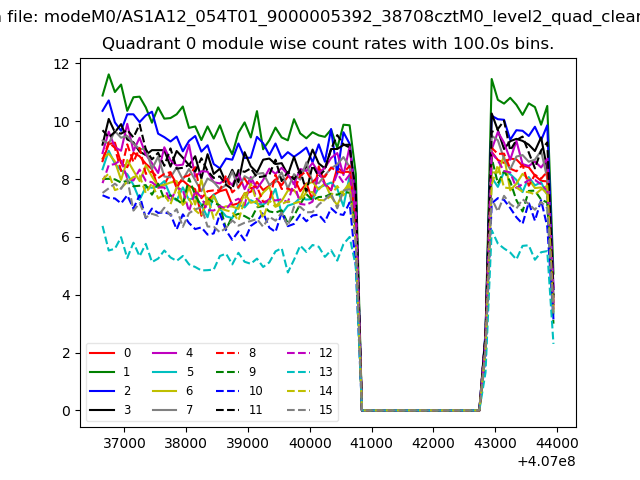 |
 |
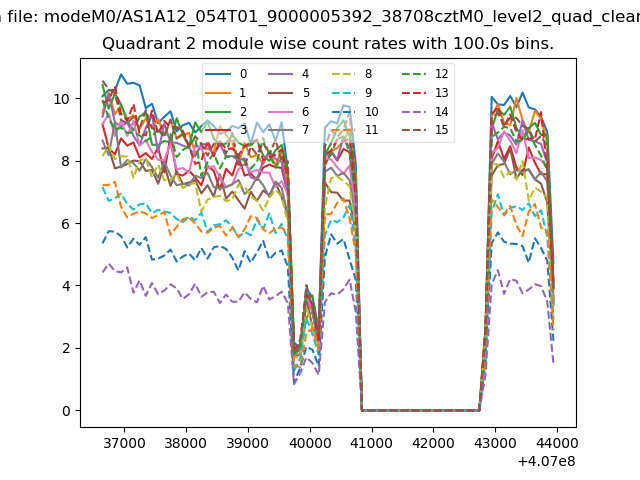
| Module-wise count rates for Quadrant B Data is divided into 100 sec bins |
 |
 |
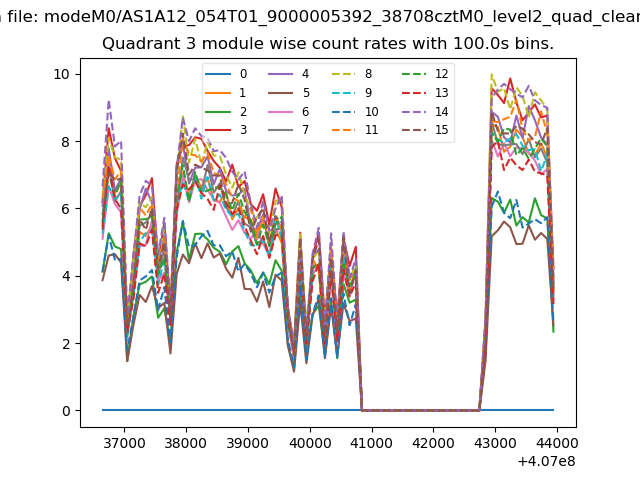
| Module-wise count rates for Quadrant C Data is divided into 100 sec bins |
 |
 |
| Module-wise count rates for Quadrant D Data is divided into 100 sec bins |
 |
 |
| Parameter | Plot |
|---|---|
| CZT HV Monitor | 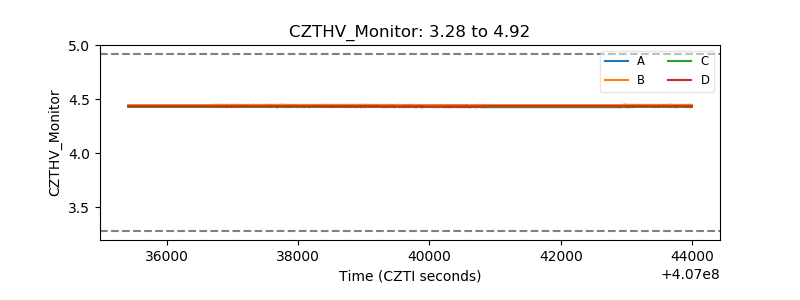 |
| D_VDD | 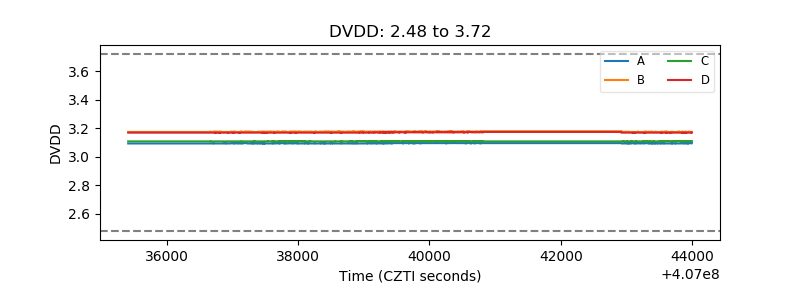 |
| Temperature 1 | 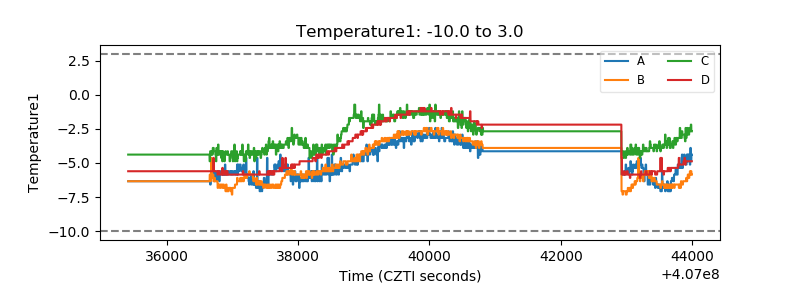 |
| Veto HV Monitor | 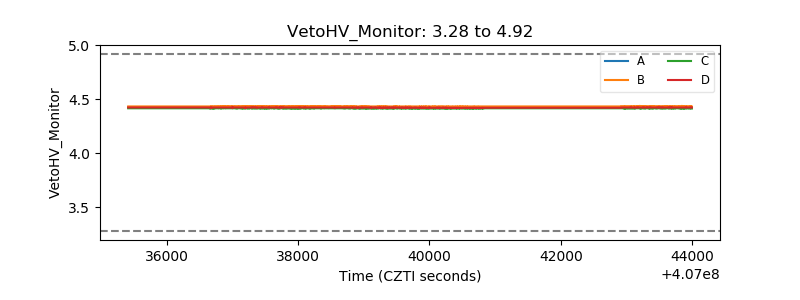 |
| Veto LLD | 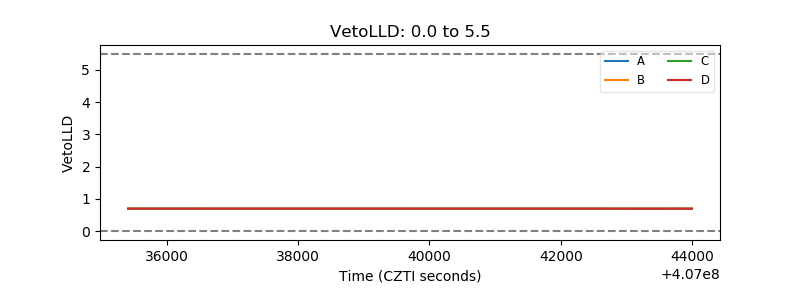 |
| Alpha Counter | 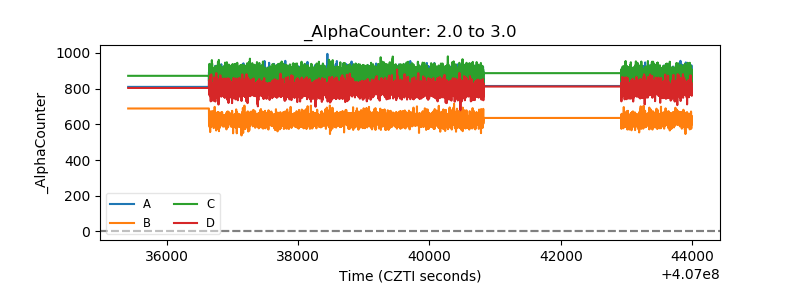 |
| _CPM_Rate | 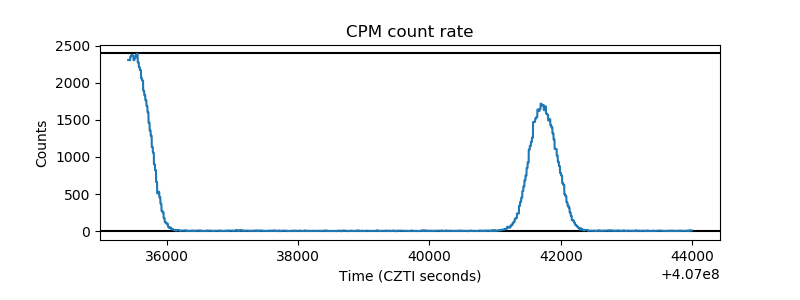 |
| CZT Counter | 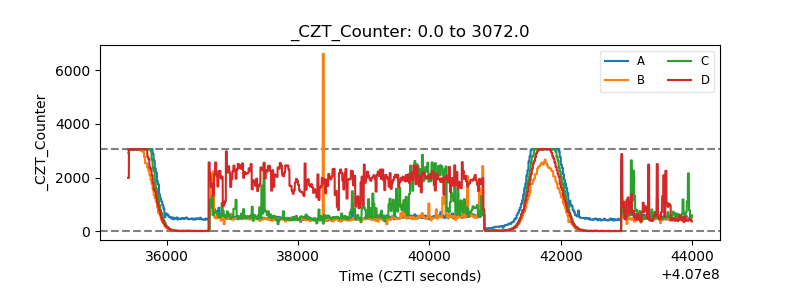 |
| +2.5 Volts monitor | 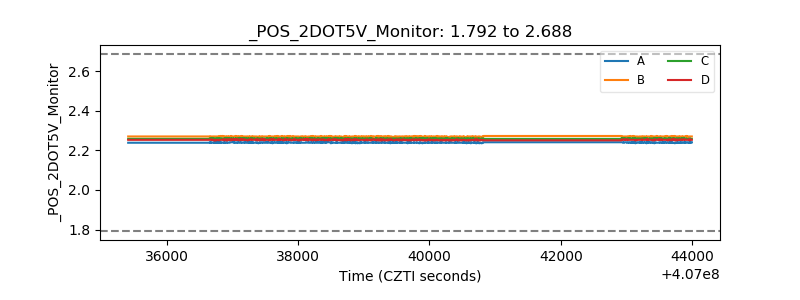 |
| +5 Volts monitor | 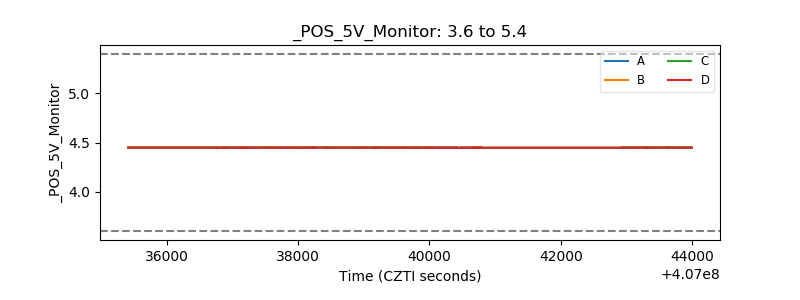 |
| _ROLL_ROT | 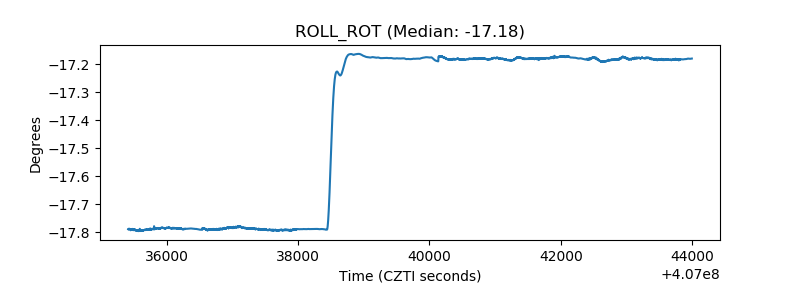 |
| _Roll_DEC | 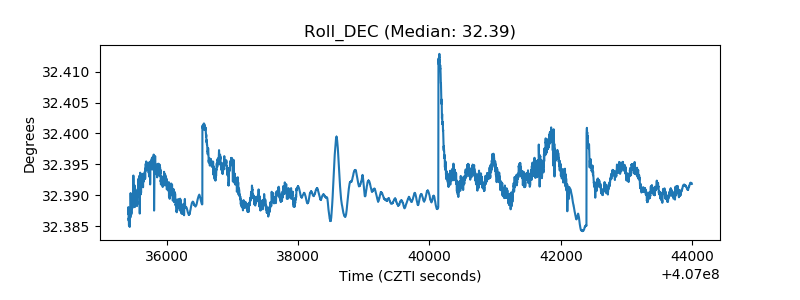 |
| _Roll_RA | 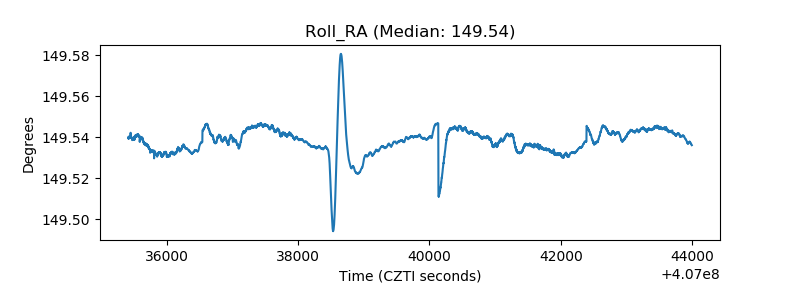 |
| Veto Counter | 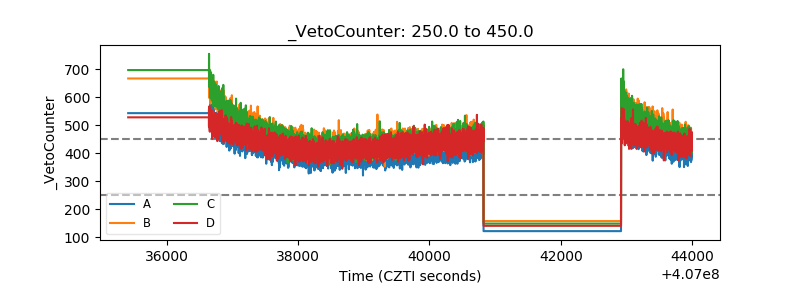 |