| Param | Original file | Final file |
|---|---|---|
| Filename | modeM0/AS1A12_054T01_9000005392_38709cztM0_level2.fits | modeM0/AS1A12_054T01_9000005392_38709cztM0_level2_quad_clean.evt |
| Size (bytes) | 391,950,720 | 88,871,040 |
| Size | 373.8 MB | 84.8 MB |
| Events in quadrant A | 2,797,366 | 642,618 |
| Events in quadrant B | 2,533,135 | 659,216 |
| Events in quadrant C | 3,045,925 | 615,133 |
| Events in quadrant D | 5,728,584 | 410,735 |
| Mode M9 | |||
|---|---|---|---|
| Quadrant | BADHDUFLAG | Total packets | Discarded packets |
| A | 0 | 33 | 0 |
| B | 0 | 33 | 0 |
| C | 0 | 33 | 0 |
| D | 0 | 34 | 0 |
| Mode SS | |||
|---|---|---|---|
| Quadrant | BADHDUFLAG | Total packets | Discarded packets |
| A | 0 | 108 | 0 |
| B | 0 | 108 | 0 |
| C | 0 | 108 | 0 |
| D | 0 | 108 | 0 |
| Mode M0 | |||
|---|---|---|---|
| Quadrant | BADHDUFLAG | Total packets | Discarded packets |
| A | 0 | 11315 | 3 |
| B | 0 | 10859 | 2 |
| C | 0 | 12124 | 2 |
| D | 0 | 20487 | 2 |
| Quadrant | Total seconds | Saturated seconds | Saturation percentage |
|---|---|---|---|
| A | 5180 | 11 | 0.212355% |
| B | 5180 | 15 | 0.289575% |
| C | 5180 | 64 | 1.235521% |
| D | 5180 | 1493 | 28.822394% |
Noise dominated data is calculated using 1-second bins in cleaned event files. If a bin has >2000 counts, and if more than 50% of those come from <1% of pixels, then it is considered to be noise-dominated and hence unusable.
| Quadrant | # 1 sec bins | Bins with >0 counts | Bins with >2000 counts | High rate bins dominated by noise | Noise dominated (total time) | Noise dominated (detector-on time) | Marked lightcurve |
|---|---|---|---|---|---|---|---|
| A | 7302 | 5180 | 7 | 7 | 0.10% | 0.14% | 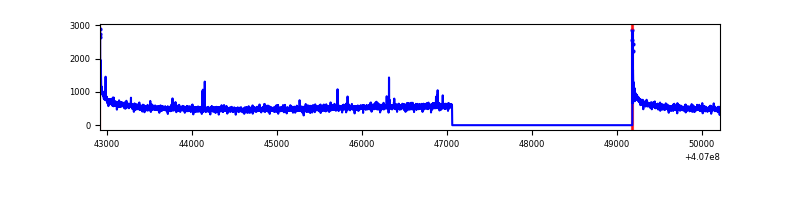 |
| B | 7302 | 5180 | 5 | 5 | 0.07% | 0.10% | 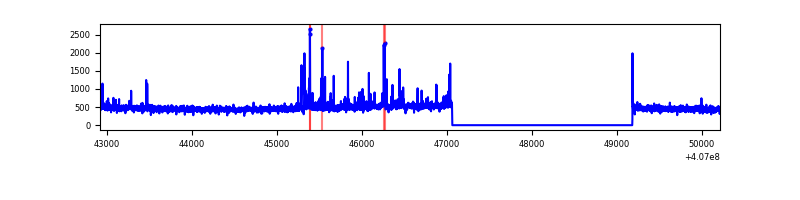 |
| C | 7302 | 5180 | 57 | 57 | 0.78% | 1.10% | 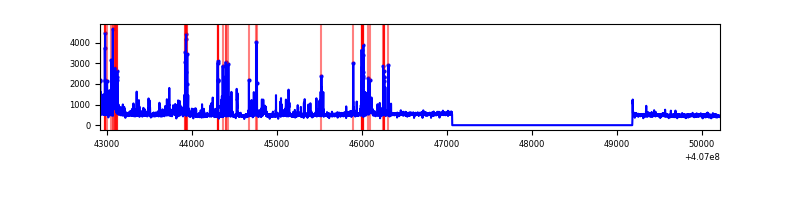 |
| D | 7302 | 5180 | 1249 | 1249 | 17.10% | 24.11% | 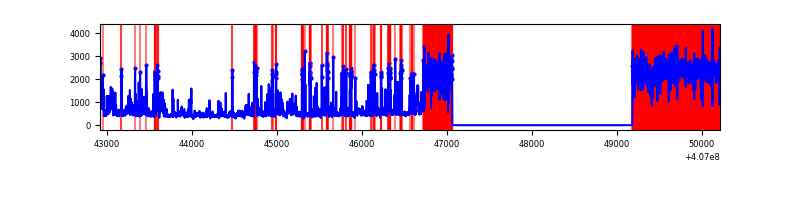 |
Top three noisy pixels from each quadrant. If the there are fewer than three noisy pixels in the level2.evt file, extra rows are filled as -1
| Pixel properties | Quadrant properties | ||||||
|---|---|---|---|---|---|---|---|
| Quadrant | DetID | PixID | Counts | Sigma | Mean | Median | Sigma |
| A | 10 | 83 | 395703 | 3230.67 | 607 | 596 | 122.3 |
| A | 0 | 8 | 30266 | 242.6 | 607 | 596 | 122.3 |
| A | 13 | 248 | 14316 | 112.18 | 607 | 596 | 122.3 |
| B | 4 | 171 | 92752 | 798.5 | 602 | 587 | 115.4 |
| B | 5 | 200 | 23409 | 197.72 | 602 | 587 | 115.4 |
| B | 15 | 85 | 19048 | 159.94 | 602 | 587 | 115.4 |
| C | 14 | 254 | 518935 | 3852.43 | 583 | 586 | 134.6 |
| C | 15 | 214 | 214270 | 1588.13 | 583 | 586 | 134.6 |
| C | 3 | 110 | 13180 | 93.6 | 583 | 586 | 134.6 |
| D | 2 | 16 | 3119537 | 25068.93 | 506 | 492 | 124.4 |
| D | 12 | 227 | 314350 | 2522.59 | 506 | 492 | 124.4 |
| D | 12 | 235 | 77942 | 622.49 | 506 | 492 | 124.4 |
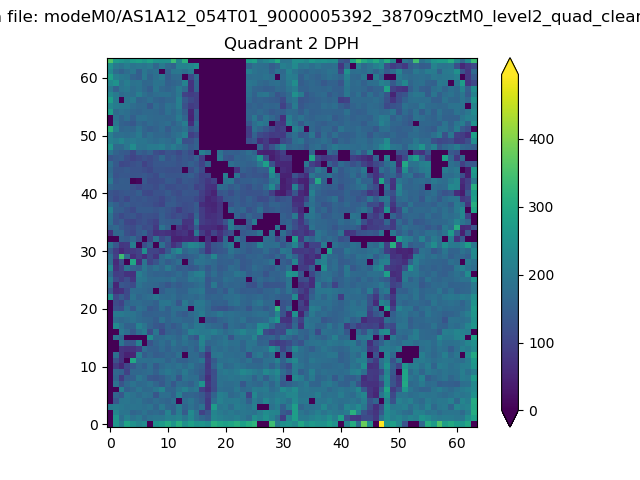
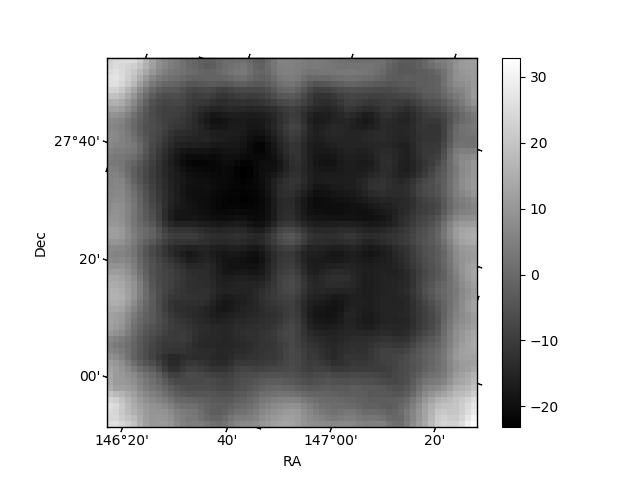
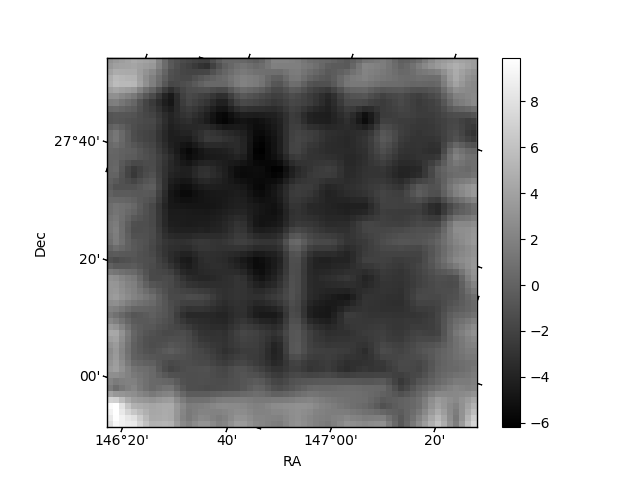
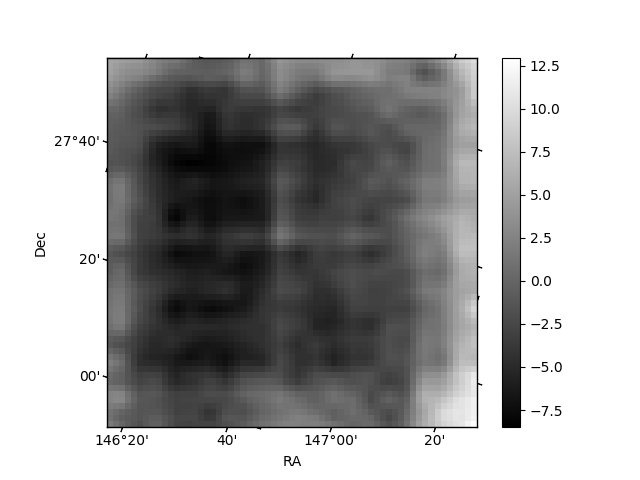
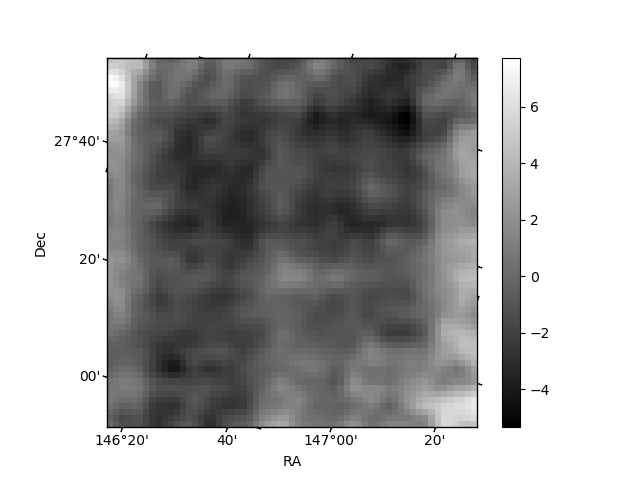
Histogram calculated using DETX and DETY for each event in the final _common_clean file
| Quadrant A | 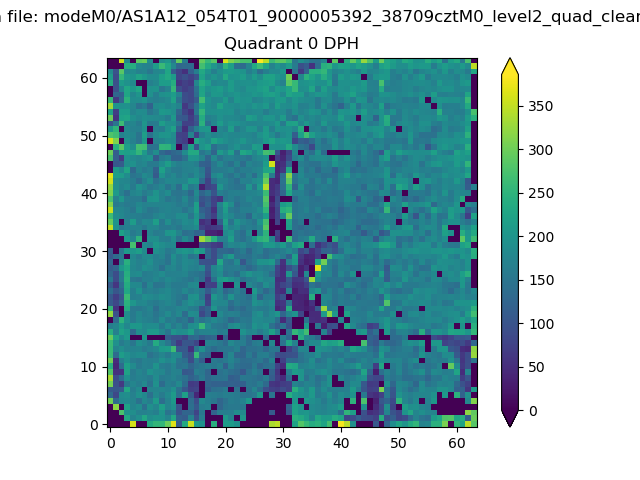 |
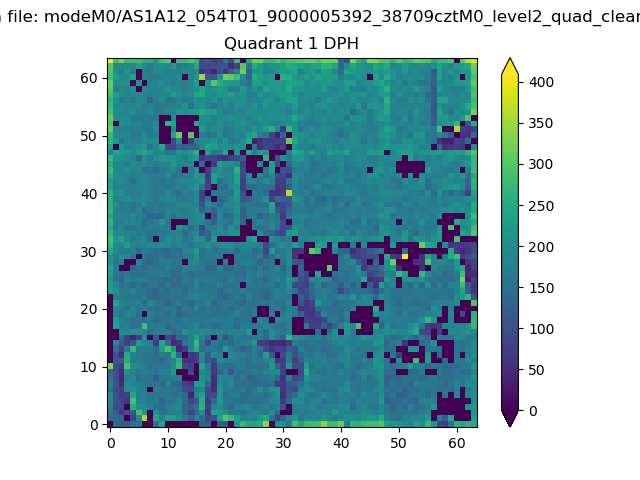 |
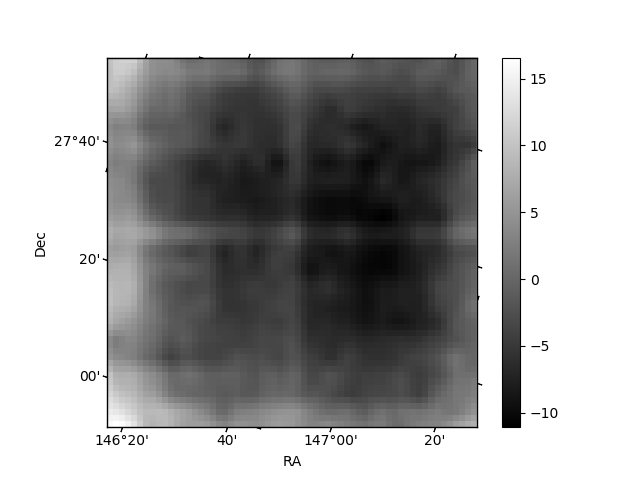
Quadrant B |
|---|---|---|---|
| Quadrant D | 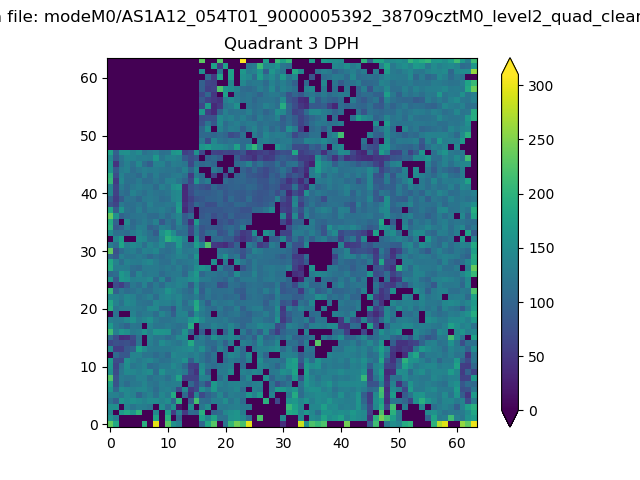 |
 |
Quadrant C |
| Plot type | Count rate plots | Images |
|---|---|---|
| Comparison with Poisson distribution Blue bars denote a histogram of data divided into 1 sec bins. Red curve is a Poisson curve with rate = median count rate of data. |
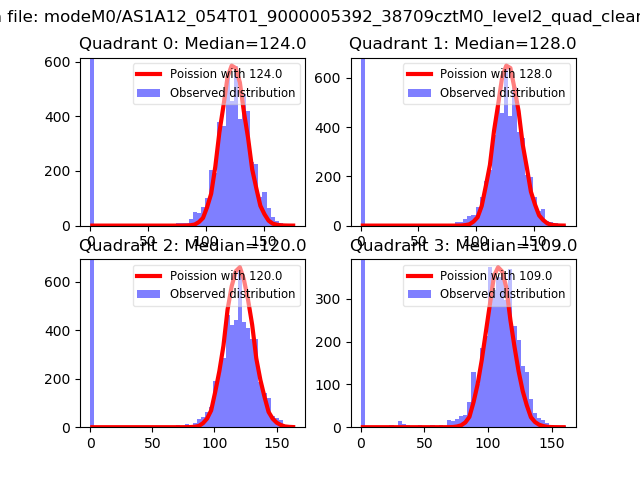 |
 |
| Quadrant-wise count rates Data is divided into 100 sec bins |
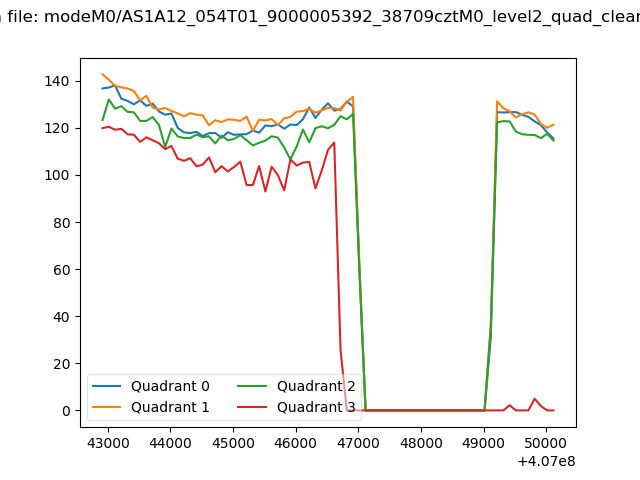 |
|
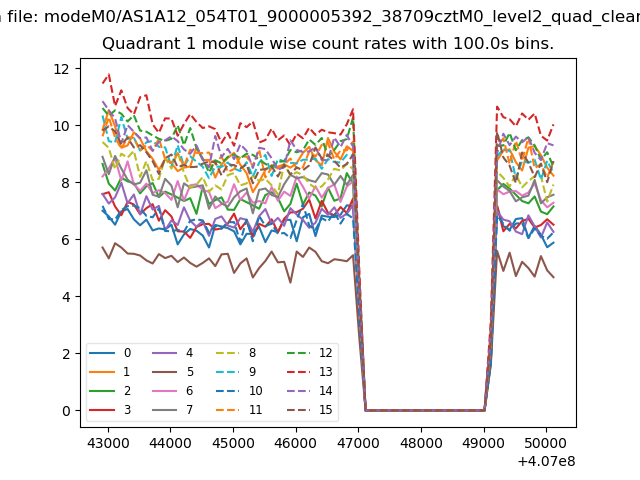
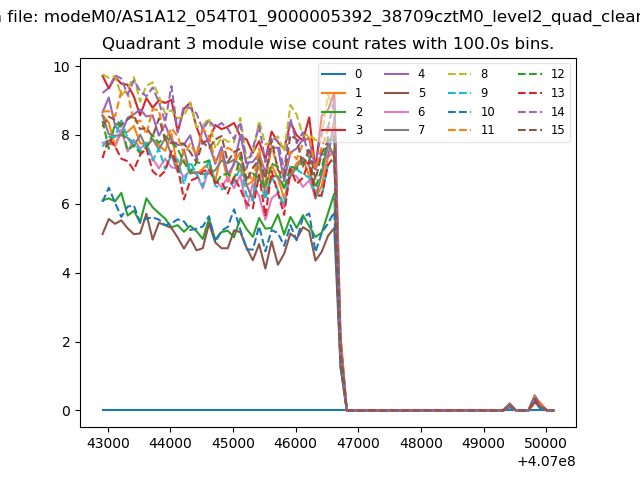
| Module-wise count rates for Quadrant A Data is divided into 100 sec bins |
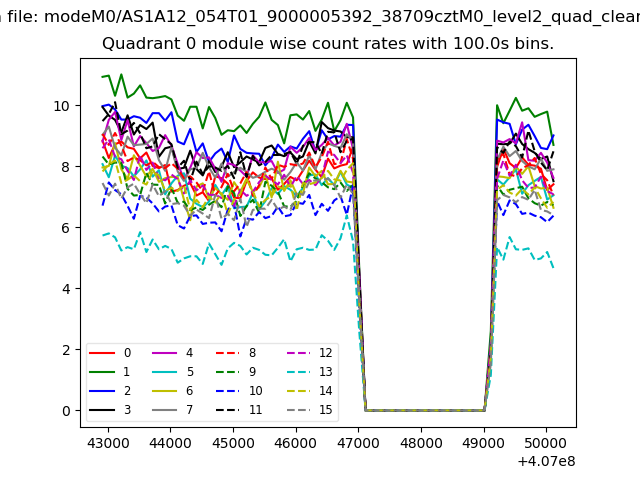 |
 |
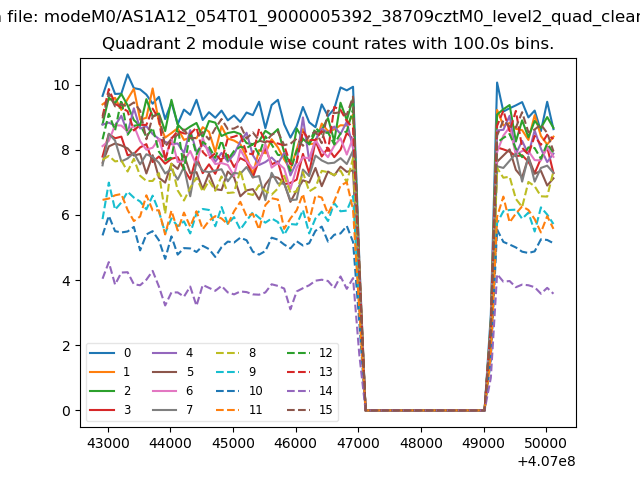
| Module-wise count rates for Quadrant B Data is divided into 100 sec bins |
 |
 |
| Module-wise count rates for Quadrant C Data is divided into 100 sec bins |
 |
 |
| Module-wise count rates for Quadrant D Data is divided into 100 sec bins |
 |
 |
| Parameter | Plot |
|---|---|
| CZT HV Monitor | 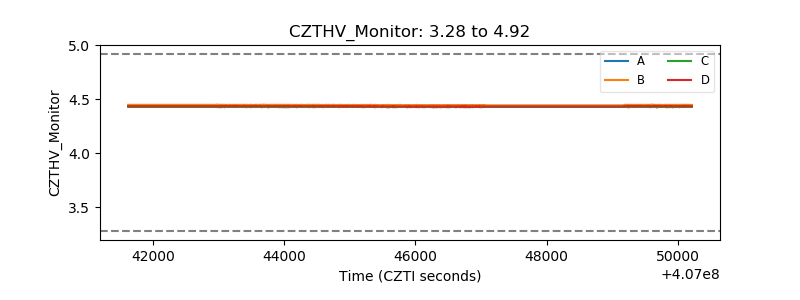 |
| D_VDD | 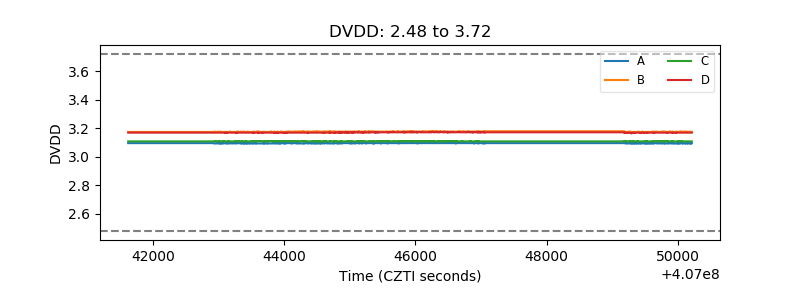 |
| Temperature 1 | 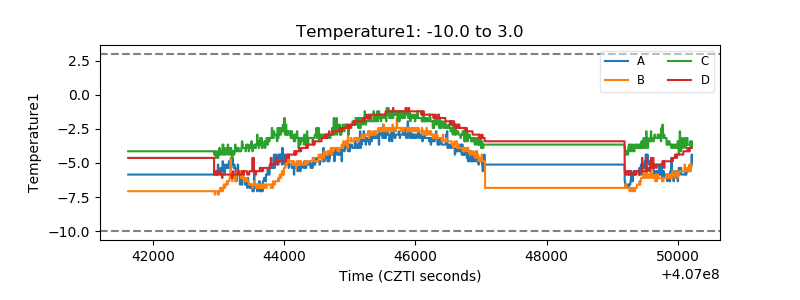 |
| Veto HV Monitor | 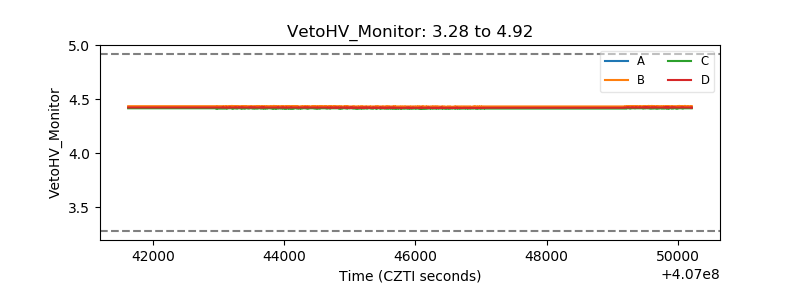 |
| Veto LLD | 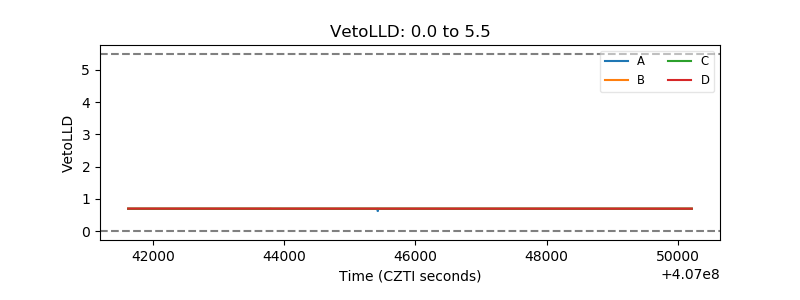 |
| Alpha Counter | 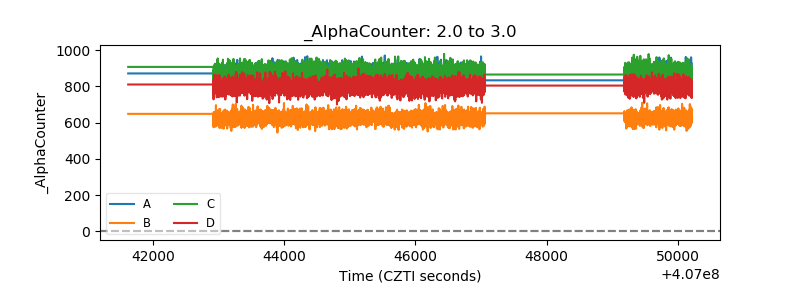 |
| _CPM_Rate | 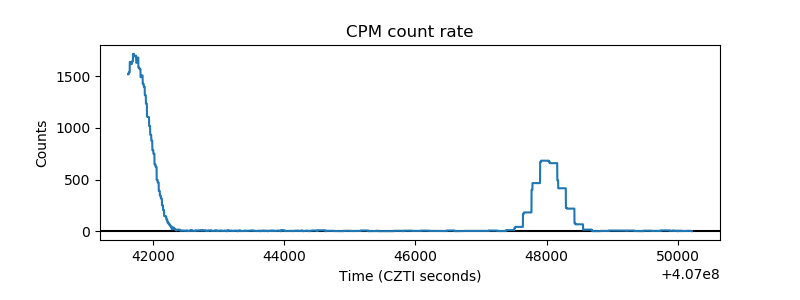 |
| CZT Counter | 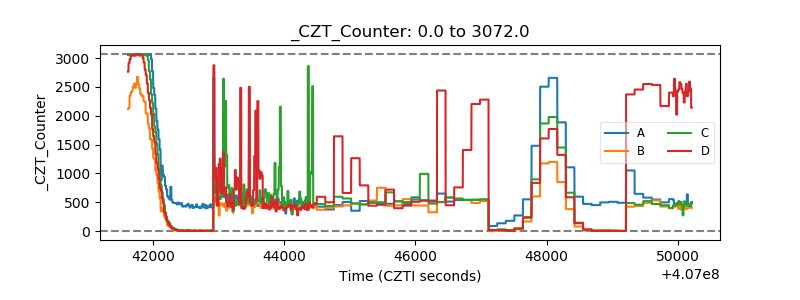 |
| +2.5 Volts monitor | 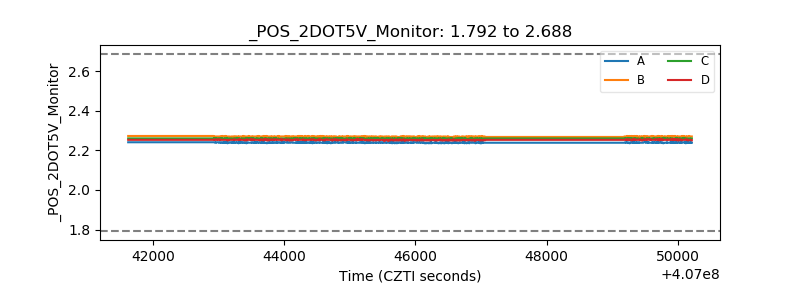 |
| +5 Volts monitor | 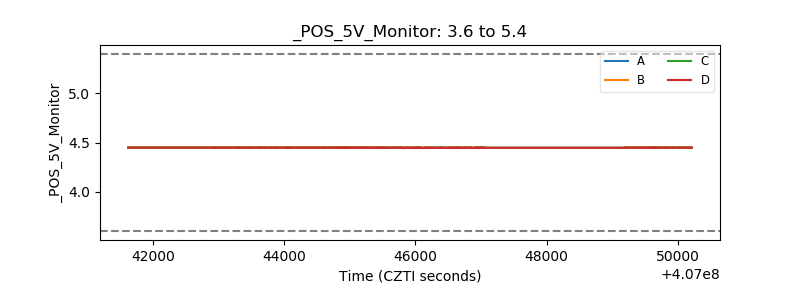 |
| _ROLL_ROT | 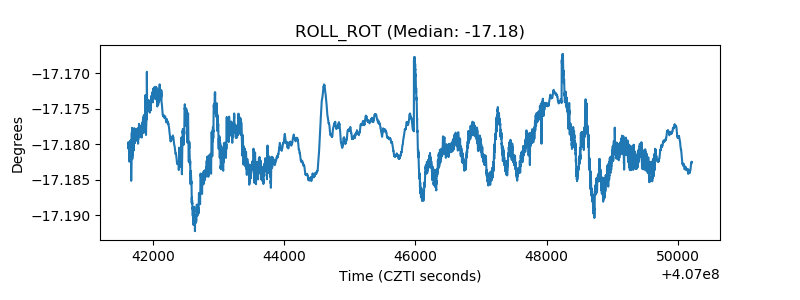 |
| _Roll_DEC | 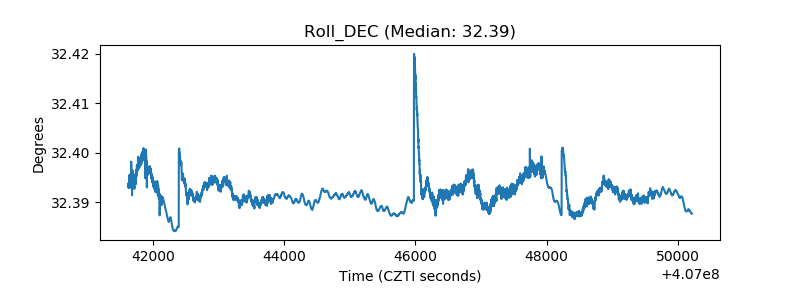 |
| _Roll_RA | 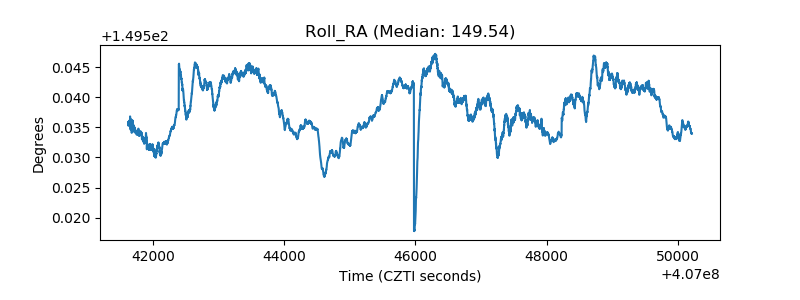 |
| Veto Counter | 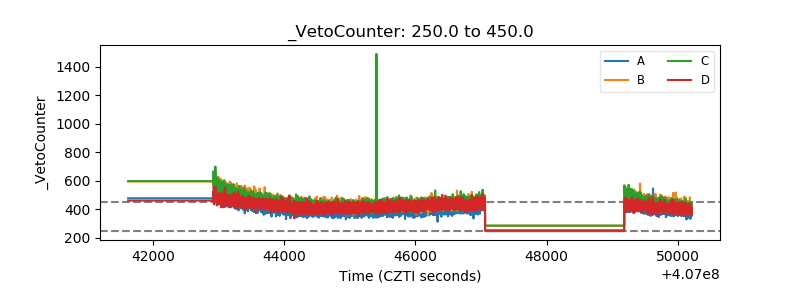 |