| Param | Original file | Final file |
|---|---|---|
| Filename | modeM0/AS1A12_054T01_9000005392_38710cztM0_level2.fits | modeM0/AS1A12_054T01_9000005392_38710cztM0_level2_quad_clean.evt |
| Size (bytes) | 512,815,680 | 76,423,680 |
| Size | 489.1 MB | 72.9 MB |
| Events in quadrant A | 2,770,266 | 608,448 |
| Events in quadrant B | 2,399,393 | 623,899 |
| Events in quadrant C | 2,496,802 | 584,736 |
| Events in quadrant D | 10,917,422 | 138,848 |
| Mode M9 | |||
|---|---|---|---|
| Quadrant | BADHDUFLAG | Total packets | Discarded packets |
| A | 0 | 21 | 0 |
| B | 0 | 21 | 0 |
| C | 0 | 21 | 0 |
| D | 0 | 21 | 0 |
| Mode SS | |||
|---|---|---|---|
| Quadrant | BADHDUFLAG | Total packets | Discarded packets |
| A | 0 | 104 | 0 |
| B | 0 | 104 | 0 |
| C | 0 | 104 | 0 |
| D | 0 | 104 | 0 |
| Mode M0 | |||
|---|---|---|---|
| Quadrant | BADHDUFLAG | Total packets | Discarded packets |
| A | 0 | 11212 | 3 |
| B | 0 | 10409 | 2 |
| C | 0 | 10483 | 2 |
| D | 0 | 35872 | 2 |
| Quadrant | Total seconds | Saturated seconds | Saturation percentage |
|---|---|---|---|
| A | 5111 | 14 | 0.273919% |
| B | 5111 | 11 | 0.215222% |
| C | 5111 | 5 | 0.097828% |
| D | 5112 | 4025 | 78.736307% |
Noise dominated data is calculated using 1-second bins in cleaned event files. If a bin has >2000 counts, and if more than 50% of those come from <1% of pixels, then it is considered to be noise-dominated and hence unusable.
| Quadrant | # 1 sec bins | Bins with >0 counts | Bins with >2000 counts | High rate bins dominated by noise | Noise dominated (total time) | Noise dominated (detector-on time) | Marked lightcurve |
|---|---|---|---|---|---|---|---|
| A | 7174 | 5112 | 10 | 10 | 0.14% | 0.20% | 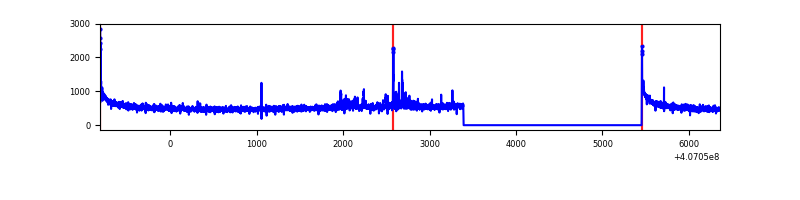 |
| B | 7174 | 5112 | 2 | 2 | 0.03% | 0.04% | 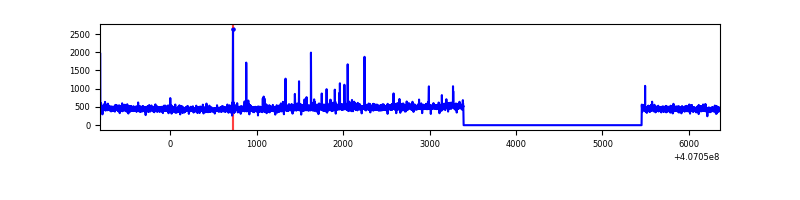 |
| C | 7174 | 5112 | 2 | 2 | 0.03% | 0.04% | 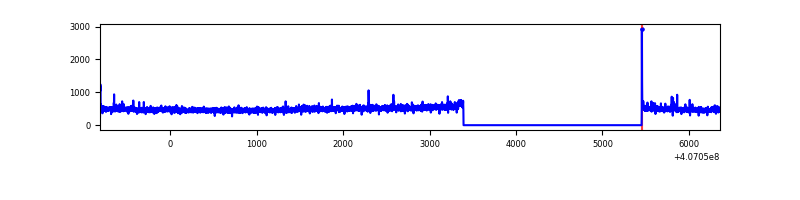 |
| D | 7175 | 5113 | 3508 | 3508 | 48.89% | 68.61% | 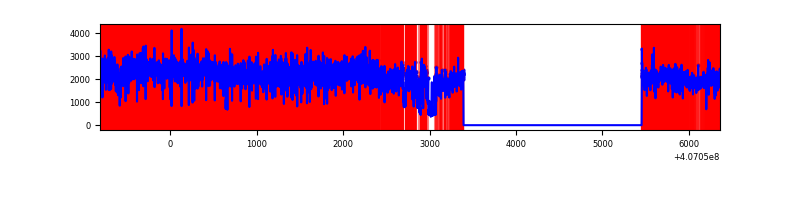 |
Top three noisy pixels from each quadrant. If the there are fewer than three noisy pixels in the level2.evt file, extra rows are filled as -1
| Pixel properties | Quadrant properties | ||||||
|---|---|---|---|---|---|---|---|
| Quadrant | DetID | PixID | Counts | Sigma | Mean | Median | Sigma |
| A | 10 | 83 | 392178 | 3264.8 | 591 | 580 | 119.9 |
| A | 0 | 8 | 78092 | 646.23 | 591 | 580 | 119.9 |
| A | 13 | 254 | 7850 | 60.61 | 591 | 580 | 119.9 |
| B | 4 | 171 | 33477 | 294.2 | 584 | 569 | 111.9 |
| B | 0 | 230 | 24237 | 211.59 | 584 | 569 | 111.9 |
| B | 4 | 81 | 14121 | 121.15 | 584 | 569 | 111.9 |
| C | 15 | 214 | 214791 | 1617.89 | 570 | 575 | 132.4 |
| C | 15 | 208 | 17333 | 126.57 | 570 | 575 | 132.4 |
| C | 0 | 10 | 13997 | 101.37 | 570 | 575 | 132.4 |
| D | 2 | 16 | 8920940 | 91611.71 | 399 | 387 | 97.4 |
| D | 12 | 235 | 252570 | 2589.85 | 399 | 387 | 97.4 |
| D | 5 | 222 | 50406 | 513.68 | 399 | 387 | 97.4 |
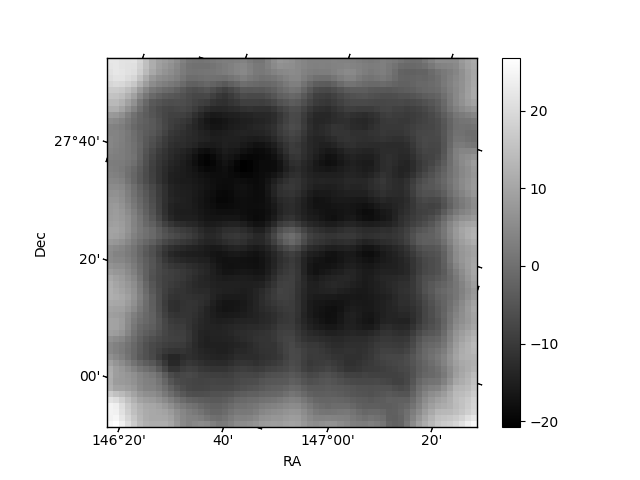
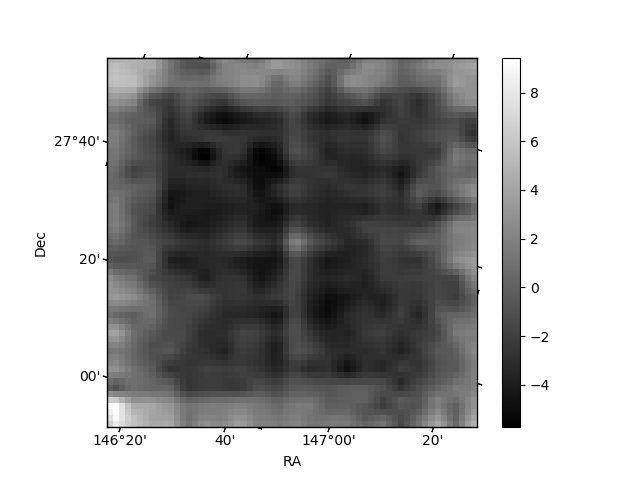
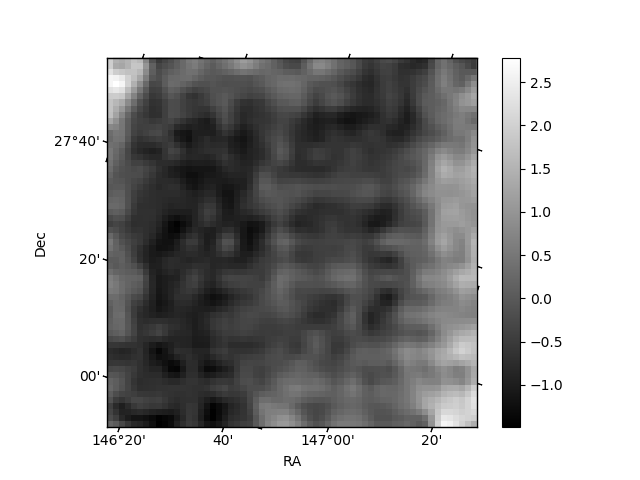
Histogram calculated using DETX and DETY for each event in the final _common_clean file
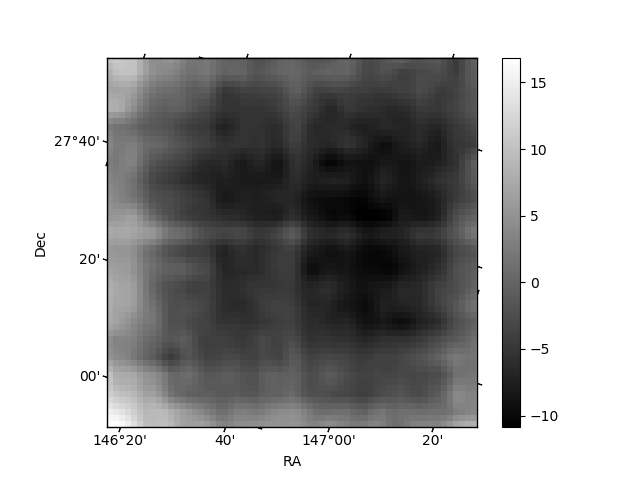
| Quadrant A | 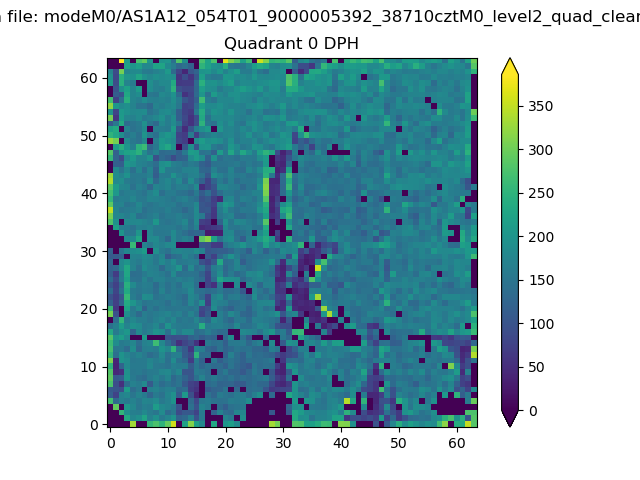 |
 |
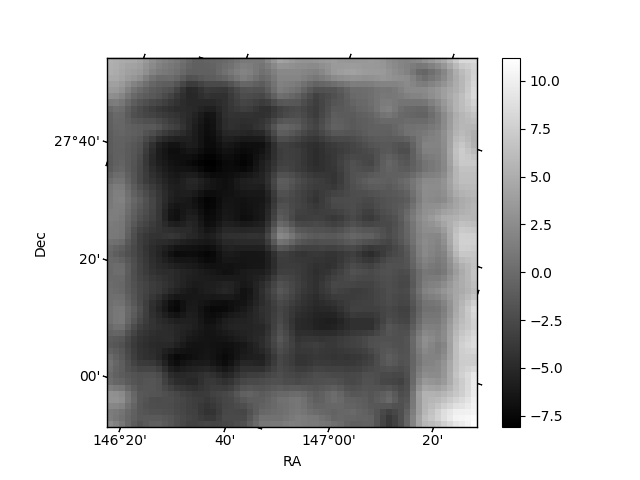
Quadrant B |
|---|---|---|---|
| Quadrant D | 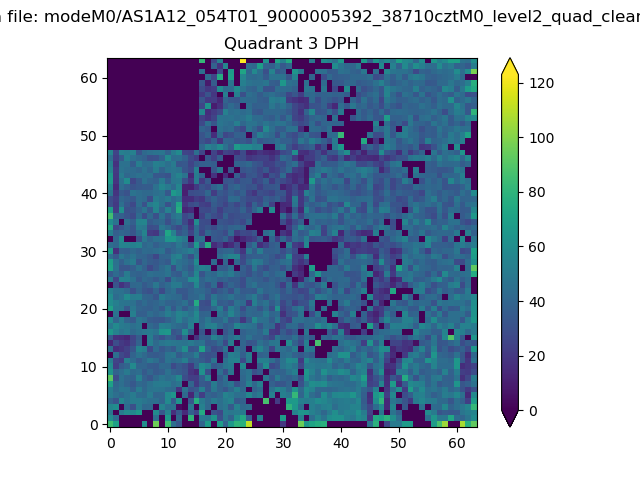 |
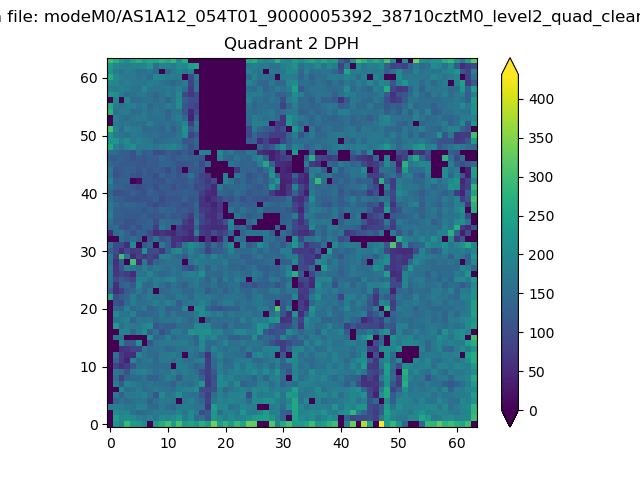 |
Quadrant C |
| Plot type | Count rate plots | Images |
|---|---|---|
| Comparison with Poisson distribution Blue bars denote a histogram of data divided into 1 sec bins. Red curve is a Poisson curve with rate = median count rate of data. |
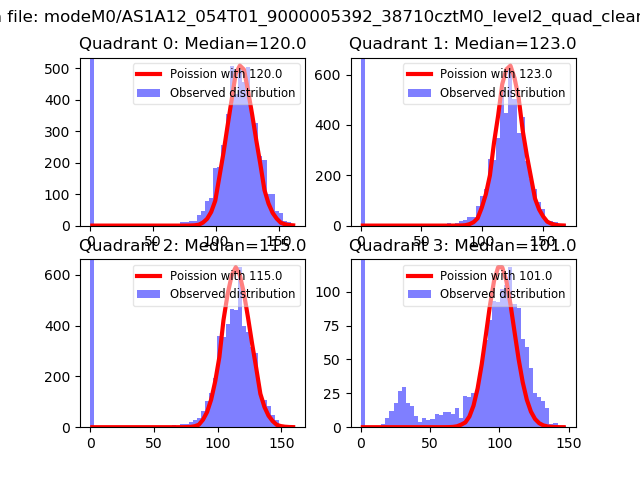 |
 |
| Quadrant-wise count rates Data is divided into 100 sec bins |
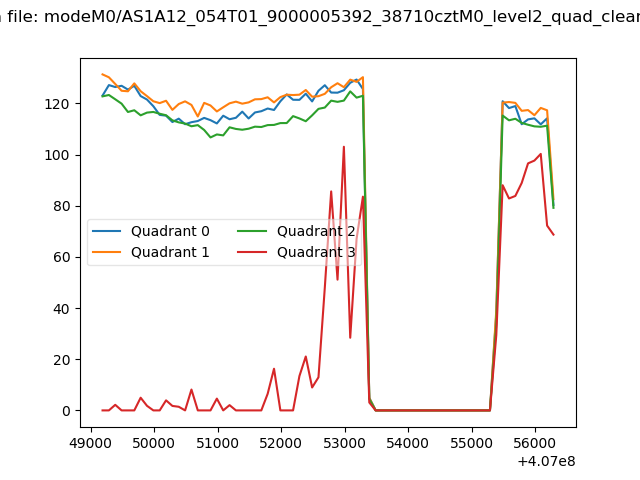 |
|
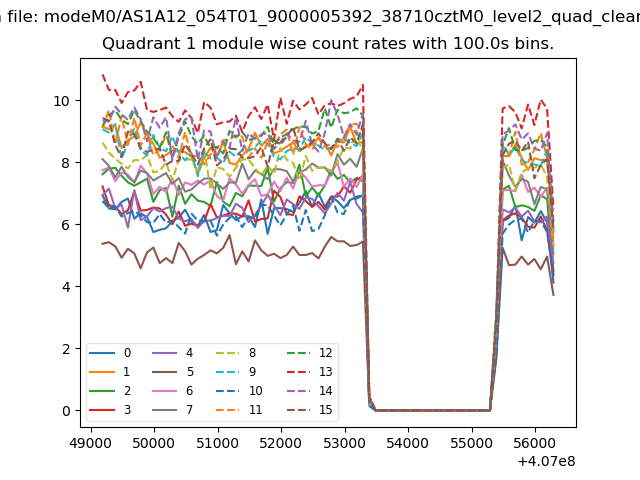
| Module-wise count rates for Quadrant A Data is divided into 100 sec bins |
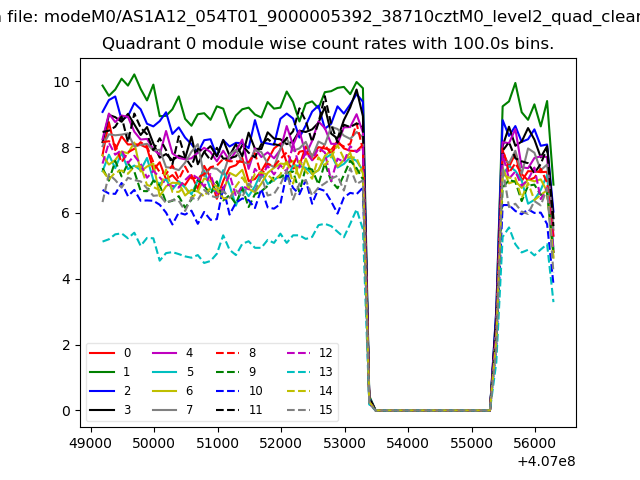 |
 |
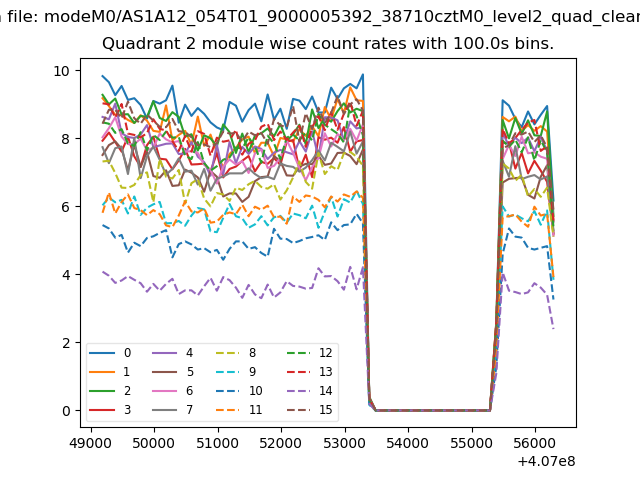
| Module-wise count rates for Quadrant B Data is divided into 100 sec bins |
 |
 |
| Module-wise count rates for Quadrant C Data is divided into 100 sec bins |
 |
 |
| Module-wise count rates for Quadrant D Data is divided into 100 sec bins |
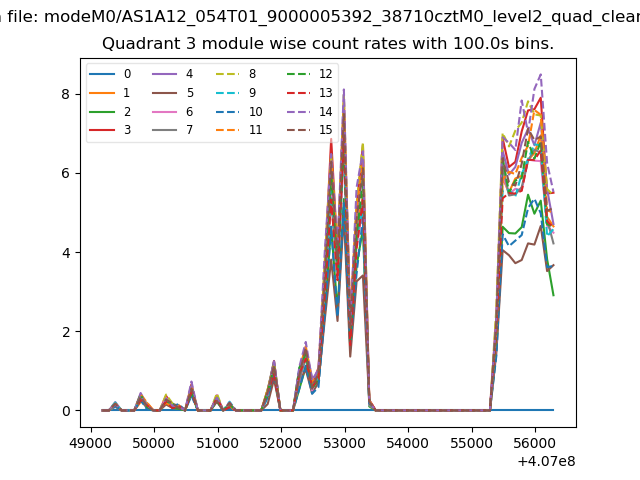 |
 |
| Parameter | Plot |
|---|---|
| CZT HV Monitor | 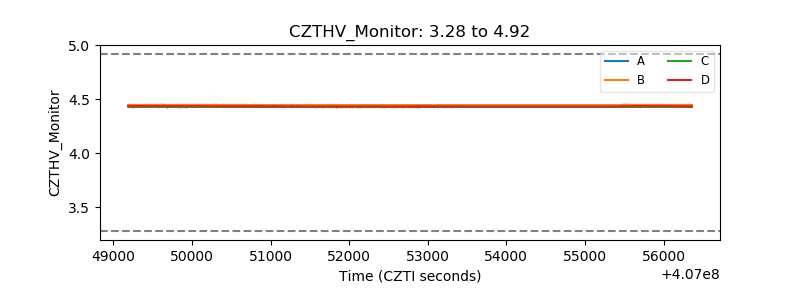 |
| D_VDD | 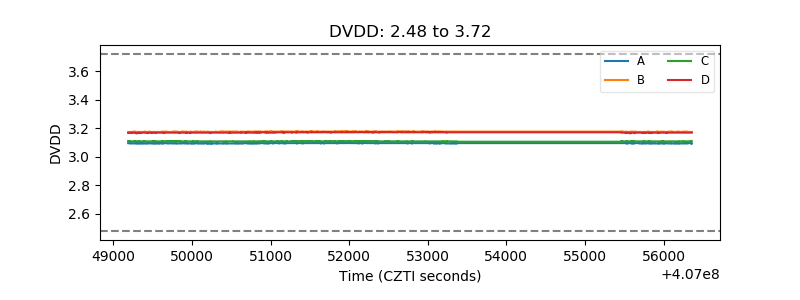 |
| Temperature 1 | 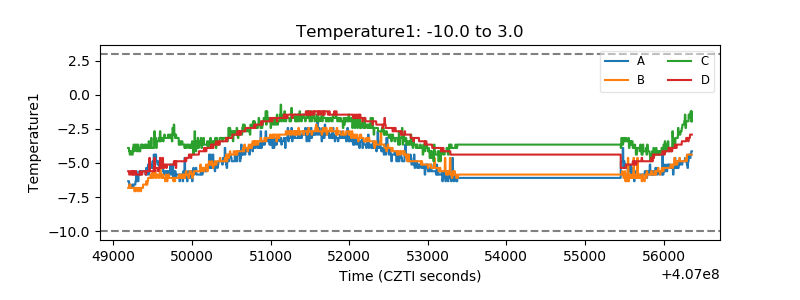 |
| Veto HV Monitor | 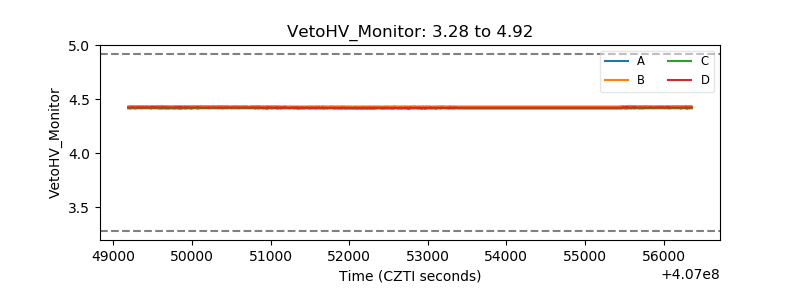 |
| Veto LLD | 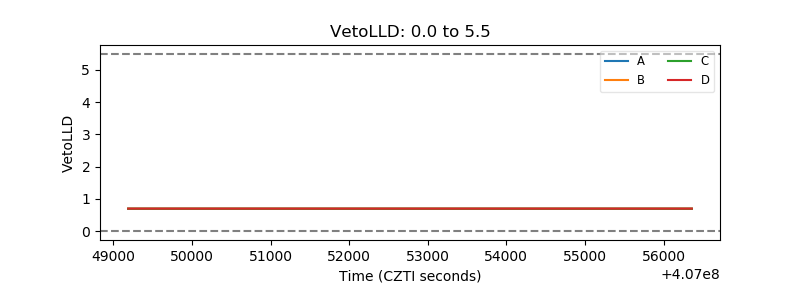 |
| Alpha Counter | 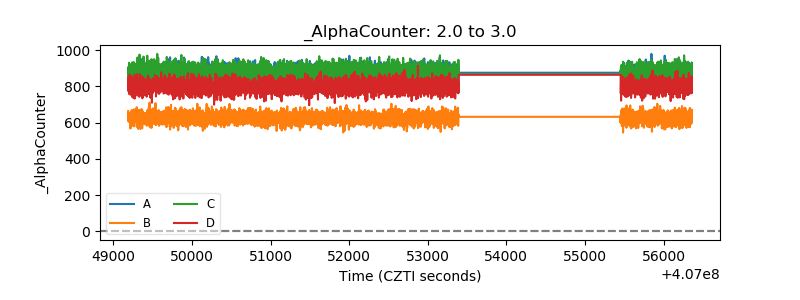 |
| _CPM_Rate | 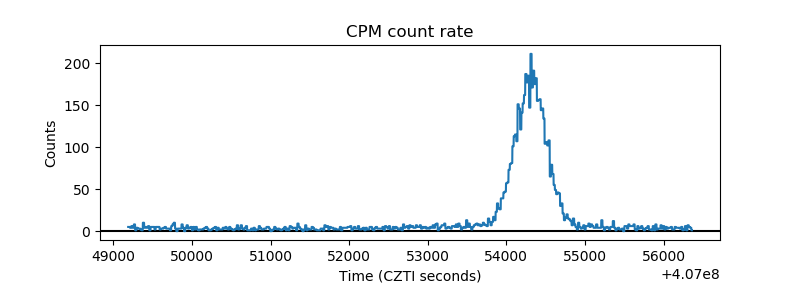 |
| CZT Counter | 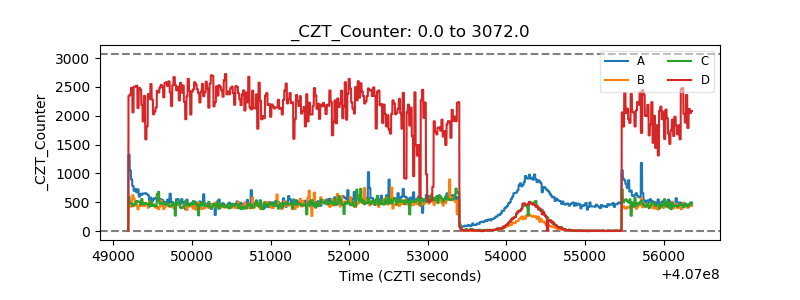 |
| +2.5 Volts monitor | 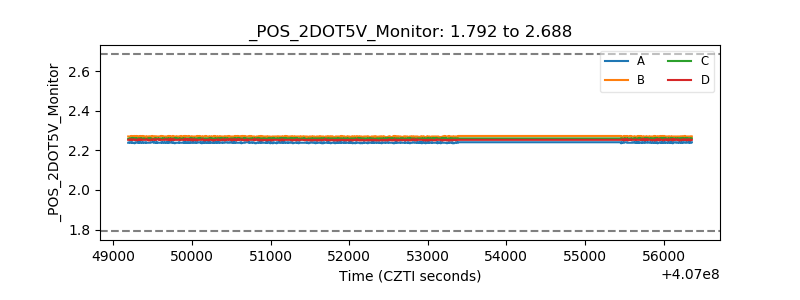 |
| +5 Volts monitor | 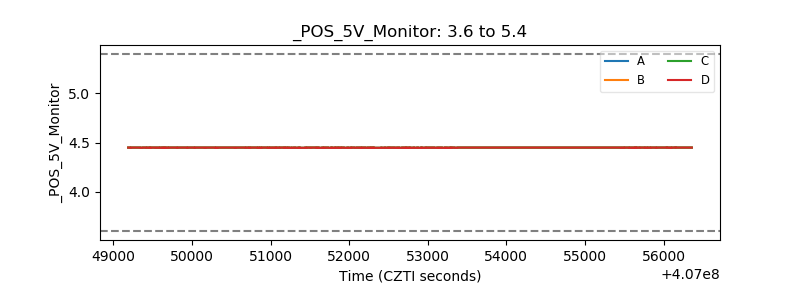 |
| _ROLL_ROT | 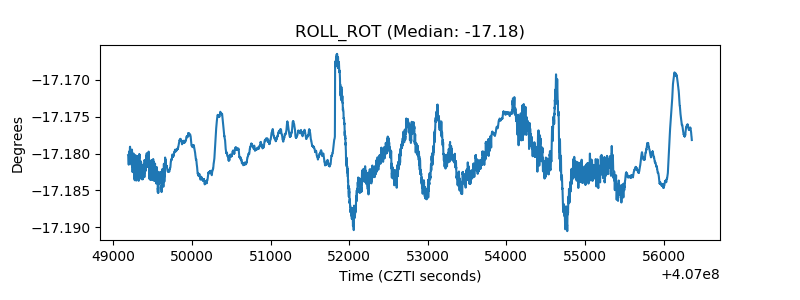 |
| _Roll_DEC | 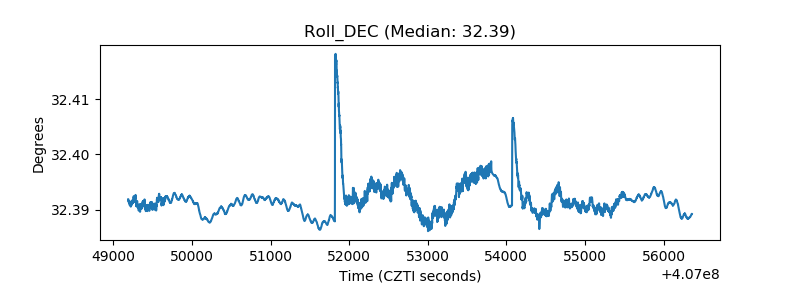 |
| _Roll_RA | 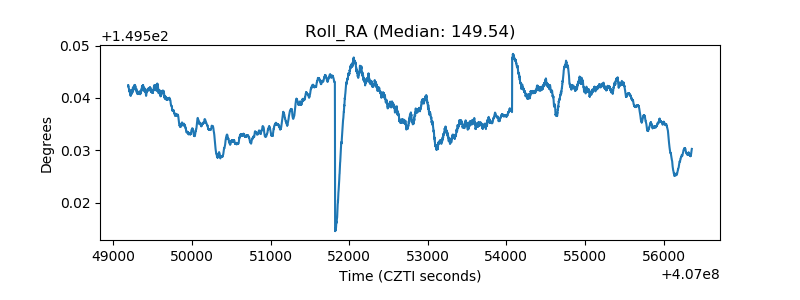 |
| Veto Counter | 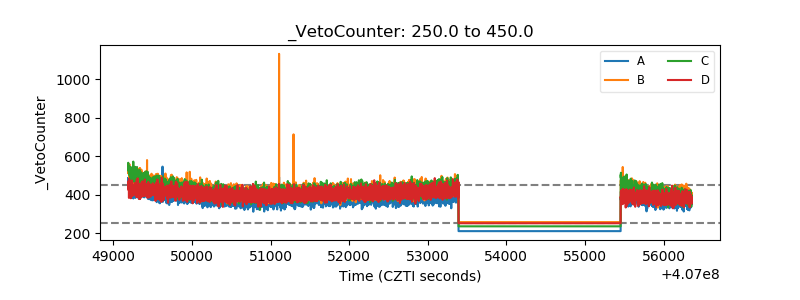 |