| Param | Original file | Final file |
|---|---|---|
| Filename | modeM0/AS1A12_054T01_9000005392_38711cztM0_level2.fits | modeM0/AS1A12_054T01_9000005392_38711cztM0_level2_quad_clean.evt |
| Size (bytes) | 516,744,000 | 80,622,720 |
| Size | 492.8 MB | 76.9 MB |
| Events in quadrant A | 2,916,860 | 595,355 |
| Events in quadrant B | 2,511,224 | 611,288 |
| Events in quadrant C | 2,622,288 | 578,109 |
| Events in quadrant D | 10,672,613 | 291,065 |
| Mode M9 | |||
|---|---|---|---|
| Quadrant | BADHDUFLAG | Total packets | Discarded packets |
| A | 0 | 30 | 0 |
| B | 0 | 30 | 0 |
| C | 0 | 30 | 0 |
| D | 0 | 31 | 0 |
| Mode SS | |||
|---|---|---|---|
| Quadrant | BADHDUFLAG | Total packets | Discarded packets |
| A | 0 | 106 | 0 |
| B | 0 | 106 | 0 |
| C | 0 | 106 | 0 |
| D | 0 | 106 | 0 |
| Mode M0 | |||
|---|---|---|---|
| Quadrant | BADHDUFLAG | Total packets | Discarded packets |
| A | 0 | 11744 | 3 |
| B | 0 | 10849 | 2 |
| C | 0 | 10843 | 2 |
| D | 0 | 35287 | 2 |
| Quadrant | Total seconds | Saturated seconds | Saturation percentage |
|---|---|---|---|
| A | 5211 | 26 | 0.498945% |
| B | 5211 | 14 | 0.268662% |
| C | 5211 | 10 | 0.191902% |
| D | 5211 | 2869 | 55.056611% |
Noise dominated data is calculated using 1-second bins in cleaned event files. If a bin has >2000 counts, and if more than 50% of those come from <1% of pixels, then it is considered to be noise-dominated and hence unusable.
| Quadrant | # 1 sec bins | Bins with >0 counts | Bins with >2000 counts | High rate bins dominated by noise | Noise dominated (total time) | Noise dominated (detector-on time) | Marked lightcurve |
|---|---|---|---|---|---|---|---|
| A | 7065 | 5212 | 19 | 19 | 0.27% | 0.36% | 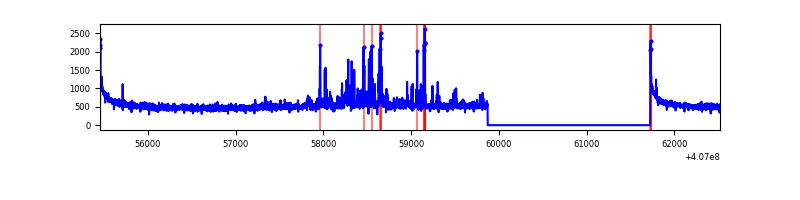 |
| B | 7065 | 5212 | 4 | 4 | 0.06% | 0.08% | 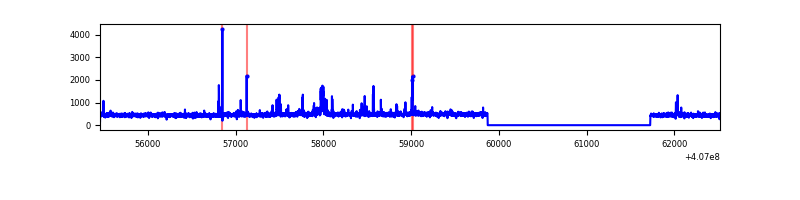 |
| C | 7065 | 5212 | 4 | 4 | 0.06% | 0.08% | 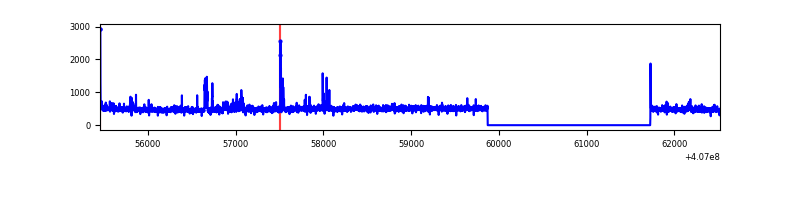 |
| D | 7065 | 5212 | 3046 | 3046 | 43.11% | 58.44% | 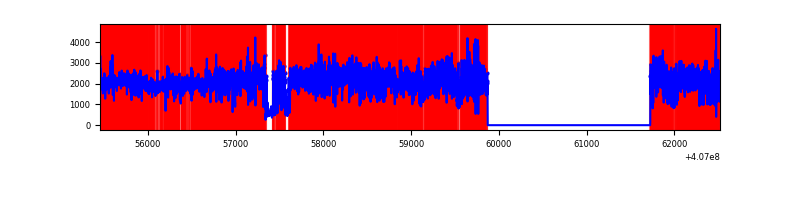 |
Top three noisy pixels from each quadrant. If the there are fewer than three noisy pixels in the level2.evt file, extra rows are filled as -1
| Pixel properties | Quadrant properties | ||||||
|---|---|---|---|---|---|---|---|
| Quadrant | DetID | PixID | Counts | Sigma | Mean | Median | Sigma |
| A | 10 | 83 | 400721 | 3282.35 | 594 | 582 | 121.9 |
| A | 0 | 8 | 206100 | 1685.87 | 594 | 582 | 121.9 |
| A | 13 | 254 | 8351 | 63.73 | 594 | 582 | 121.9 |
| B | 4 | 171 | 97740 | 853.73 | 588 | 572 | 113.8 |
| B | 15 | 85 | 48345 | 419.74 | 588 | 572 | 113.8 |
| B | 0 | 230 | 14520 | 122.55 | 588 | 572 | 113.8 |
| C | 15 | 214 | 216971 | 1598.12 | 577 | 579 | 135.4 |
| C | 3 | 110 | 55057 | 402.34 | 577 | 579 | 135.4 |
| C | 15 | 208 | 50235 | 366.72 | 577 | 579 | 135.4 |
| D | 2 | 16 | 7524543 | 61664.12 | 495 | 479 | 122.0 |
| D | 12 | 235 | 357697 | 2927.61 | 495 | 479 | 122.0 |
| D | 5 | 222 | 271310 | 2219.61 | 495 | 479 | 122.0 |
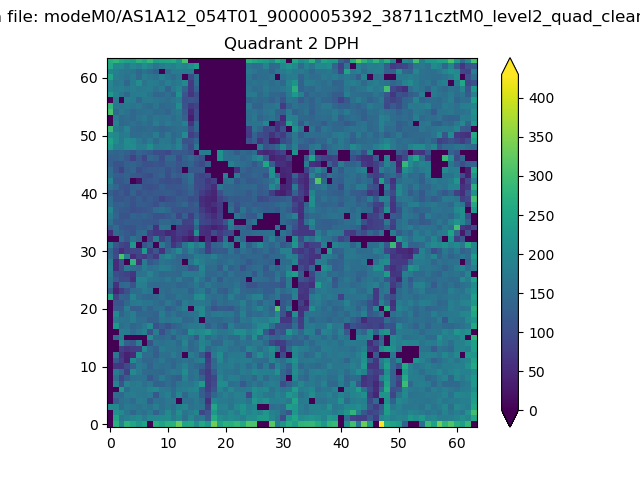
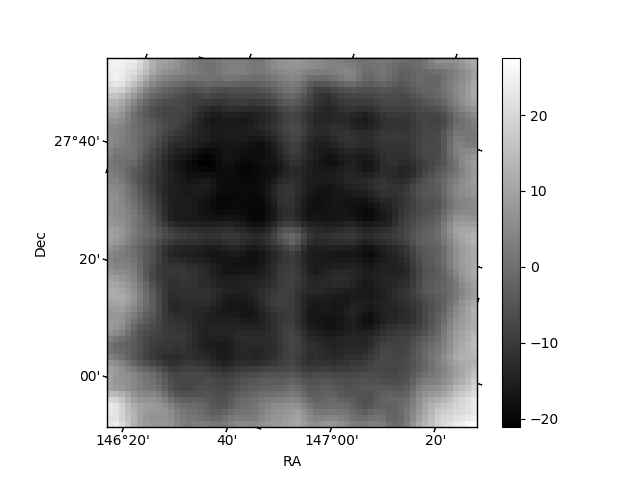
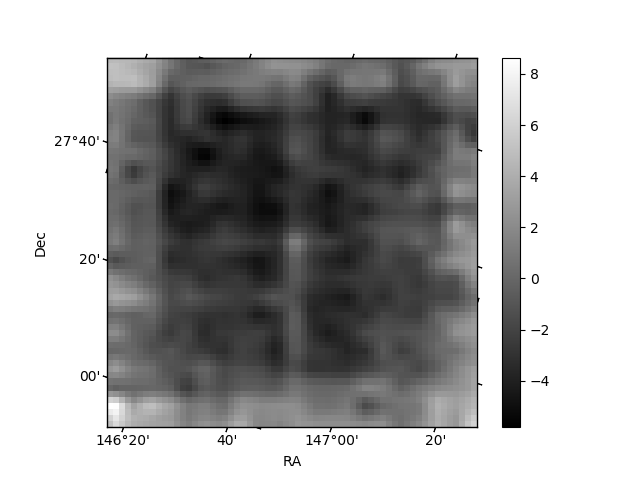
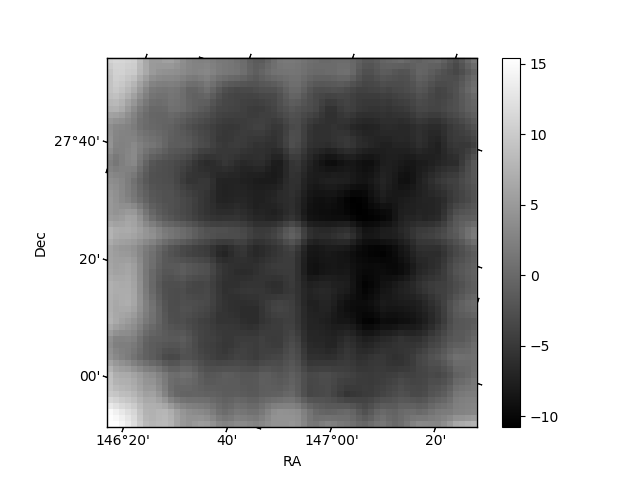
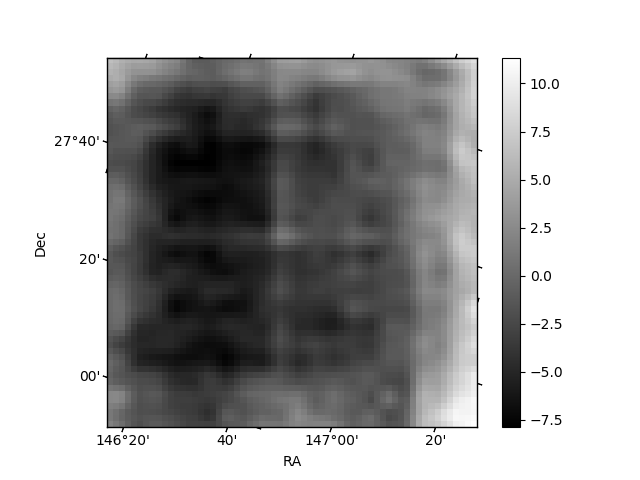
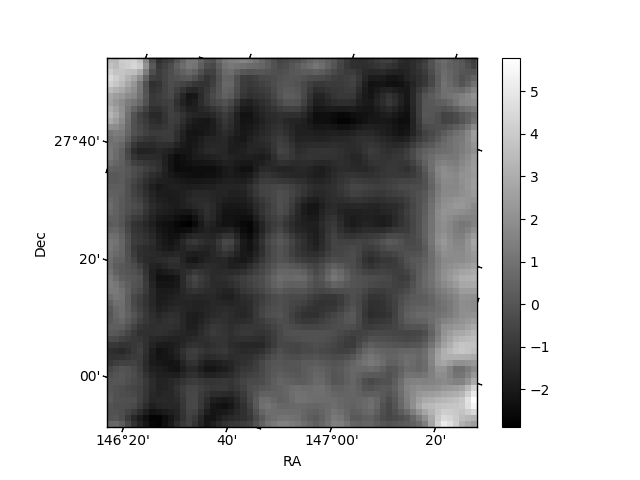
Histogram calculated using DETX and DETY for each event in the final _common_clean file
| Quadrant A | 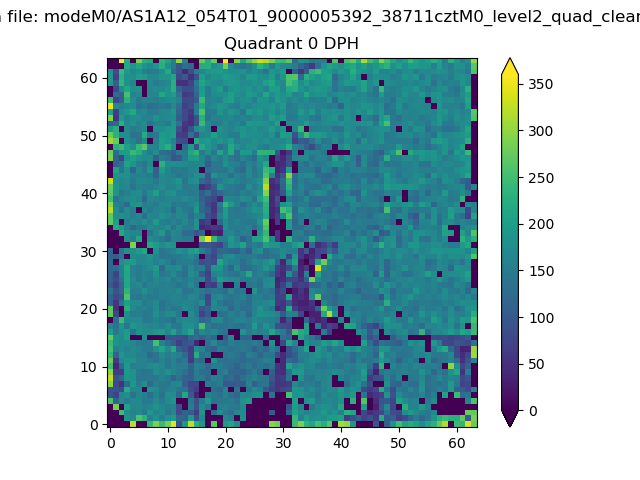 |
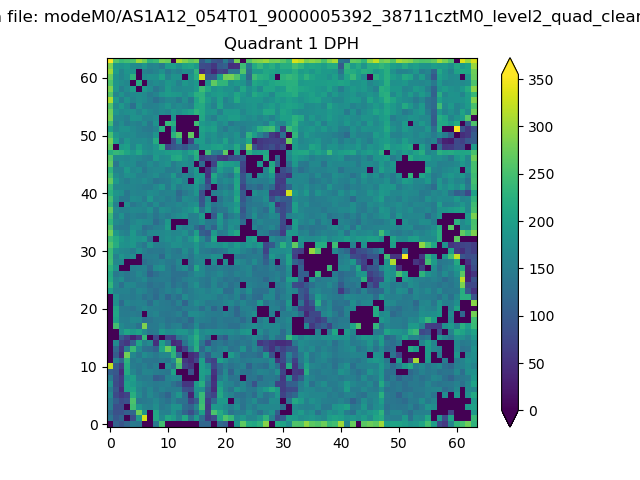 |
Quadrant B |
|---|---|---|---|
| Quadrant D | 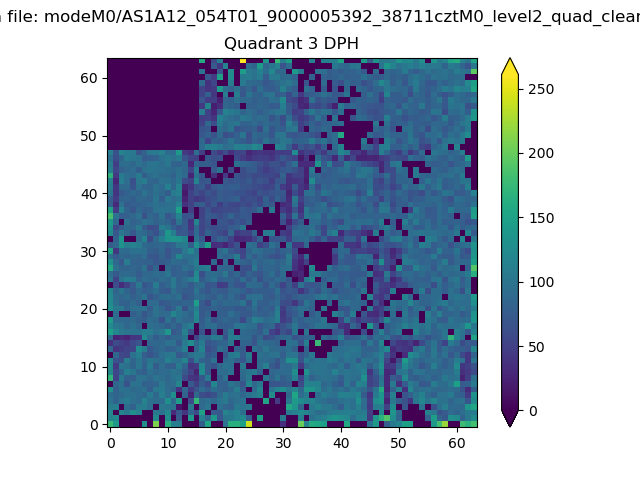 |
 |
Quadrant C |
| Plot type | Count rate plots | Images |
|---|---|---|
| Comparison with Poisson distribution Blue bars denote a histogram of data divided into 1 sec bins. Red curve is a Poisson curve with rate = median count rate of data. |
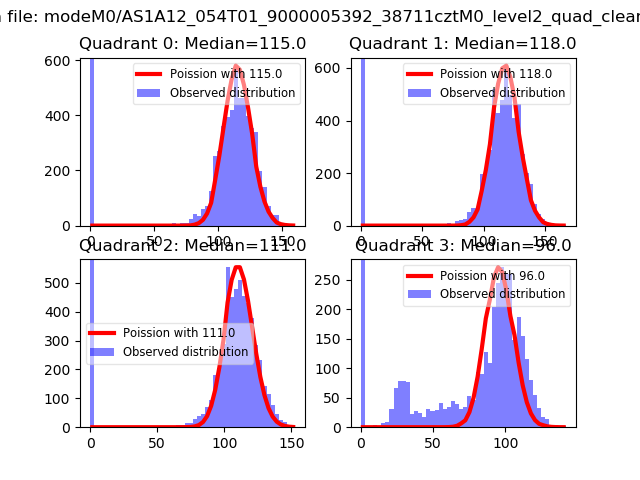 |
 |
| Quadrant-wise count rates Data is divided into 100 sec bins |
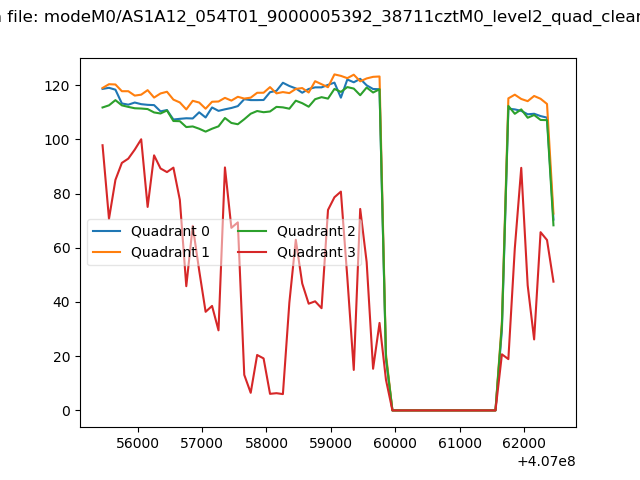 |
|
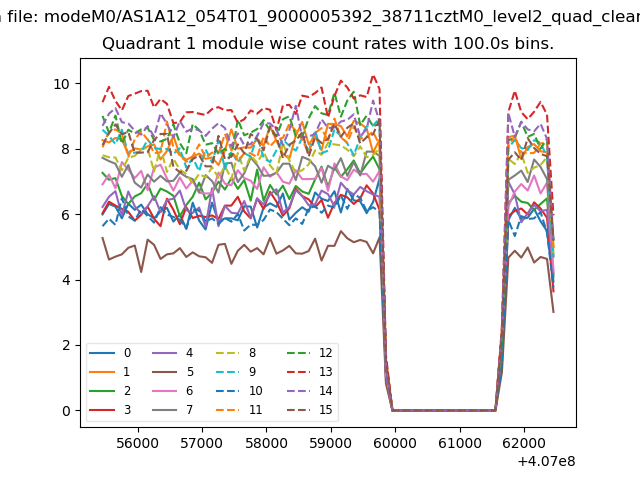
| Module-wise count rates for Quadrant A Data is divided into 100 sec bins |
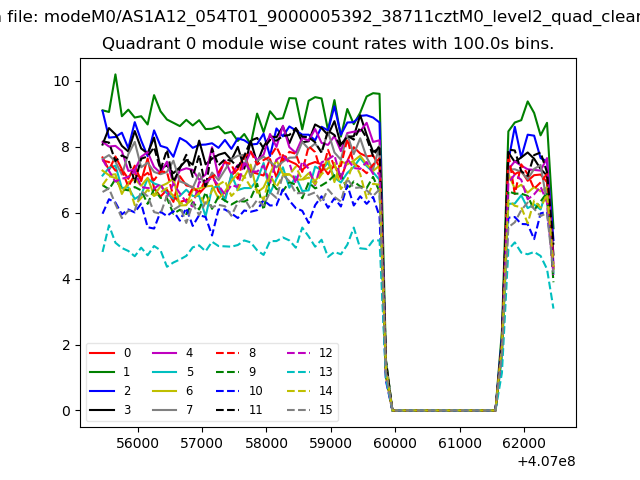 |
 |
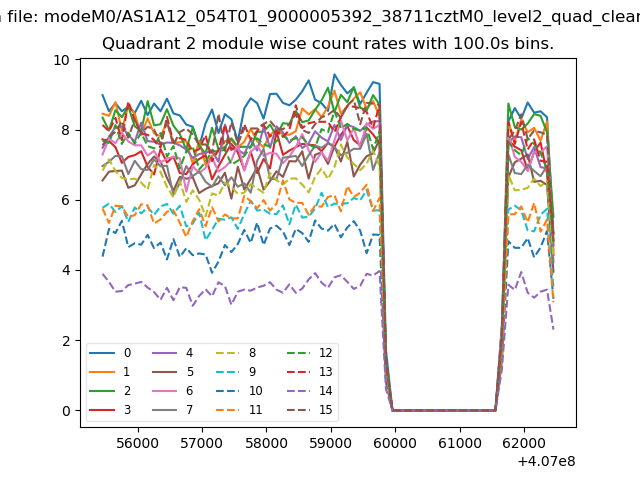
| Module-wise count rates for Quadrant B Data is divided into 100 sec bins |
 |
 |
| Module-wise count rates for Quadrant C Data is divided into 100 sec bins |
 |
 |
| Module-wise count rates for Quadrant D Data is divided into 100 sec bins |
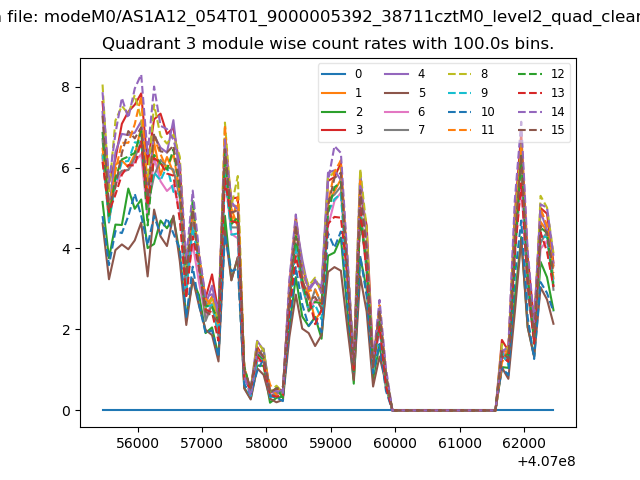 |
 |
| Parameter | Plot |
|---|---|
| CZT HV Monitor | 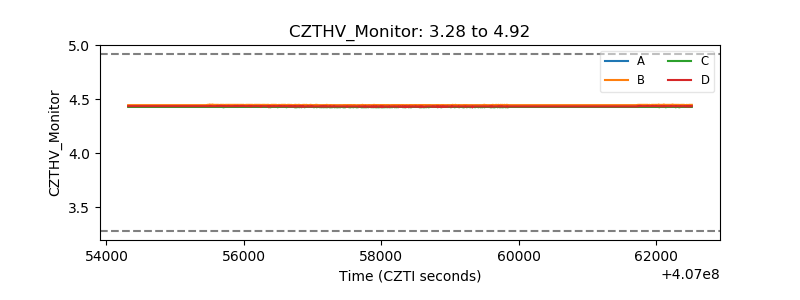 |
| D_VDD | 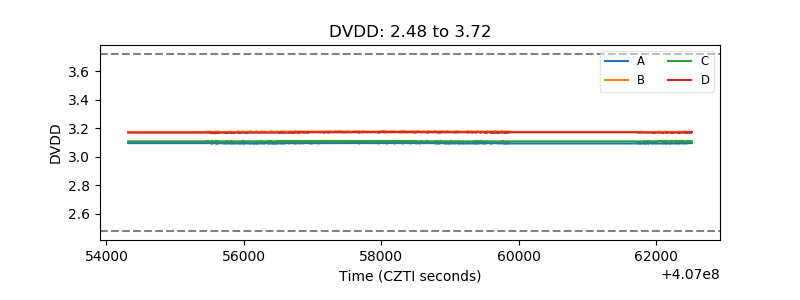 |
| Temperature 1 | 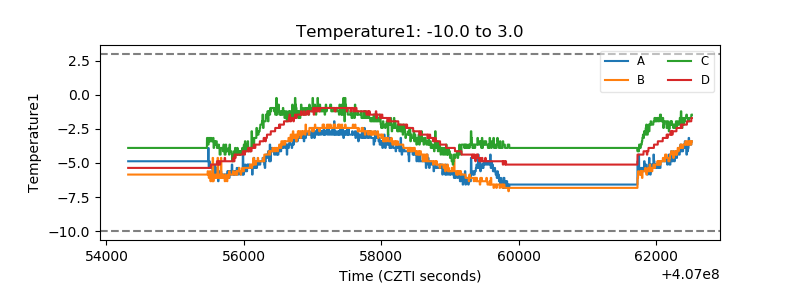 |
| Veto HV Monitor | 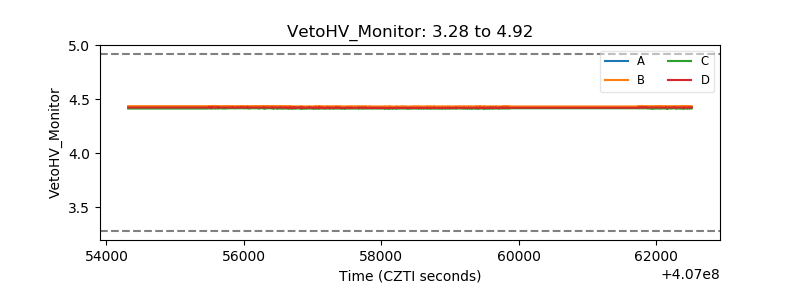 |
| Veto LLD | 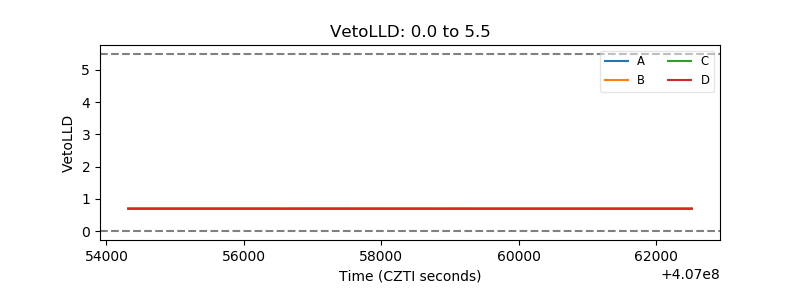 |
| Alpha Counter | 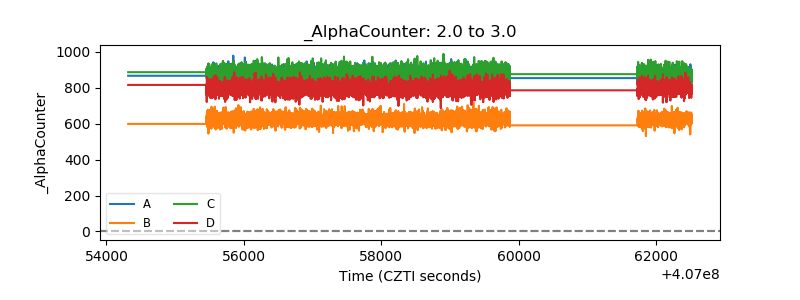 |
| _CPM_Rate |  |
| CZT Counter | 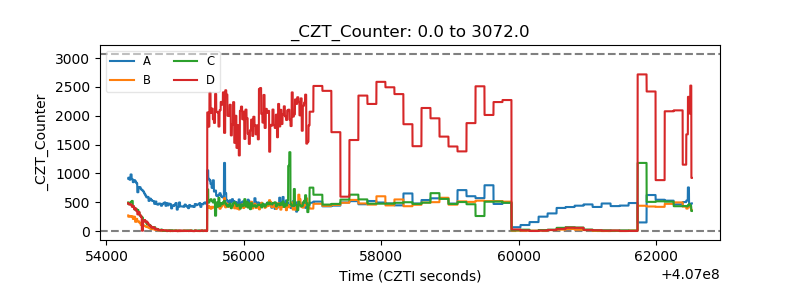 |
| +2.5 Volts monitor |  |
| +5 Volts monitor | 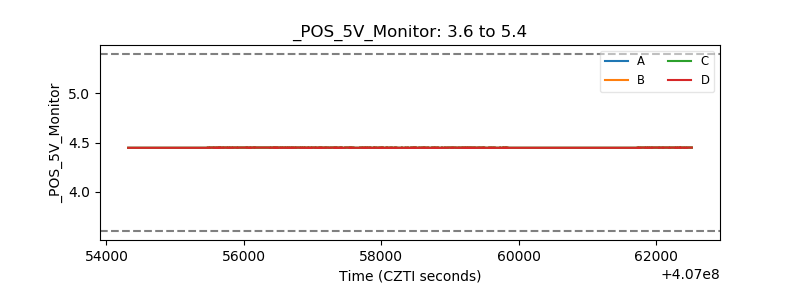 |
| _ROLL_ROT | 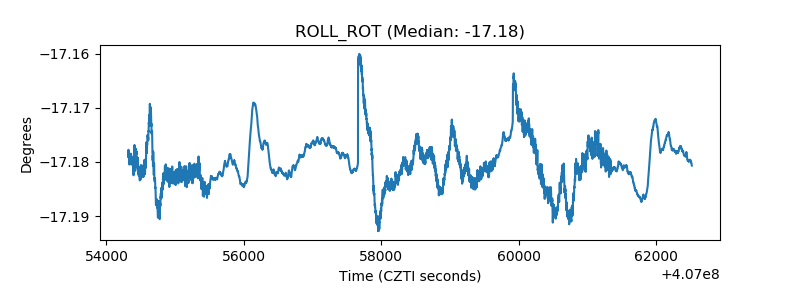 |
| _Roll_DEC | 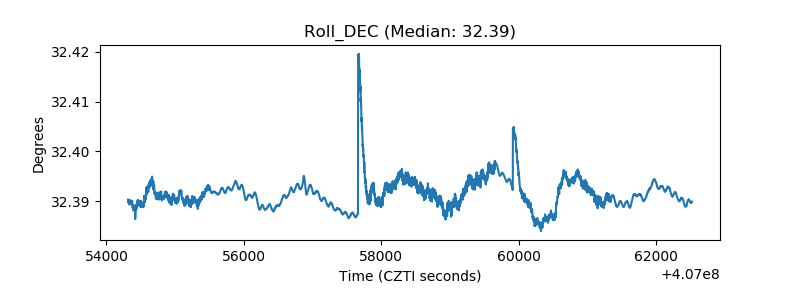 |
| _Roll_RA | 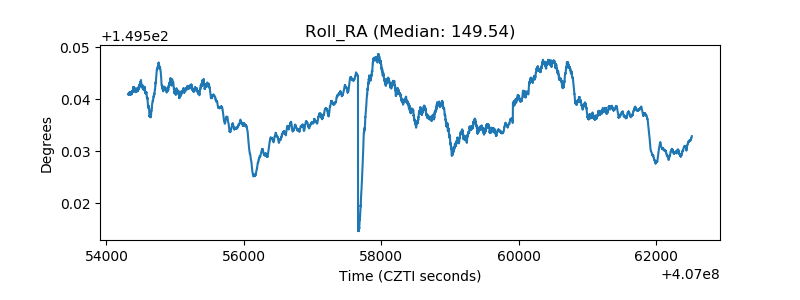 |
| Veto Counter | 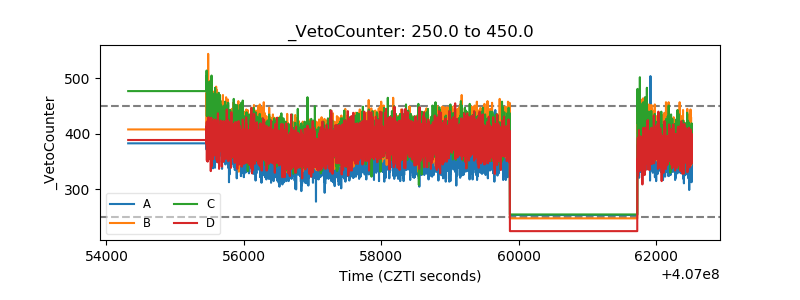 |