| Param | Original file | Final file |
|---|---|---|
| Filename | modeM0/AS1A12_054T01_9000005392_38712cztM0_level2.fits | modeM0/AS1A12_054T01_9000005392_38712cztM0_level2_quad_clean.evt |
| Size (bytes) | 544,199,040 | 82,653,120 |
| Size | 519.0 MB | 78.8 MB |
| Events in quadrant A | 3,185,804 | 618,234 |
| Events in quadrant B | 2,680,161 | 633,540 |
| Events in quadrant C | 2,654,955 | 597,530 |
| Events in quadrant D | 11,194,394 | 267,241 |
| Mode M9 | |||
|---|---|---|---|
| Quadrant | BADHDUFLAG | Total packets | Discarded packets |
| A | 0 | 17 | 0 |
| B | 0 | 17 | 0 |
| C | 0 | 17 | 0 |
| D | 0 | 18 | 0 |
| Mode SS | |||
|---|---|---|---|
| Quadrant | BADHDUFLAG | Total packets | Discarded packets |
| A | 0 | 112 | 0 |
| B | 0 | 112 | 0 |
| C | 0 | 112 | 0 |
| D | 0 | 112 | 0 |
| Mode M0 | |||
|---|---|---|---|
| Quadrant | BADHDUFLAG | Total packets | Discarded packets |
| A | 0 | 12725 | 3 |
| B | 0 | 11616 | 2 |
| C | 0 | 11194 | 2 |
| D | 0 | 37067 | 2 |
| Quadrant | Total seconds | Saturated seconds | Saturation percentage |
|---|---|---|---|
| A | 5514 | 62 | 1.124411% |
| B | 5514 | 42 | 0.761697% |
| C | 5514 | 4 | 0.072543% |
| D | 5514 | 3433 | 62.259703% |
Noise dominated data is calculated using 1-second bins in cleaned event files. If a bin has >2000 counts, and if more than 50% of those come from <1% of pixels, then it is considered to be noise-dominated and hence unusable.
| Quadrant | # 1 sec bins | Bins with >0 counts | Bins with >2000 counts | High rate bins dominated by noise | Noise dominated (total time) | Noise dominated (detector-on time) | Marked lightcurve |
|---|---|---|---|---|---|---|---|
| A | 7037 | 5515 | 39 | 39 | 0.55% | 0.71% | 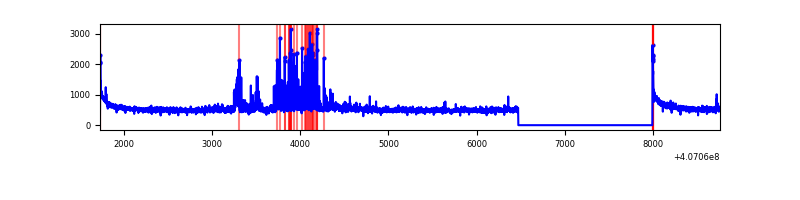 |
| B | 7037 | 5515 | 20 | 20 | 0.28% | 0.36% | 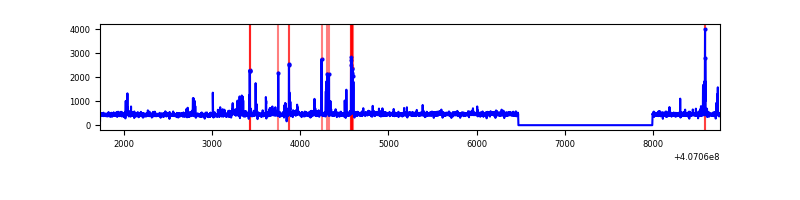 |
| C | 7037 | 5515 | 2 | 2 | 0.03% | 0.04% | 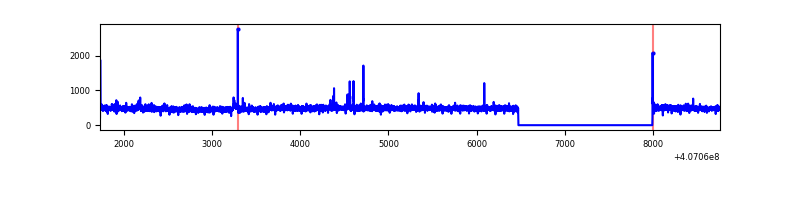 |
| D | 7037 | 5513 | 2959 | 2959 | 42.05% | 53.67% | 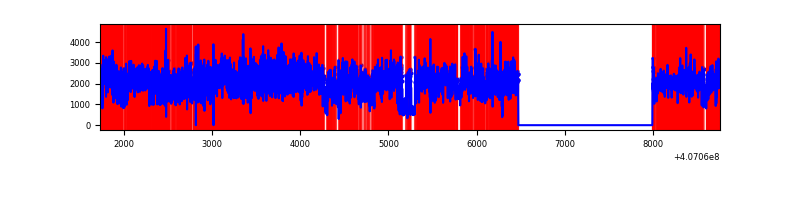 |
Top three noisy pixels from each quadrant. If the there are fewer than three noisy pixels in the level2.evt file, extra rows are filled as -1
| Pixel properties | Quadrant properties | ||||||
|---|---|---|---|---|---|---|---|
| Quadrant | DetID | PixID | Counts | Sigma | Mean | Median | Sigma |
| A | 10 | 83 | 415397 | 3244.75 | 623 | 610 | 127.8 |
| A | 0 | 8 | 346587 | 2706.47 | 623 | 610 | 127.8 |
| A | 13 | 248 | 14619 | 109.59 | 623 | 610 | 127.8 |
| B | 4 | 171 | 122507 | 1000.45 | 619 | 601 | 121.9 |
| B | 5 | 200 | 53232 | 431.93 | 619 | 601 | 121.9 |
| B | 0 | 230 | 17290 | 136.96 | 619 | 601 | 121.9 |
| C | 15 | 214 | 230542 | 1605.78 | 606 | 610 | 143.2 |
| C | 14 | 254 | 32745 | 224.42 | 606 | 610 | 143.2 |
| C | 1 | 23 | 11648 | 77.09 | 606 | 610 | 143.2 |
| D | 2 | 16 | 7734000 | 61364.65 | 506 | 492 | 126.0 |
| D | 12 | 235 | 954669 | 7571.3 | 506 | 492 | 126.0 |
| D | 12 | 233 | 160277 | 1267.88 | 506 | 492 | 126.0 |
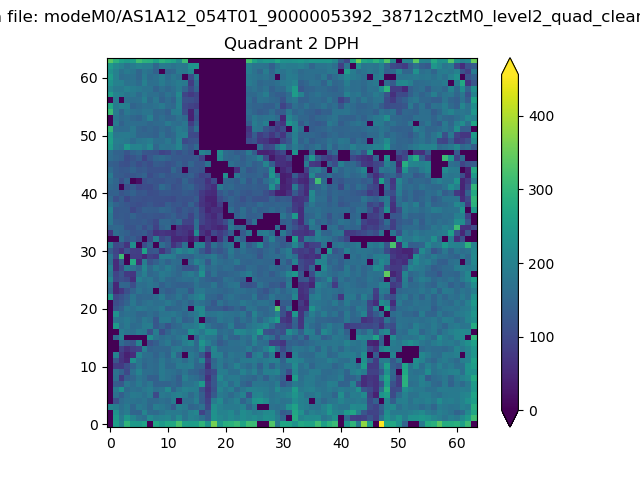
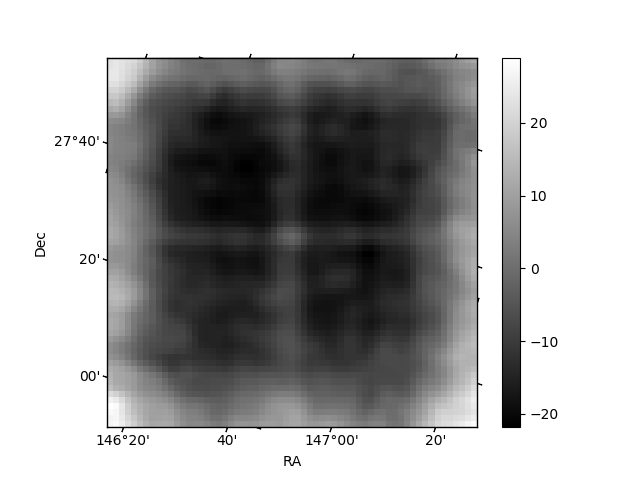
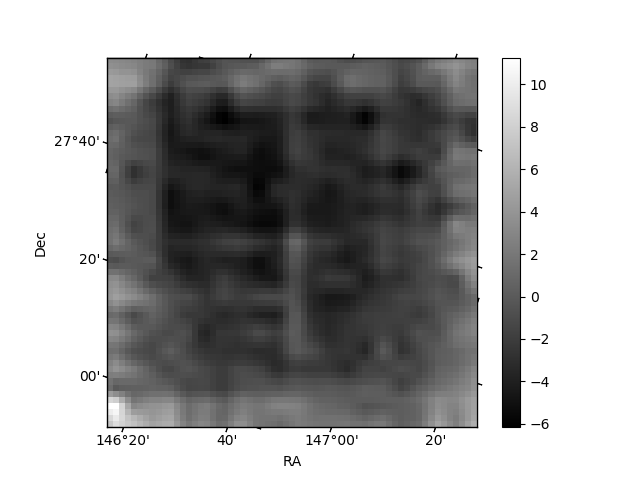
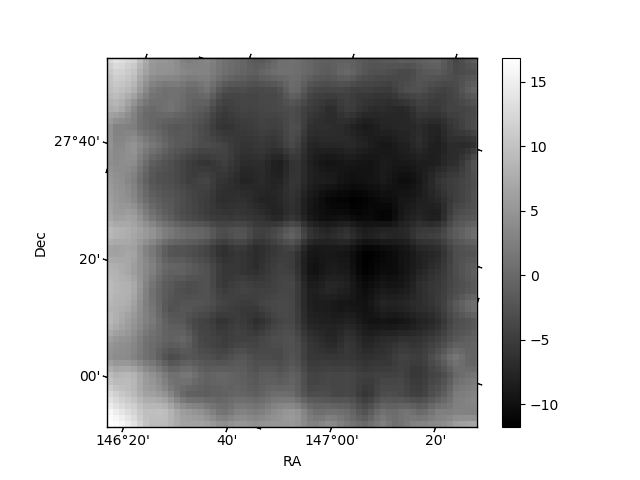
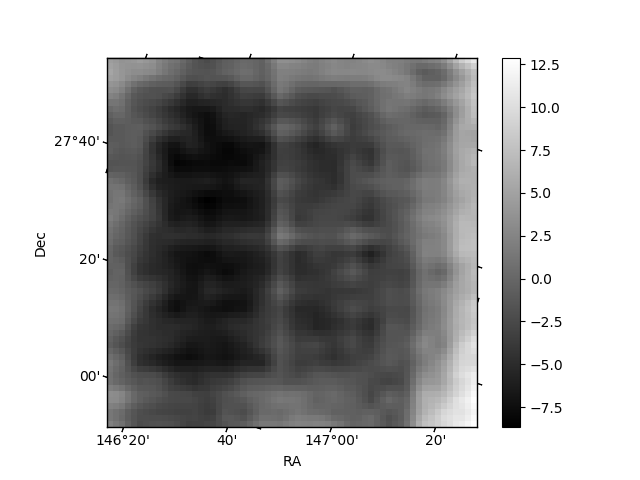
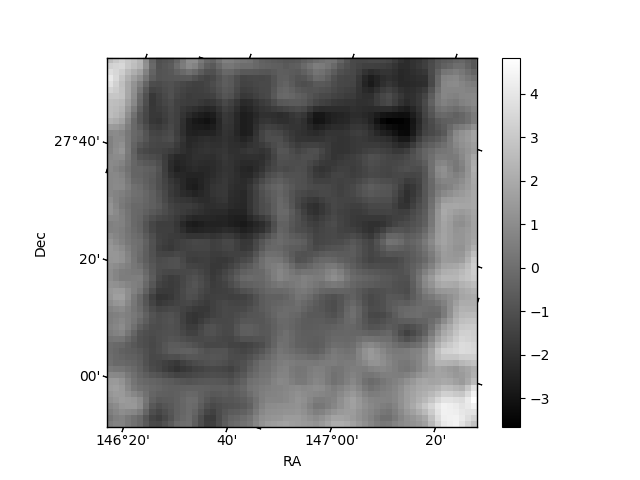
Histogram calculated using DETX and DETY for each event in the final _common_clean file
| Quadrant A | 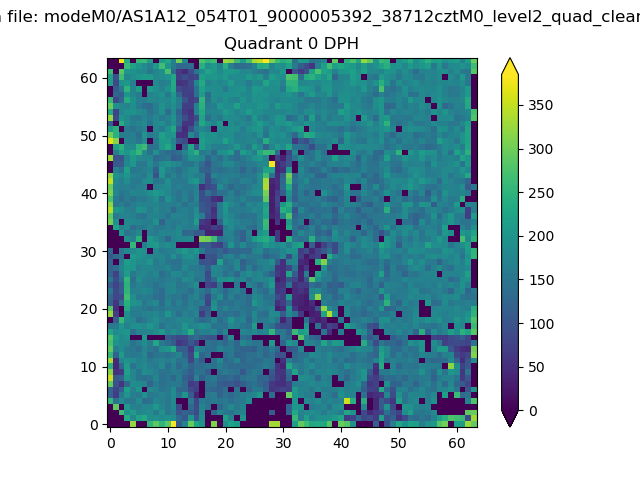 |
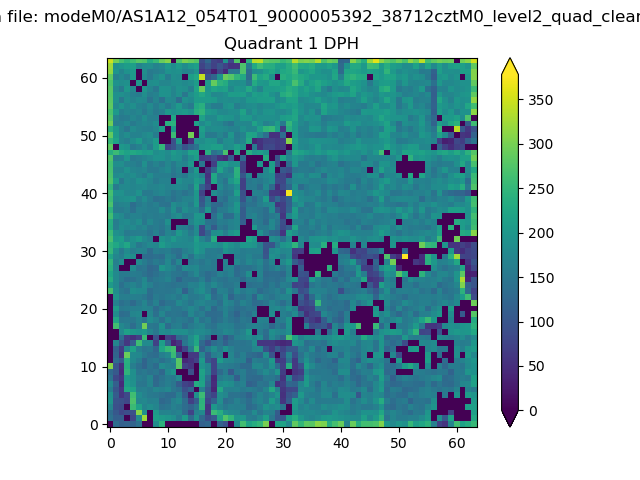 |
Quadrant B |
|---|---|---|---|
| Quadrant D | 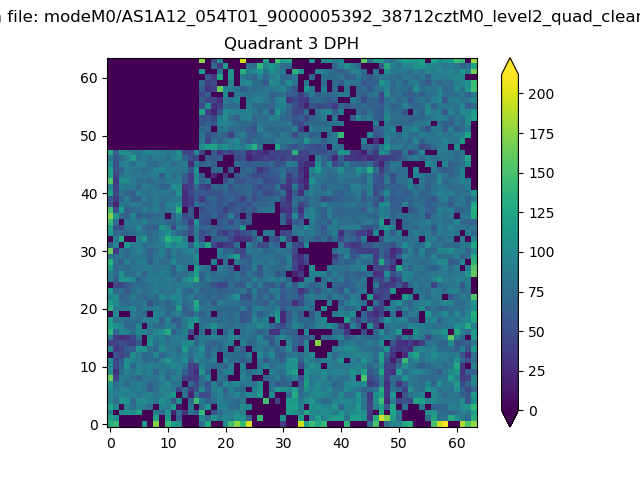 |
 |
Quadrant C |
| Plot type | Count rate plots | Images |
|---|---|---|
| Comparison with Poisson distribution Blue bars denote a histogram of data divided into 1 sec bins. Red curve is a Poisson curve with rate = median count rate of data. |
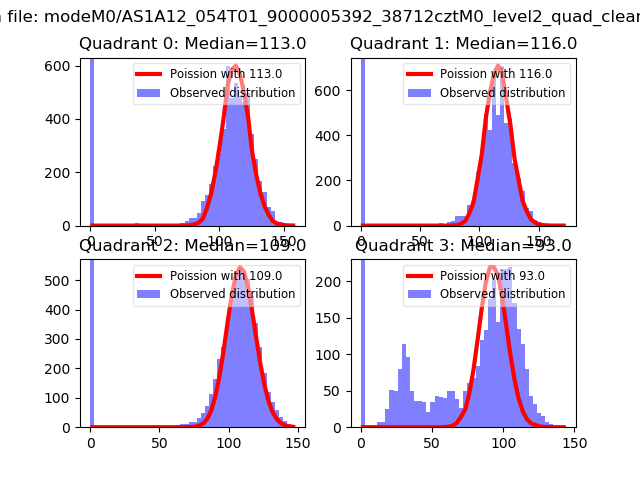 |
 |
| Quadrant-wise count rates Data is divided into 100 sec bins |
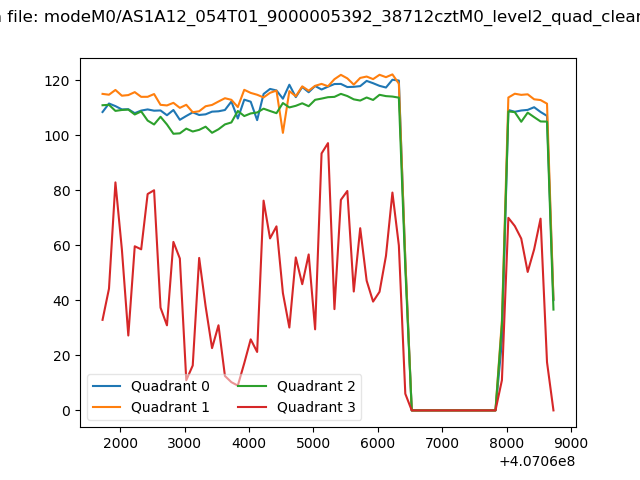 |
|
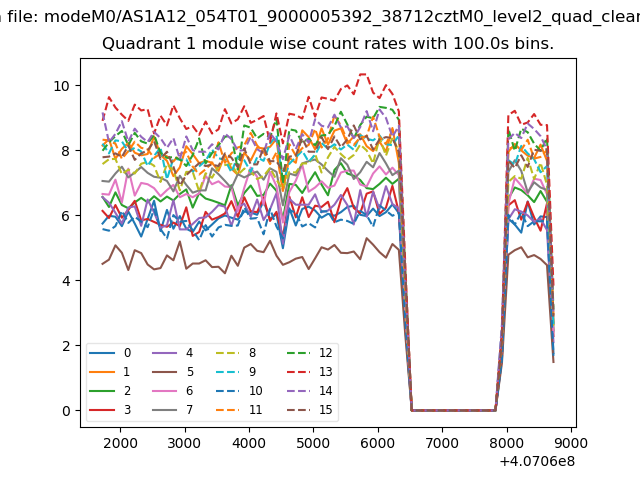
| Module-wise count rates for Quadrant A Data is divided into 100 sec bins |
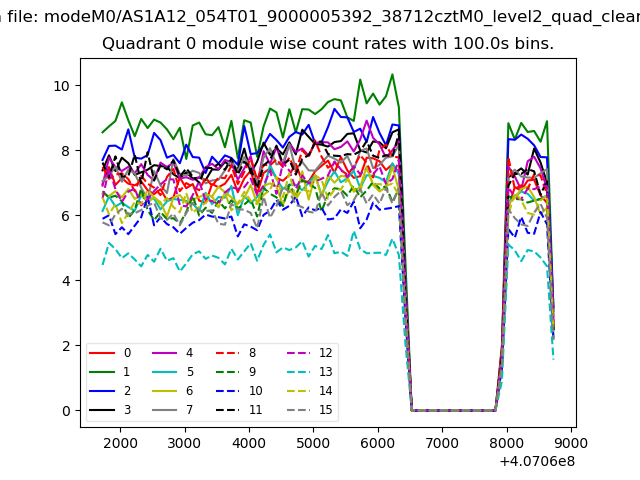 |
 |
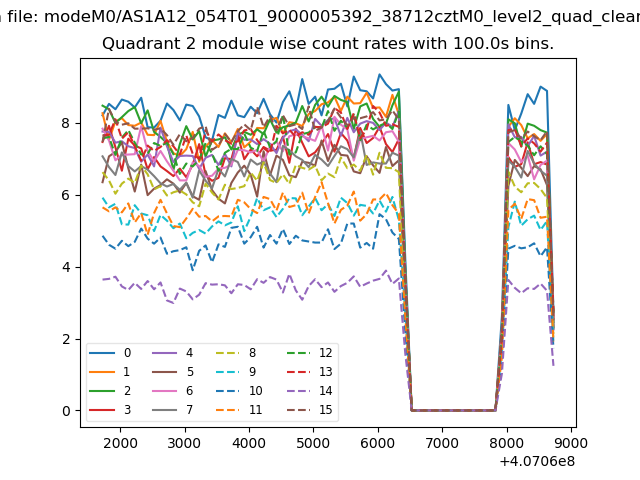
| Module-wise count rates for Quadrant B Data is divided into 100 sec bins |
 |
 |
| Module-wise count rates for Quadrant C Data is divided into 100 sec bins |
 |
 |
| Module-wise count rates for Quadrant D Data is divided into 100 sec bins |
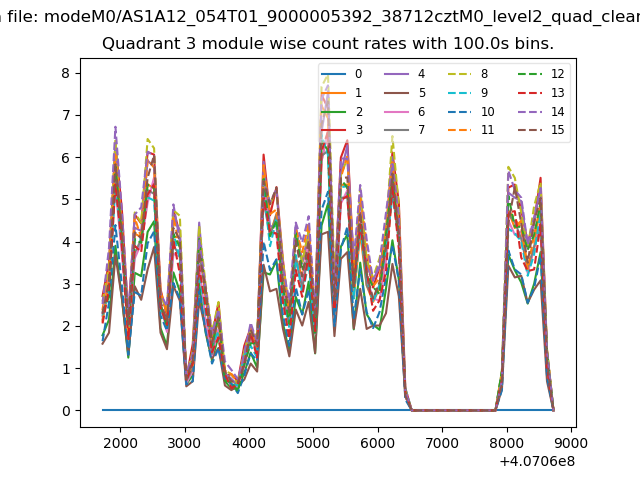 |
 |
| Parameter | Plot |
|---|---|
| CZT HV Monitor | 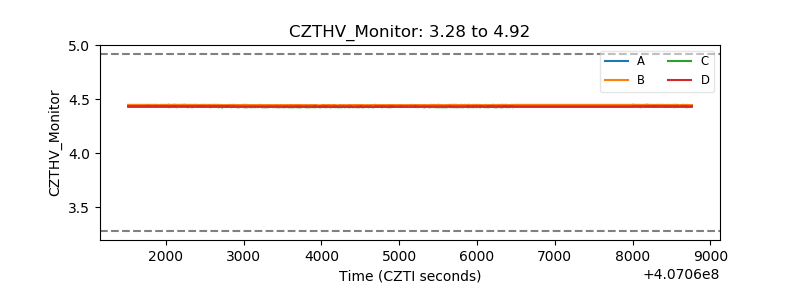 |
| D_VDD | 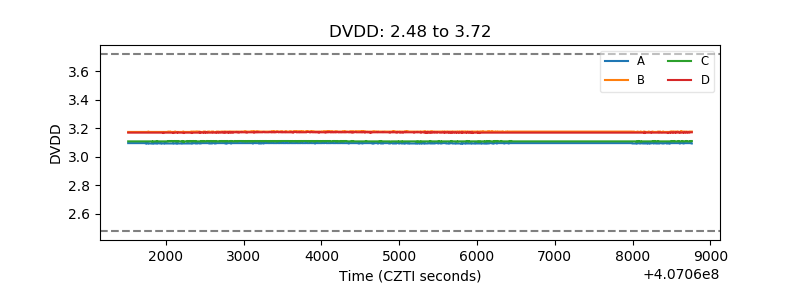 |
| Temperature 1 | 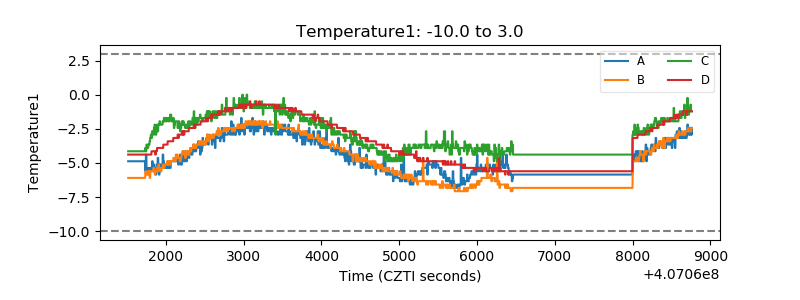 |
| Veto HV Monitor | 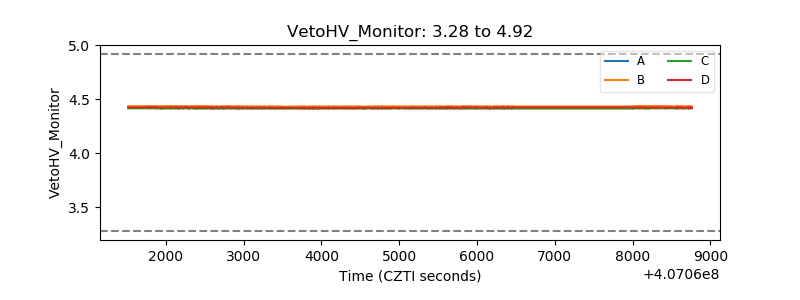 |
| Veto LLD | 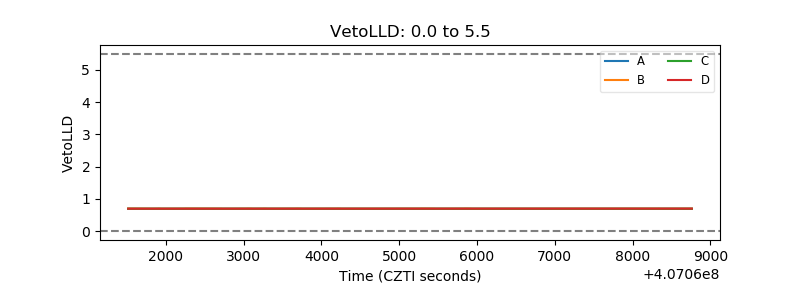 |
| Alpha Counter | 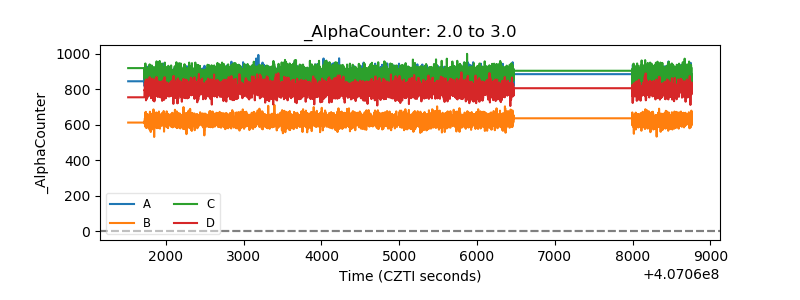 |
| _CPM_Rate |  |
| CZT Counter | 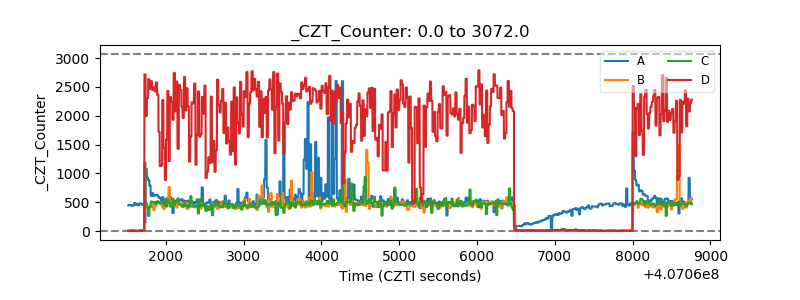 |
| +2.5 Volts monitor | 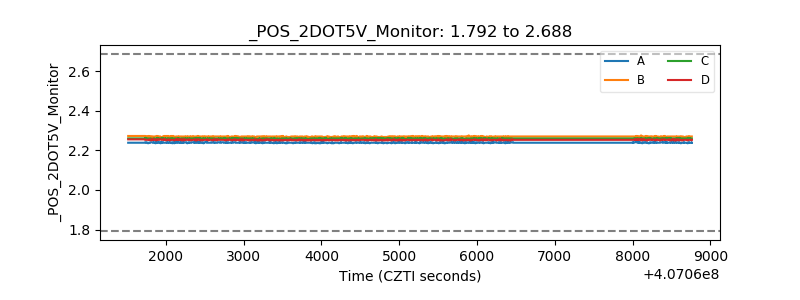 |
| +5 Volts monitor | 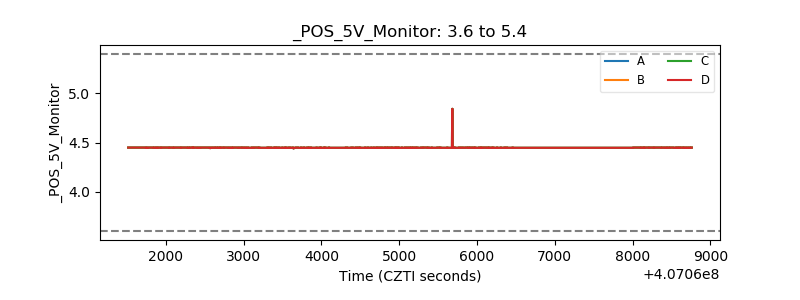 |
| _ROLL_ROT | 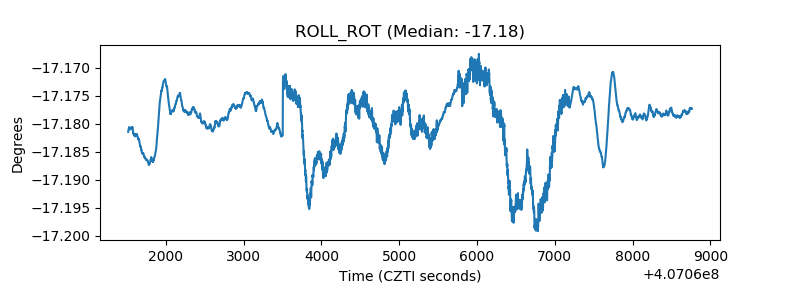 |
| _Roll_DEC | 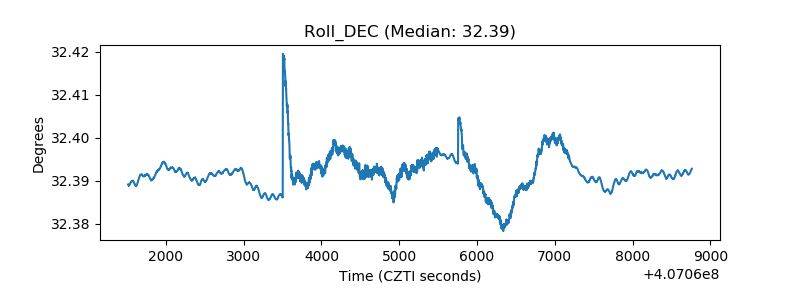 |
| _Roll_RA | 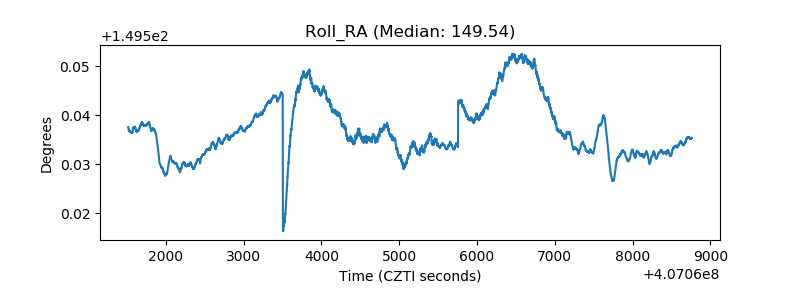 |
| Veto Counter | 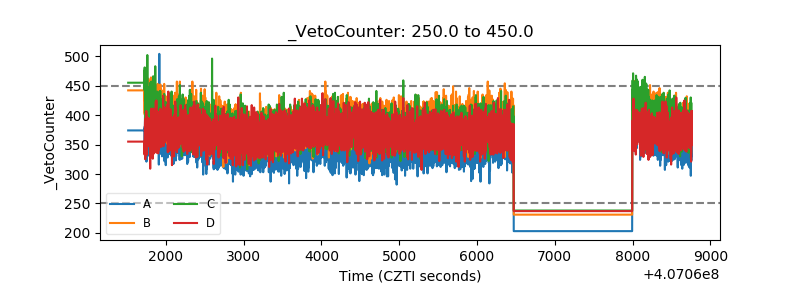 |