| Param | Original file | Final file |
|---|---|---|
| Filename | modeM0/AS1A12_054T01_9000005392_38713cztM0_level2.fits | modeM0/AS1A12_054T01_9000005392_38713cztM0_level2_quad_clean.evt |
| Size (bytes) | 1,023,442,560 | 148,417,920 |
| Size | 976.0 MB | 141.5 MB |
| Events in quadrant A | 5,820,825 | 1,145,453 |
| Events in quadrant B | 4,941,299 | 1,167,881 |
| Events in quadrant C | 4,878,392 | 1,103,492 |
| Events in quadrant D | 21,451,340 | 368,572 |
| Mode M9 | |||
|---|---|---|---|
| Quadrant | BADHDUFLAG | Total packets | Discarded packets |
| A | 0 | 28 | 0 |
| B | 0 | 28 | 0 |
| C | 0 | 28 | 0 |
| D | 0 | 28 | 0 |
| Mode SS | |||
|---|---|---|---|
| Quadrant | BADHDUFLAG | Total packets | Discarded packets |
| A | 0 | 210 | 0 |
| B | 0 | 210 | 0 |
| C | 0 | 210 | 0 |
| D | 0 | 210 | 0 |
| Mode M0 | |||
|---|---|---|---|
| Quadrant | BADHDUFLAG | Total packets | Discarded packets |
| A | 0 | 23357 | 3 |
| B | 0 | 21410 | 2 |
| C | 0 | 20617 | 2 |
| D | 0 | 70725 | 2 |
| Quadrant | Total seconds | Saturated seconds | Saturation percentage |
|---|---|---|---|
| A | 10216 | 97 | 0.949491% |
| B | 10216 | 65 | 0.636257% |
| C | 10216 | 6 | 0.058731% |
| D | 10216 | 7394 | 72.376664% |
Noise dominated data is calculated using 1-second bins in cleaned event files. If a bin has >2000 counts, and if more than 50% of those come from <1% of pixels, then it is considered to be noise-dominated and hence unusable.
| Quadrant | # 1 sec bins | Bins with >0 counts | Bins with >2000 counts | High rate bins dominated by noise | Noise dominated (total time) | Noise dominated (detector-on time) | Marked lightcurve |
|---|---|---|---|---|---|---|---|
| A | 13083 | 10218 | 61 | 61 | 0.47% | 0.60% | 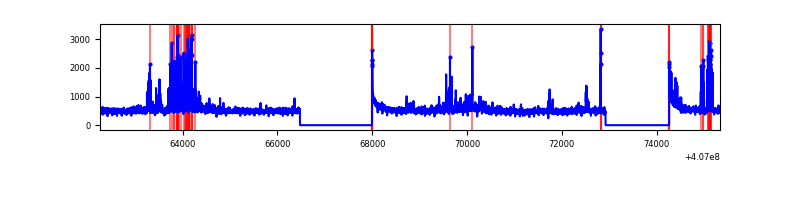 |
| B | 13083 | 10218 | 27 | 27 | 0.21% | 0.26% | 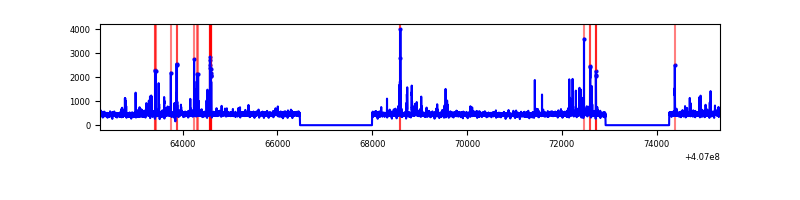 |
| C | 13083 | 10218 | 4 | 4 | 0.03% | 0.04% | 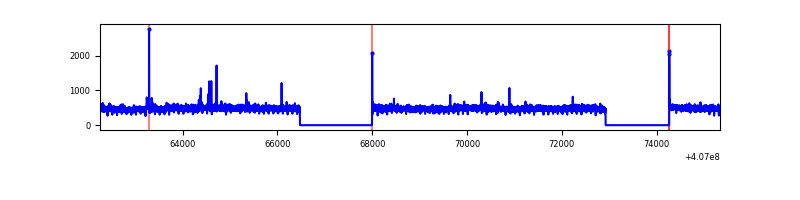 |
| D | 13083 | 10216 | 6161 | 6161 | 47.09% | 60.31% | 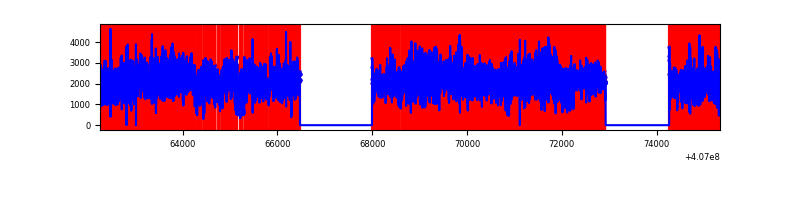 |
Top three noisy pixels from each quadrant. If the there are fewer than three noisy pixels in the level2.evt file, extra rows are filled as -1
| Pixel properties | Quadrant properties | ||||||
|---|---|---|---|---|---|---|---|
| Quadrant | DetID | PixID | Counts | Sigma | Mean | Median | Sigma |
| A | 10 | 83 | 643388 | 2727.89 | 1158 | 1134 | 235.4 |
| A | 0 | 8 | 505109 | 2140.57 | 1158 | 1134 | 235.4 |
| A | 13 | 248 | 195464 | 825.39 | 1158 | 1134 | 235.4 |
| B | 4 | 171 | 232073 | 1030.66 | 1149 | 1115 | 224.1 |
| B | 5 | 200 | 60703 | 265.91 | 1149 | 1115 | 224.1 |
| B | 0 | 230 | 36546 | 158.11 | 1149 | 1115 | 224.1 |
| C | 15 | 214 | 413938 | 1574.82 | 1125 | 1132 | 262.1 |
| C | 14 | 254 | 30685 | 112.74 | 1125 | 1132 | 262.1 |
| C | 3 | 233 | 14852 | 52.34 | 1125 | 1132 | 262.1 |
| D | 2 | 16 | 13876737 | 64959.71 | 861 | 837 | 213.6 |
| D | 12 | 235 | 2439159 | 11414.95 | 861 | 837 | 213.6 |
| D | 2 | 249 | 519357 | 2427.44 | 861 | 837 | 213.6 |
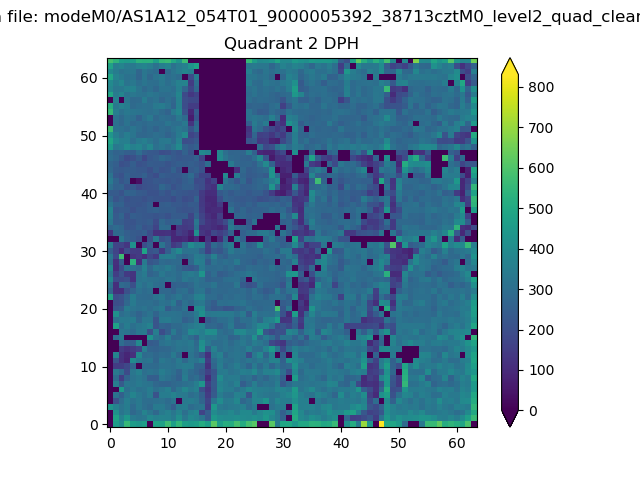
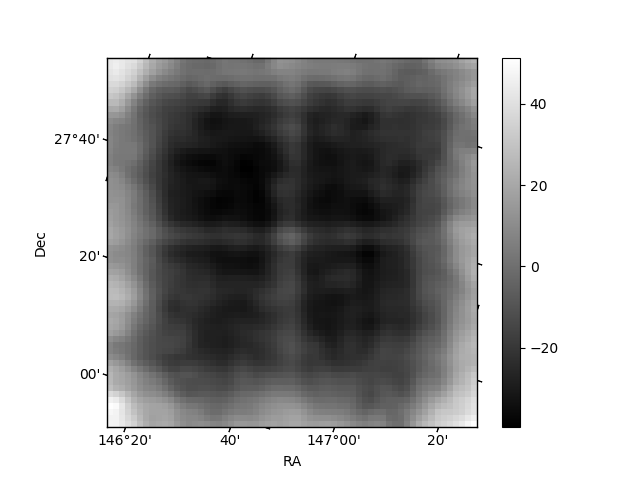
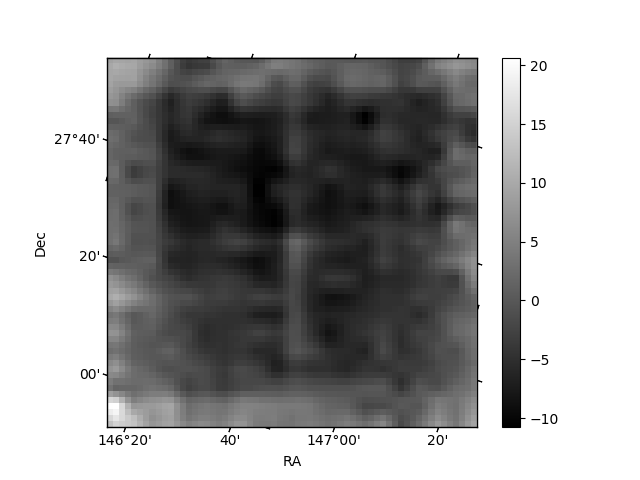
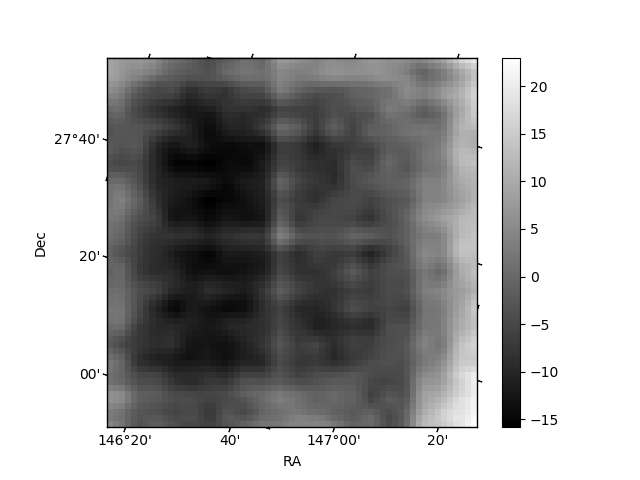
Histogram calculated using DETX and DETY for each event in the final _common_clean file
| Quadrant A | 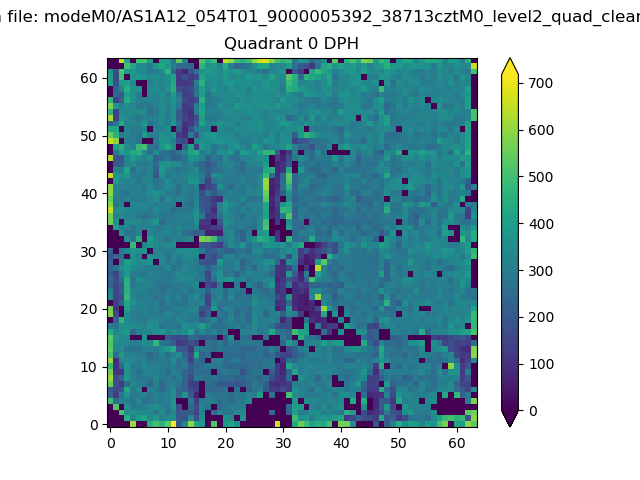 |
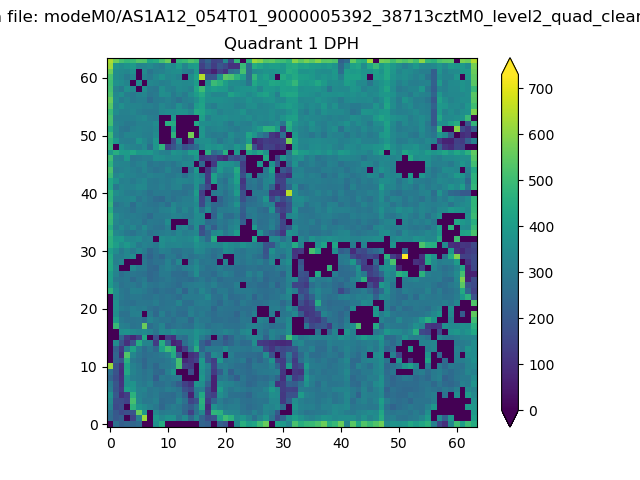 |
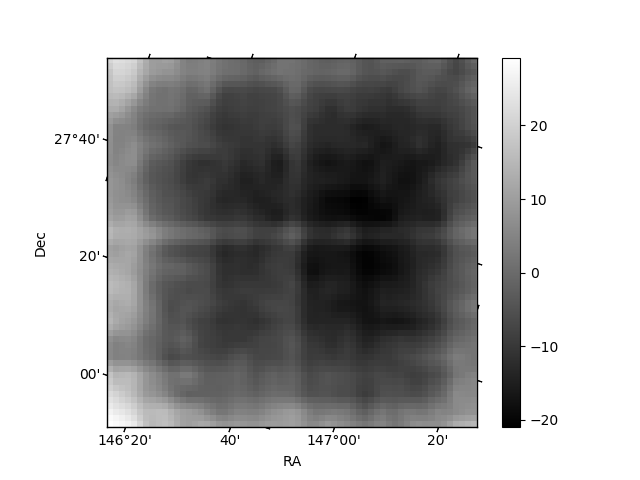
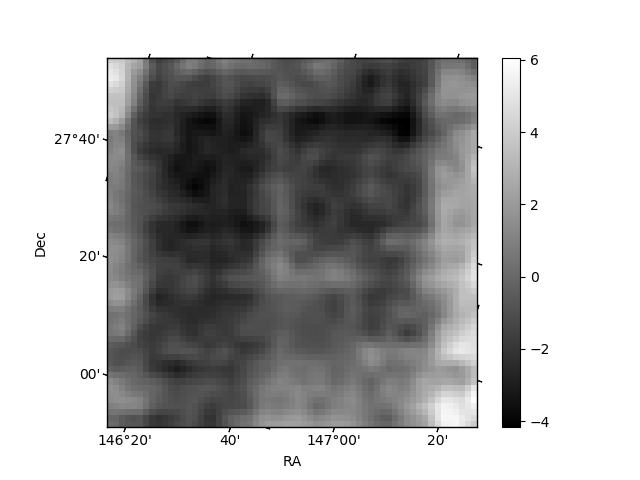
Quadrant B |
|---|---|---|---|
| Quadrant D | 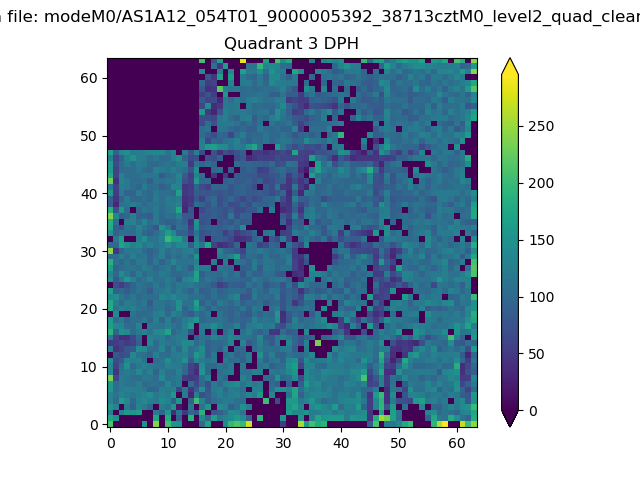 |
 |
Quadrant C |
| Plot type | Count rate plots | Images |
|---|---|---|
| Comparison with Poisson distribution Blue bars denote a histogram of data divided into 1 sec bins. Red curve is a Poisson curve with rate = median count rate of data. |
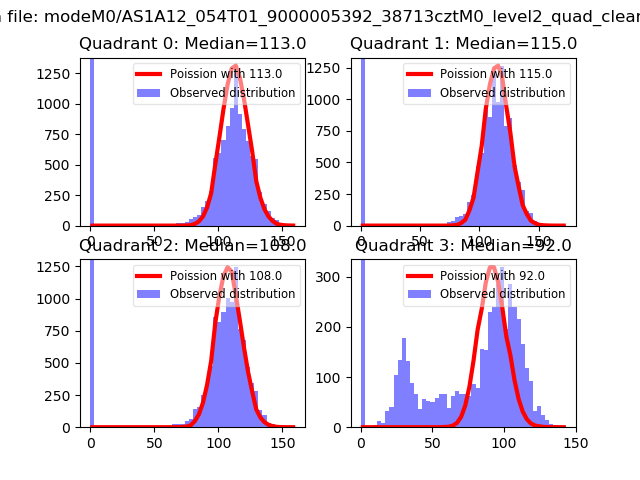 |
 |
| Quadrant-wise count rates Data is divided into 100 sec bins |
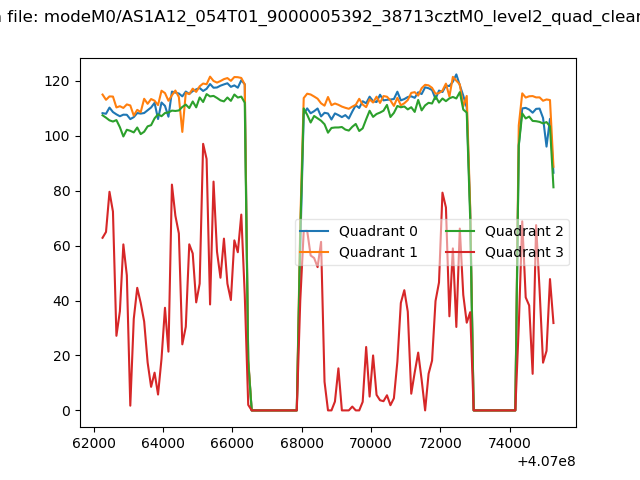 |
|
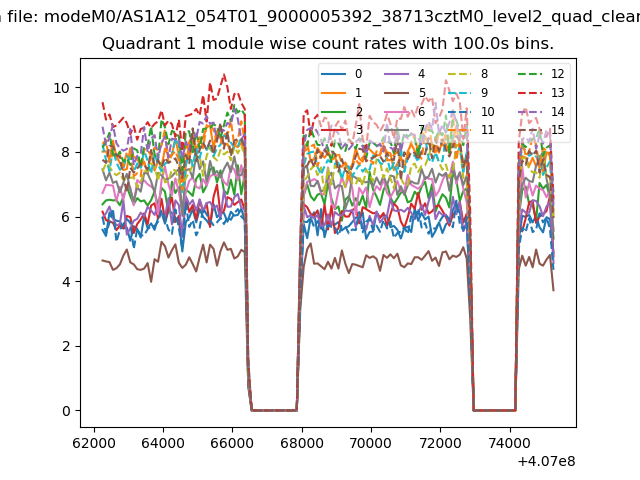
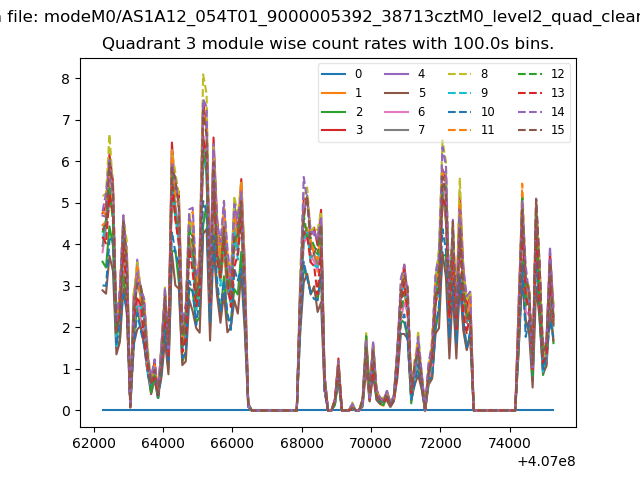
| Module-wise count rates for Quadrant A Data is divided into 100 sec bins |
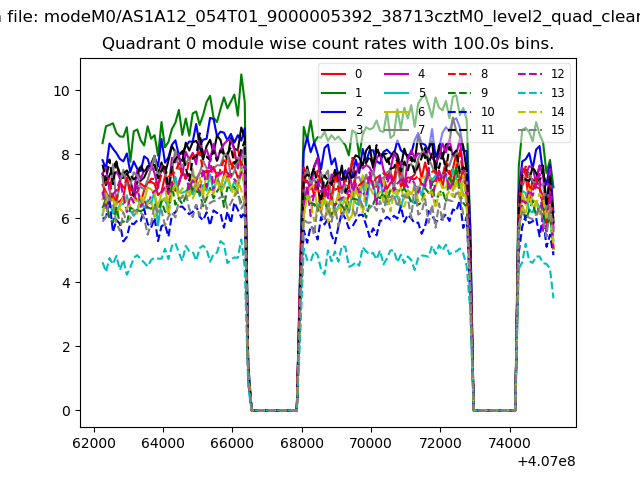 |
 |
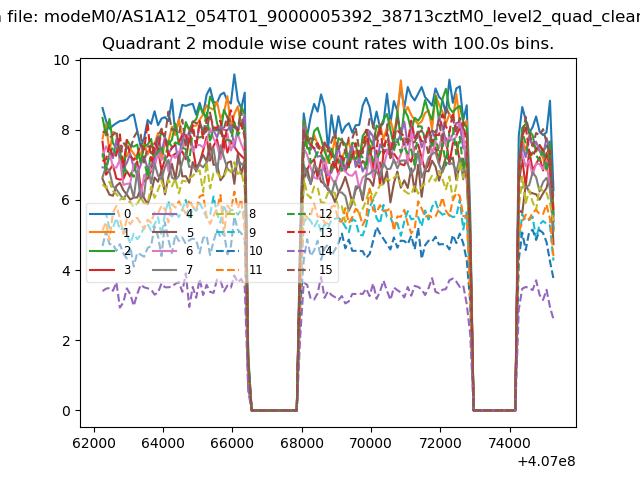
| Module-wise count rates for Quadrant B Data is divided into 100 sec bins |
 |
 |
| Module-wise count rates for Quadrant C Data is divided into 100 sec bins |
 |
 |
| Module-wise count rates for Quadrant D Data is divided into 100 sec bins |
 |
 |
| Parameter | Plot |
|---|---|
| CZT HV Monitor | 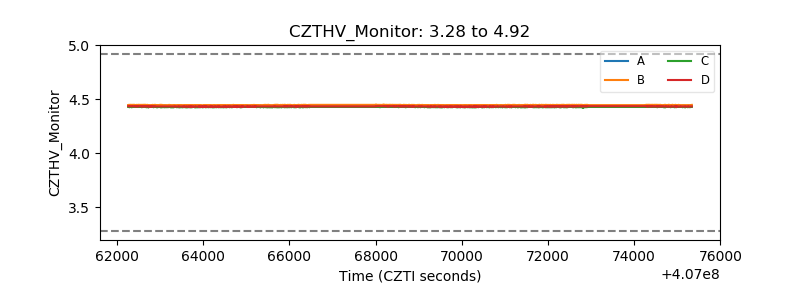 |
| D_VDD | 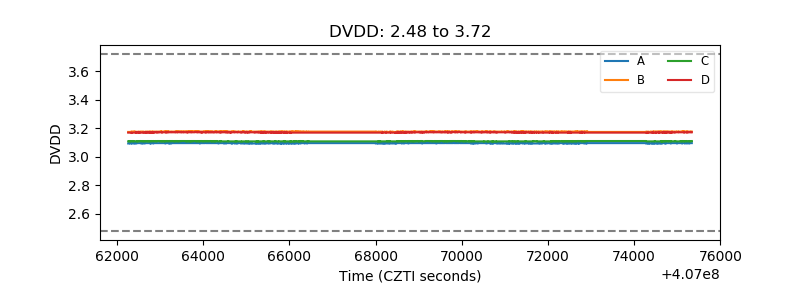 |
| Temperature 1 | 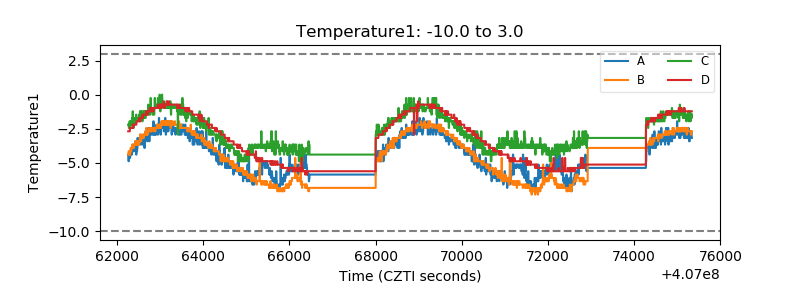 |
| Veto HV Monitor | 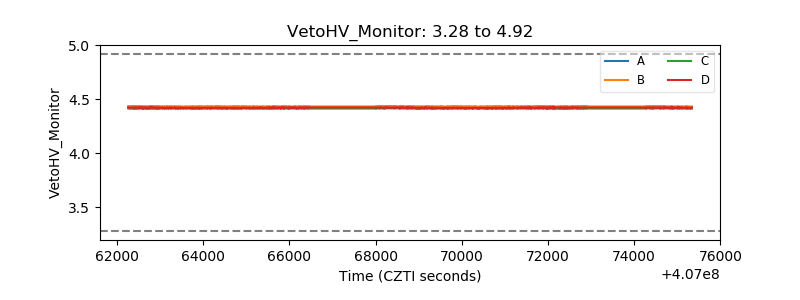 |
| Veto LLD | 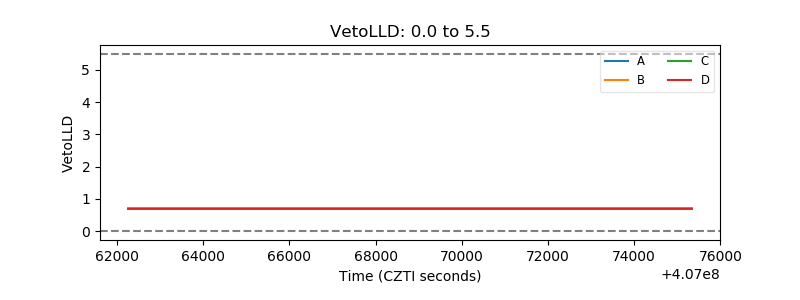 |
| Alpha Counter | 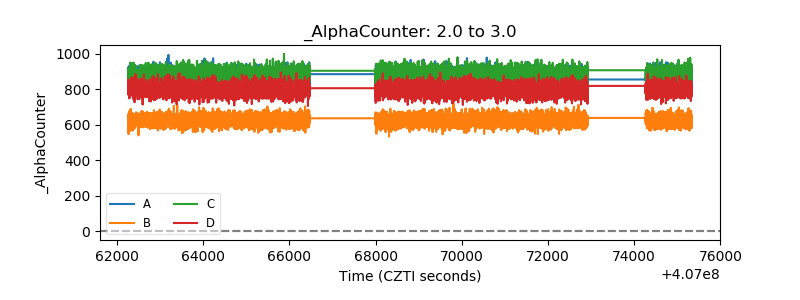 |
| _CPM_Rate | 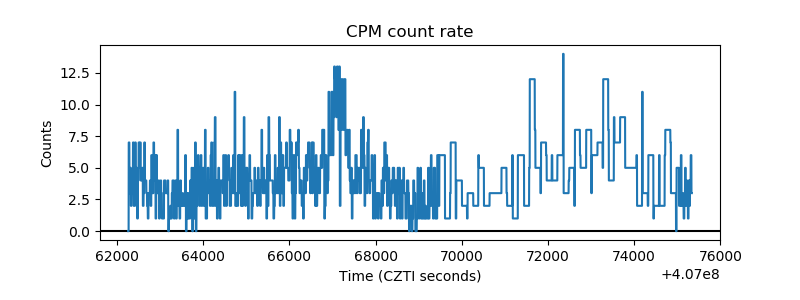 |
| CZT Counter | 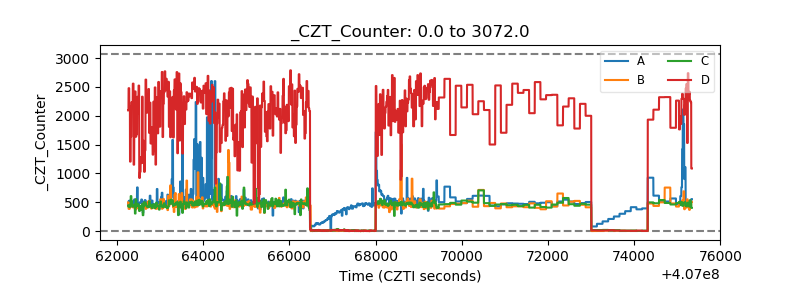 |
| +2.5 Volts monitor | 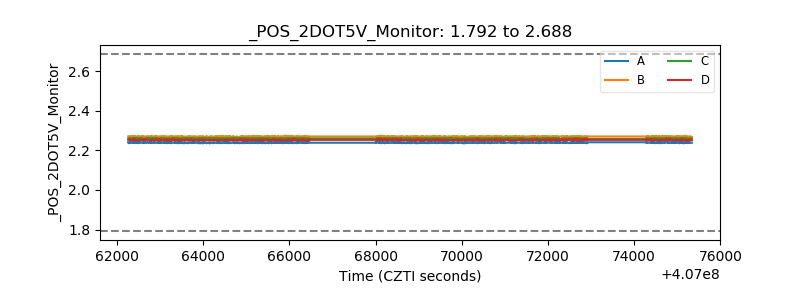 |
| +5 Volts monitor | 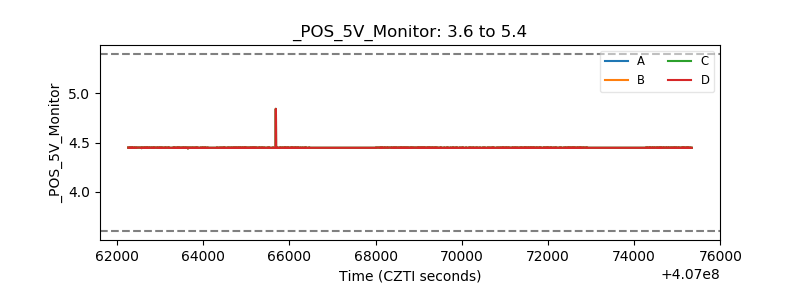 |
| _ROLL_ROT | 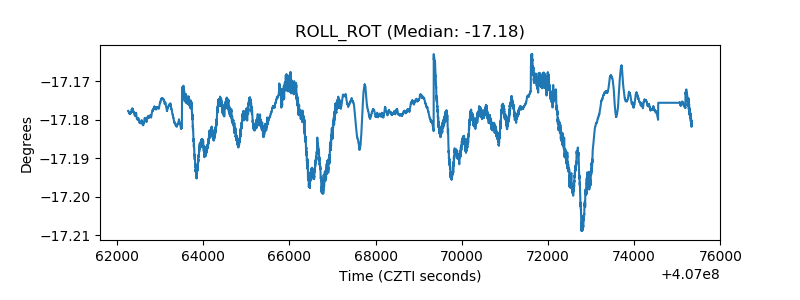 |
| _Roll_DEC |  |
| _Roll_RA | 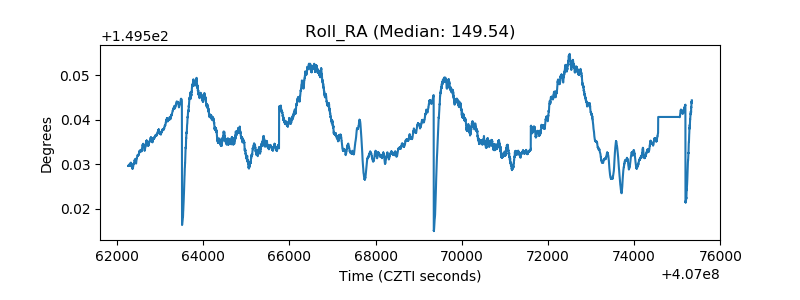 |
| Veto Counter | 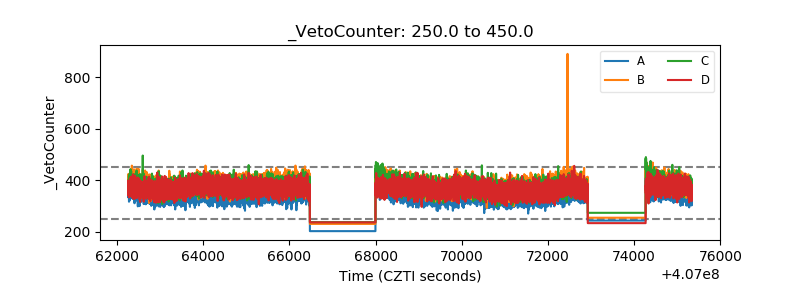 |