| Param | Original file | Final file |
|---|---|---|
| Filename | modeM0/AS1A12_054T01_9000005392_38714cztM0_level2.fits | modeM0/AS1A12_054T01_9000005392_38714cztM0_level2_quad_clean.evt |
| Size (bytes) | 496,537,920 | 72,420,480 |
| Size | 473.5 MB | 69.1 MB |
| Events in quadrant A | 2,793,269 | 552,643 |
| Events in quadrant B | 2,264,133 | 565,373 |
| Events in quadrant C | 2,341,228 | 534,594 |
| Events in quadrant D | 10,595,042 | 191,835 |
| Mode M9 | |||
|---|---|---|---|
| Quadrant | BADHDUFLAG | Total packets | Discarded packets |
| A | 0 | 15 | 0 |
| B | 0 | 14 | 0 |
| C | 0 | 14 | 0 |
| D | 0 | 15 | 0 |
| Mode SS | |||
|---|---|---|---|
| Quadrant | BADHDUFLAG | Total packets | Discarded packets |
| A | 0 | 102 | 0 |
| B | 0 | 102 | 0 |
| C | 0 | 102 | 0 |
| D | 0 | 102 | 0 |
| Mode M0 | |||
|---|---|---|---|
| Quadrant | BADHDUFLAG | Total packets | Discarded packets |
| A | 0 | 11247 | 1 |
| B | 0 | 10043 | 1 |
| C | 0 | 9966 | 1 |
| D | 0 | 34869 | 1 |
| Quadrant | Total seconds | Saturated seconds | Saturation percentage |
|---|---|---|---|
| A | 4957 | 63 | 1.270930% |
| B | 4957 | 5 | 0.100867% |
| C | 4957 | 4 | 0.080694% |
| D | 4957 | 3504 | 70.687916% |
Noise dominated data is calculated using 1-second bins in cleaned event files. If a bin has >2000 counts, and if more than 50% of those come from <1% of pixels, then it is considered to be noise-dominated and hence unusable.
| Quadrant | # 1 sec bins | Bins with >0 counts | Bins with >2000 counts | High rate bins dominated by noise | Noise dominated (total time) | Noise dominated (detector-on time) | Marked lightcurve |
|---|---|---|---|---|---|---|---|
| A | 4957 | 4957 | 41 | 41 | 0.83% | 0.83% | 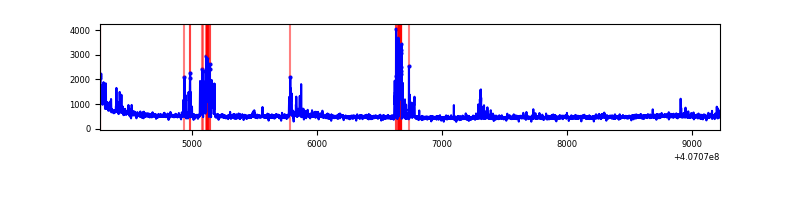 |
| B | 4957 | 4957 | 1 | 1 | 0.02% | 0.02% | 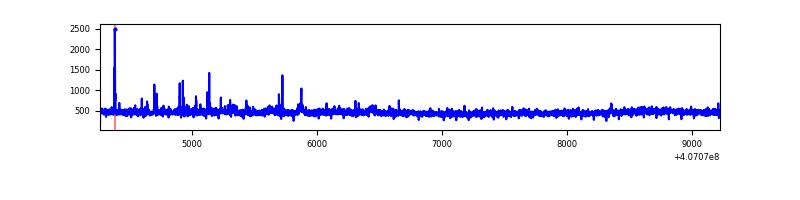 |
| C | 4957 | 4957 | 2 | 2 | 0.04% | 0.04% | 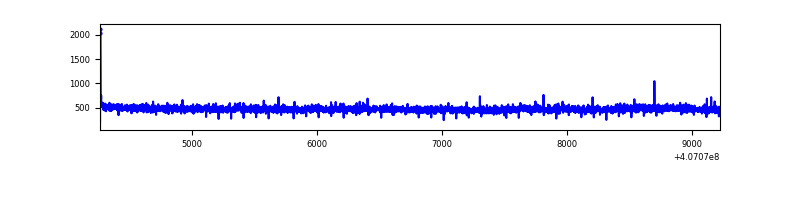 |
| D | 4957 | 4957 | 3095 | 3095 | 62.44% | 62.44% | 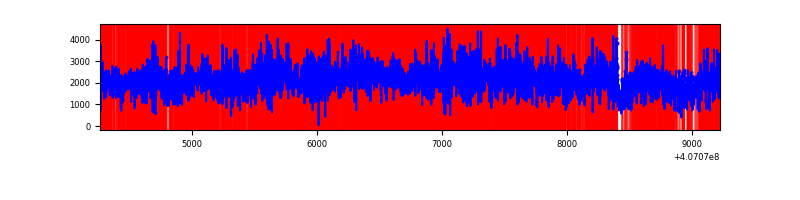 |
Top three noisy pixels from each quadrant. If the there are fewer than three noisy pixels in the level2.evt file, extra rows are filled as -1
| Pixel properties | Quadrant properties | ||||||
|---|---|---|---|---|---|---|---|
| Quadrant | DetID | PixID | Counts | Sigma | Mean | Median | Sigma |
| A | 10 | 83 | 301312 | 2647.4 | 555 | 543 | 113.6 |
| A | 13 | 248 | 272434 | 2393.22 | 555 | 543 | 113.6 |
| A | 0 | 8 | 61217 | 534.06 | 555 | 543 | 113.6 |
| B | 4 | 171 | 38037 | 350.58 | 552 | 538 | 107.0 |
| B | 0 | 230 | 13919 | 125.1 | 552 | 538 | 107.0 |
| B | 12 | 111 | 13903 | 124.95 | 552 | 538 | 107.0 |
| C | 15 | 214 | 200934 | 1569.59 | 542 | 546 | 127.7 |
| C | 3 | 110 | 13479 | 101.3 | 542 | 546 | 127.7 |
| C | 0 | 10 | 6775 | 48.79 | 542 | 546 | 127.7 |
| D | 2 | 16 | 5315632 | 51001.55 | 421 | 409 | 104.2 |
| D | 2 | 249 | 1646760 | 15797.35 | 421 | 409 | 104.2 |
| D | 12 | 235 | 1608575 | 15430.95 | 421 | 409 | 104.2 |
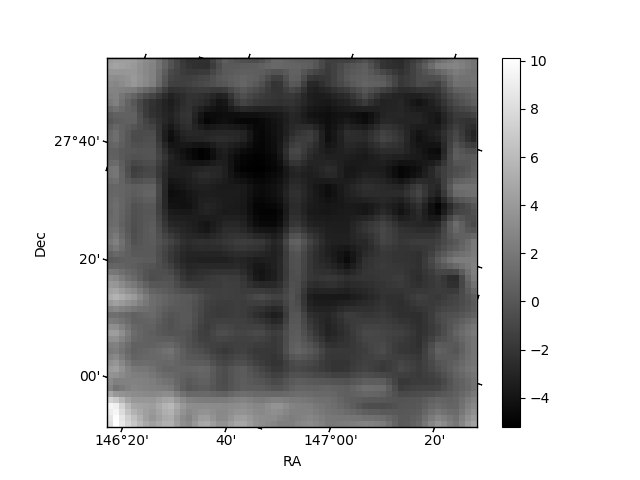
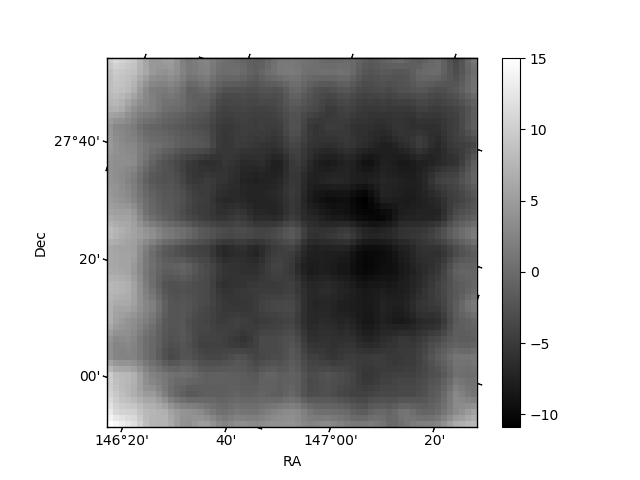
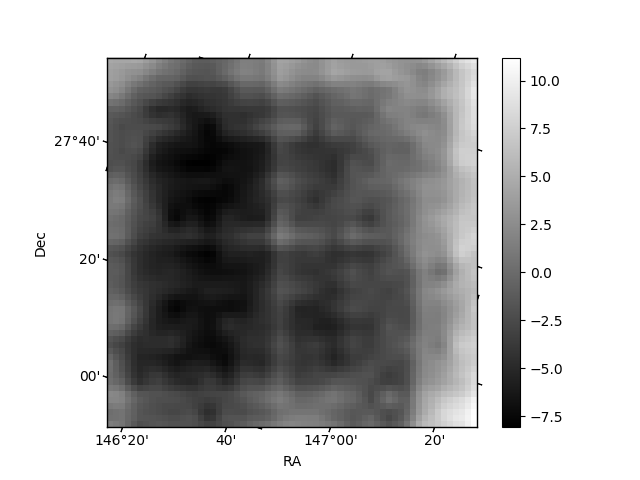
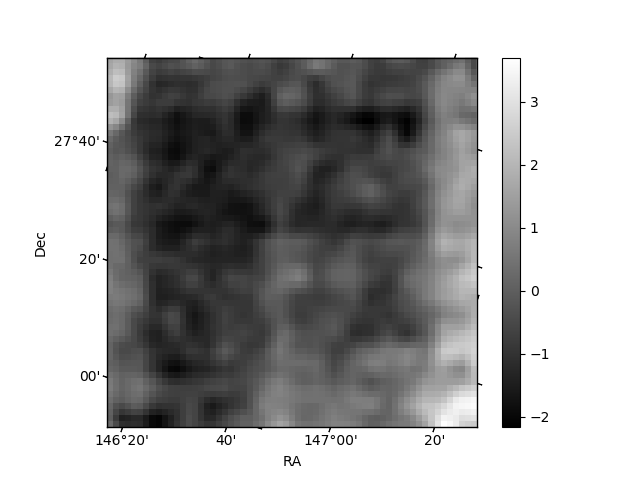
Histogram calculated using DETX and DETY for each event in the final _common_clean file
| Quadrant A | 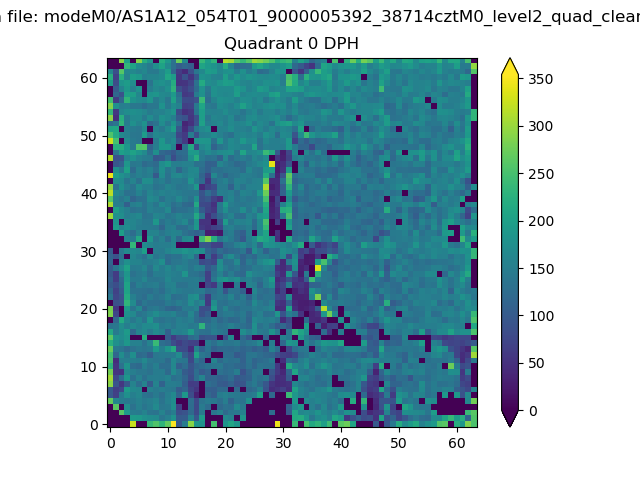 |
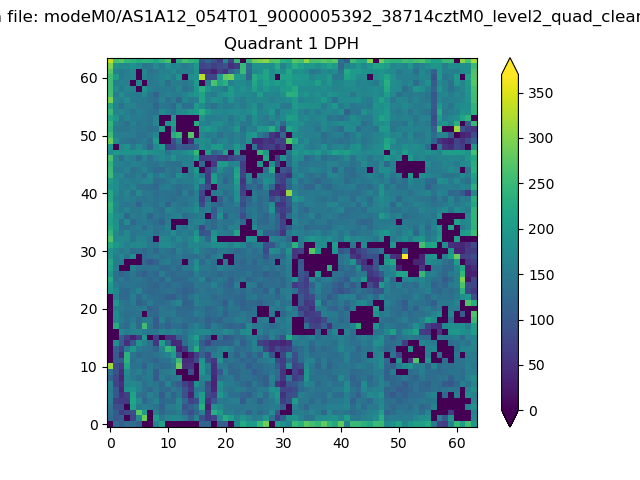 |
Quadrant B |
|---|---|---|---|
| Quadrant D | 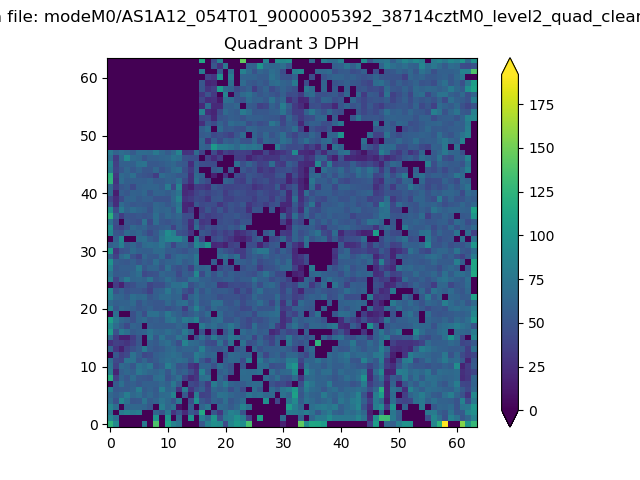 |
 |
Quadrant C |
| Plot type | Count rate plots | Images |
|---|---|---|
| Comparison with Poisson distribution Blue bars denote a histogram of data divided into 1 sec bins. Red curve is a Poisson curve with rate = median count rate of data. |
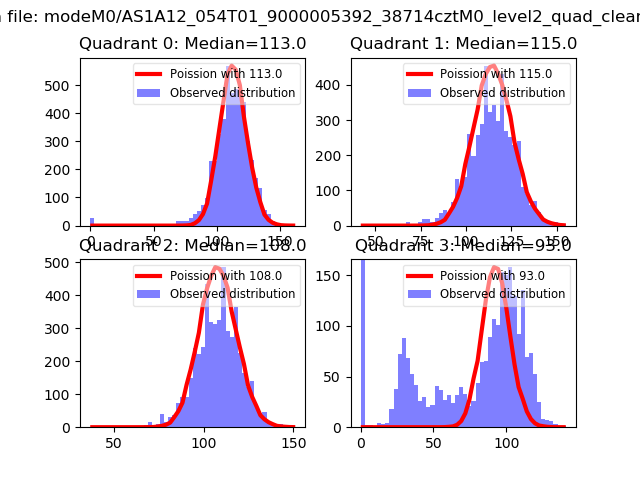 |
 |
| Quadrant-wise count rates Data is divided into 100 sec bins |
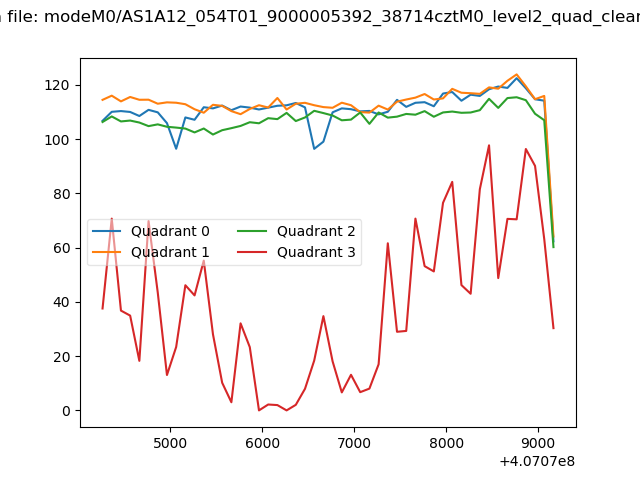 |
|
| Module-wise count rates for Quadrant A Data is divided into 100 sec bins |
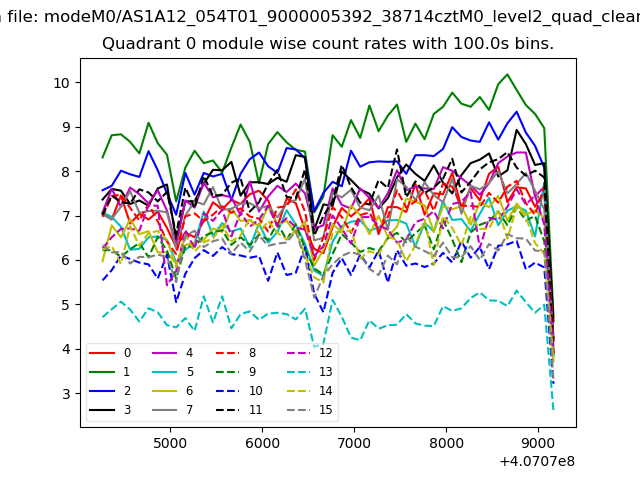 |
 |
| Module-wise count rates for Quadrant B Data is divided into 100 sec bins |
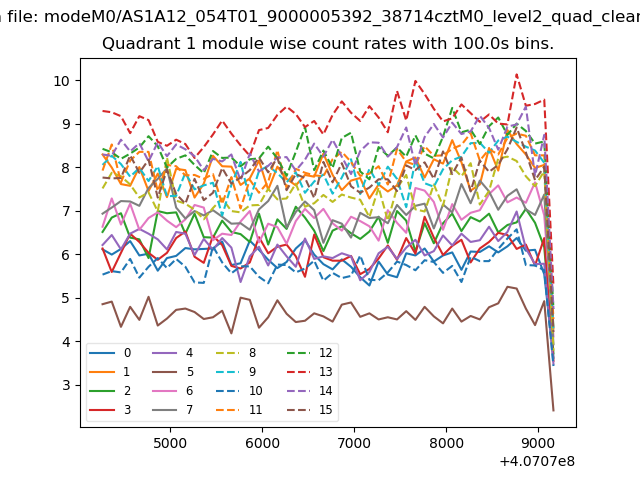 |
 |
| Module-wise count rates for Quadrant C Data is divided into 100 sec bins |
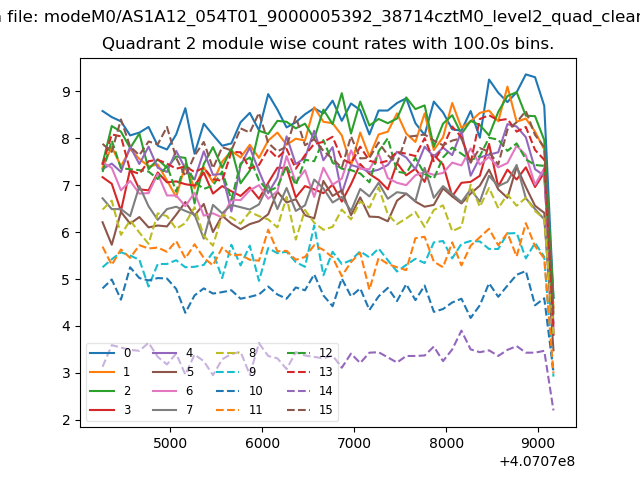 |
 |
| Module-wise count rates for Quadrant D Data is divided into 100 sec bins |
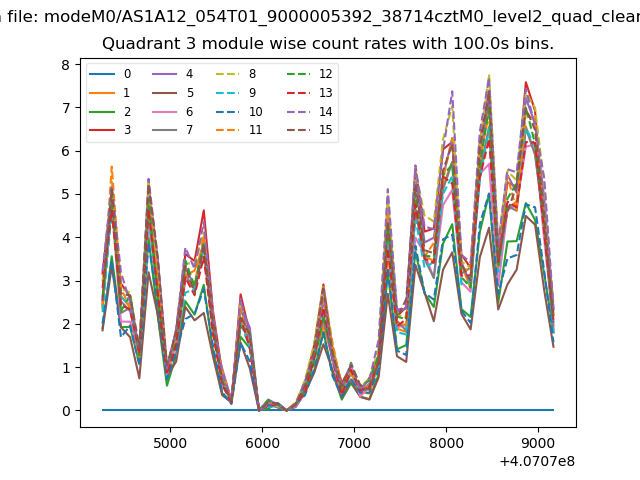 |
 |
| Parameter | Plot |
|---|---|
| CZT HV Monitor | 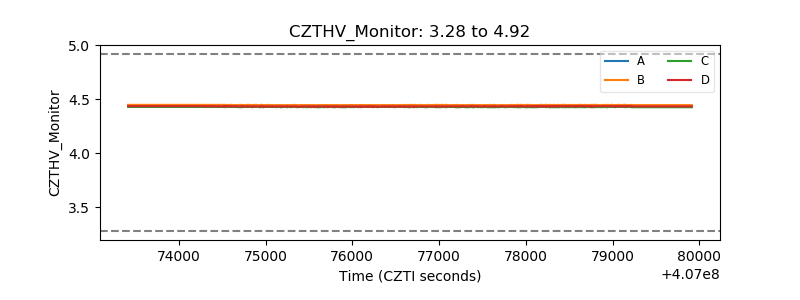 |
| D_VDD | 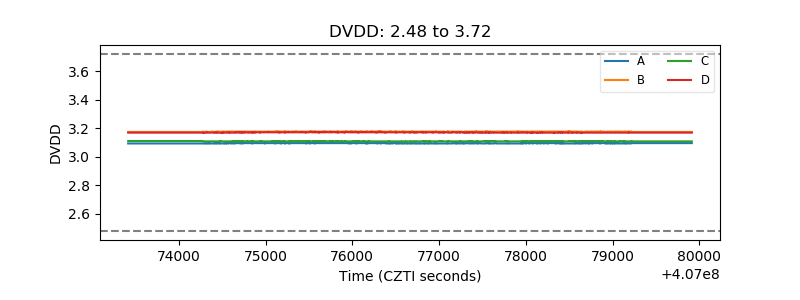 |
| Temperature 1 | 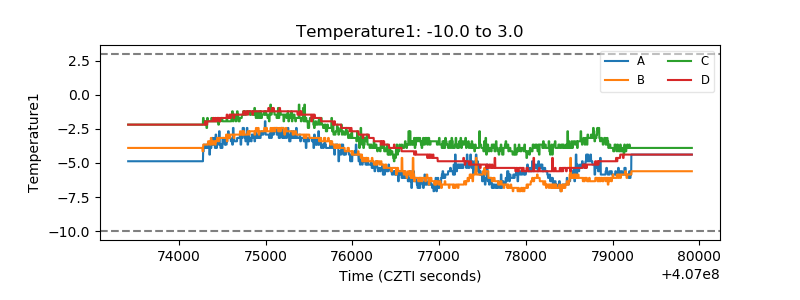 |
| Veto HV Monitor | 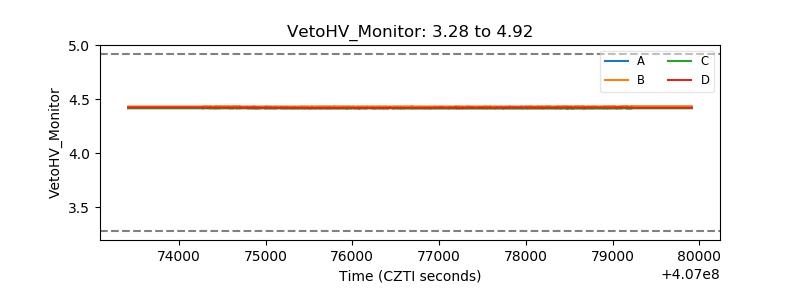 |
| Veto LLD | 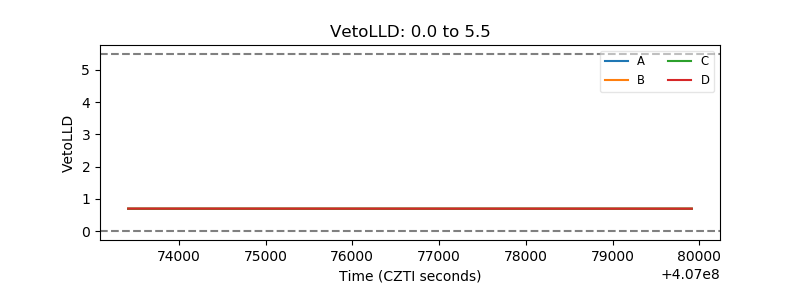 |
| Alpha Counter | 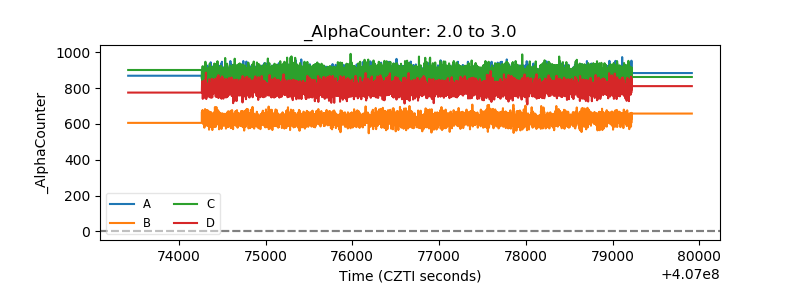 |
| _CPM_Rate | 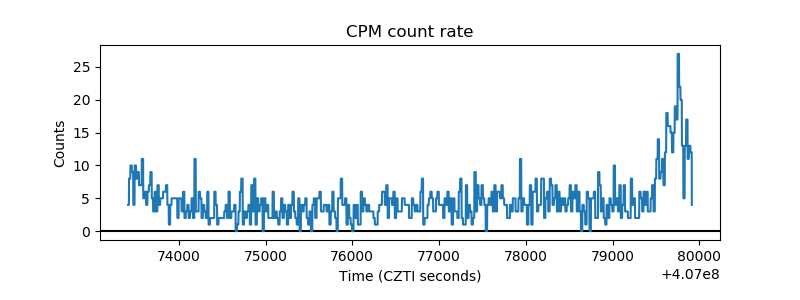 |
| CZT Counter | 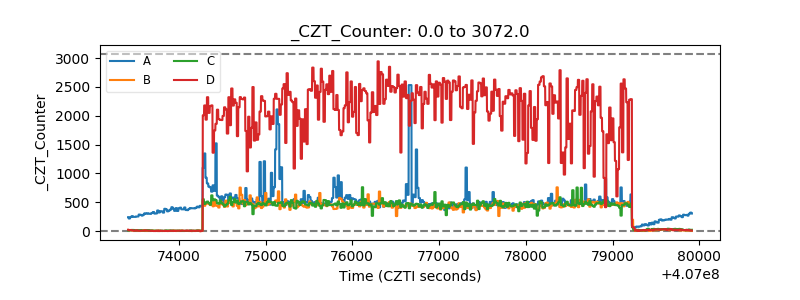 |
| +2.5 Volts monitor |  |
| +5 Volts monitor | 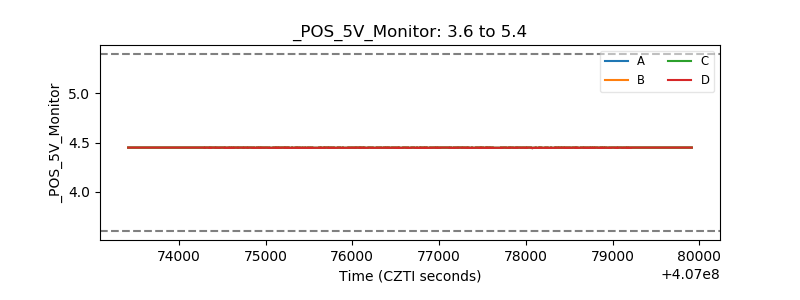 |
| _ROLL_ROT | 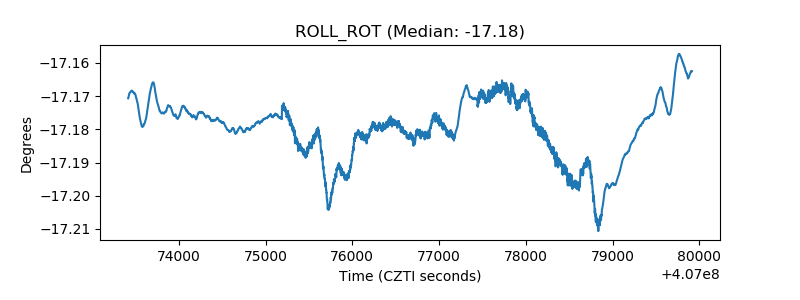 |
| _Roll_DEC |  |
| _Roll_RA | 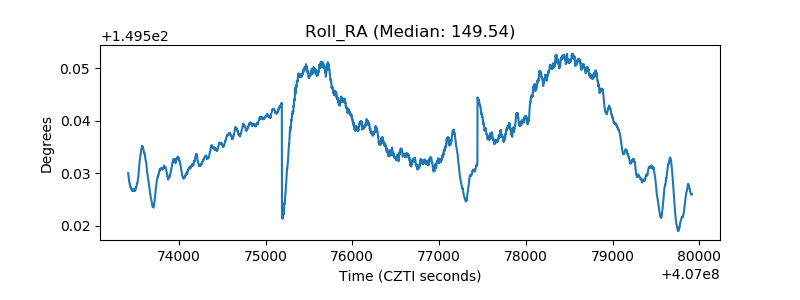 |
| Veto Counter | 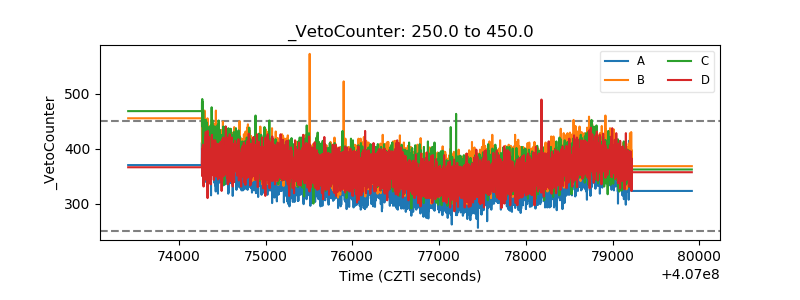 |