| Param | Original file | Final file |
|---|---|---|
| Filename | modeM0/AS1A12_054T01_9000005392_38716cztM0_level2.fits | modeM0/AS1A12_054T01_9000005392_38716cztM0_level2_quad_clean.evt |
| Size (bytes) | 955,713,600 | 169,346,880 |
| Size | 911.4 MB | 161.5 MB |
| Events in quadrant A | 6,594,889 | 1,202,143 |
| Events in quadrant B | 6,516,695 | 1,172,829 |
| Events in quadrant C | 5,467,963 | 1,161,892 |
| Events in quadrant D | 15,963,873 | 843,709 |
| Mode M9 | |||
|---|---|---|---|
| Quadrant | BADHDUFLAG | Total packets | Discarded packets |
| A | 0 | 36 | 0 |
| B | 0 | 36 | 0 |
| C | 0 | 36 | 0 |
| D | 0 | 37 | 0 |
| Mode SS | |||
|---|---|---|---|
| Quadrant | BADHDUFLAG | Total packets | Discarded packets |
| A | 0 | 220 | 0 |
| B | 0 | 220 | 0 |
| C | 0 | 220 | 0 |
| D | 0 | 220 | 0 |
| Mode M0 | |||
|---|---|---|---|
| Quadrant | BADHDUFLAG | Total packets | Discarded packets |
| A | 0 | 26336 | 4 |
| B | 0 | 26585 | 3 |
| C | 0 | 22869 | 3 |
| D | 0 | 54866 | 3 |
| Quadrant | Total seconds | Saturated seconds | Saturation percentage |
|---|---|---|---|
| A | 10780 | 155 | 1.437848% |
| B | 10780 | 460 | 4.267161% |
| C | 10780 | 40 | 0.371058% |
| D | 10780 | 3052 | 28.311688% |
Noise dominated data is calculated using 1-second bins in cleaned event files. If a bin has >2000 counts, and if more than 50% of those come from <1% of pixels, then it is considered to be noise-dominated and hence unusable.
| Quadrant | # 1 sec bins | Bins with >0 counts | Bins with >2000 counts | High rate bins dominated by noise | Noise dominated (total time) | Noise dominated (detector-on time) | Marked lightcurve |
|---|---|---|---|---|---|---|---|
| A | 13614 | 10782 | 85 | 85 | 0.62% | 0.79% | 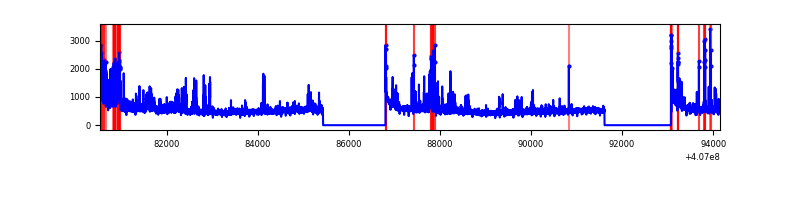 |
| B | 13614 | 10782 | 302 | 302 | 2.22% | 2.80% | 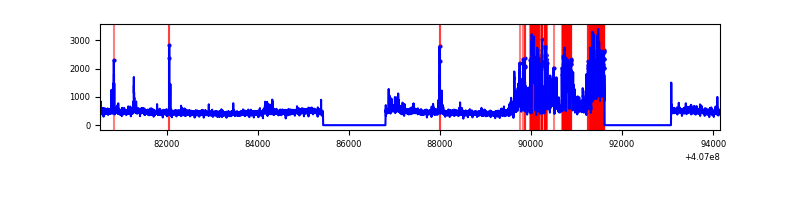 |
| C | 13614 | 10782 | 28 | 28 | 0.21% | 0.26% | 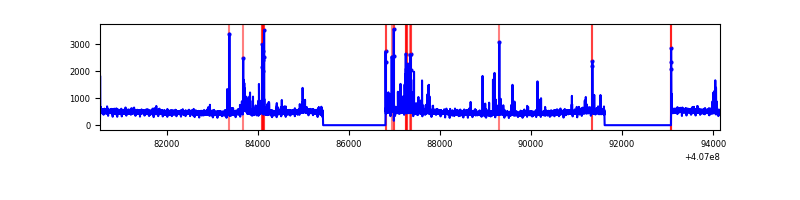 |
| D | 13614 | 10782 | 2439 | 2439 | 17.92% | 22.62% | 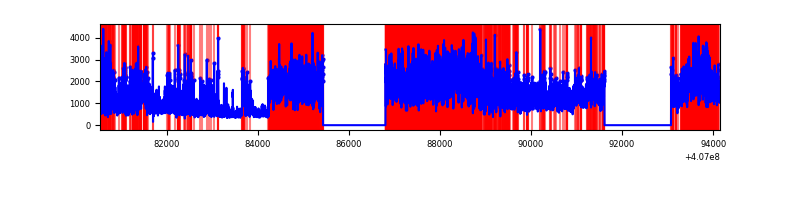 |
Top three noisy pixels from each quadrant. If the there are fewer than three noisy pixels in the level2.evt file, extra rows are filled as -1
| Pixel properties | Quadrant properties | ||||||
|---|---|---|---|---|---|---|---|
| Quadrant | DetID | PixID | Counts | Sigma | Mean | Median | Sigma |
| A | 10 | 83 | 716925 | 2903.88 | 1217 | 1191 | 246.5 |
| A | 0 | 8 | 712911 | 2887.6 | 1217 | 1191 | 246.5 |
| A | 13 | 248 | 360946 | 1459.6 | 1217 | 1191 | 246.5 |
| B | 5 | 184 | 1525027 | 6616.06 | 1195 | 1163 | 230.3 |
| B | 0 | 190 | 74538 | 318.57 | 1195 | 1163 | 230.3 |
| B | 4 | 171 | 64639 | 275.59 | 1195 | 1163 | 230.3 |
| C | 15 | 214 | 439217 | 1576.28 | 1187 | 1191 | 277.9 |
| C | 14 | 254 | 334022 | 1197.73 | 1187 | 1191 | 277.9 |
| C | 0 | 10 | 22877 | 78.04 | 1187 | 1191 | 277.9 |
| D | 2 | 16 | 7174448 | 26849.67 | 1092 | 1062 | 267.2 |
| D | 12 | 235 | 3483962 | 13036.34 | 1092 | 1062 | 267.2 |
| D | 2 | 249 | 331386 | 1236.39 | 1092 | 1062 | 267.2 |
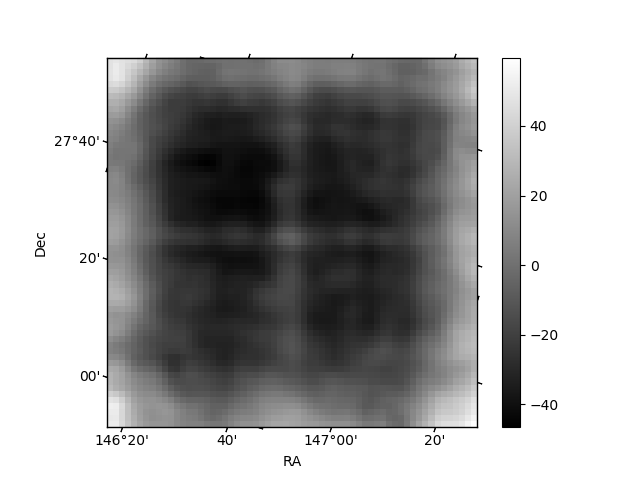
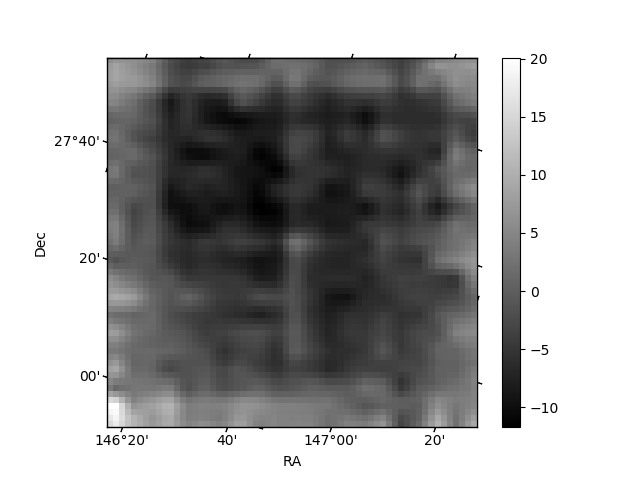
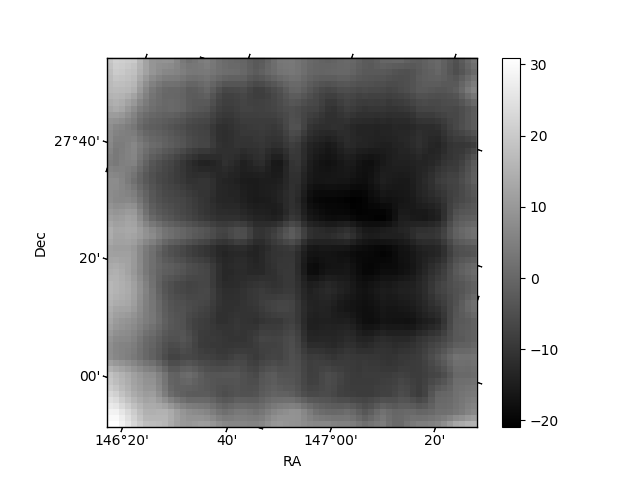
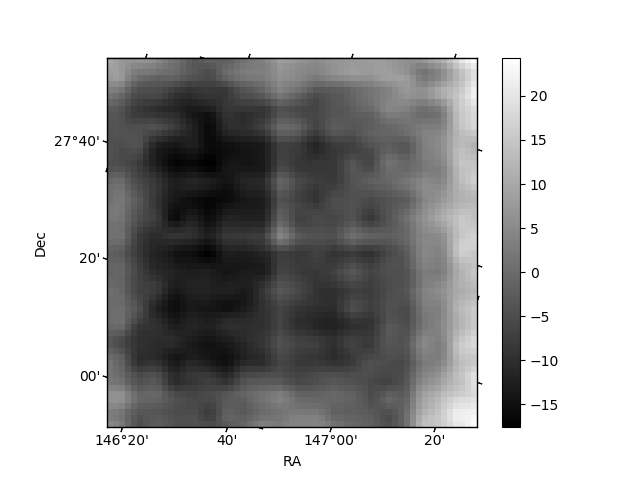
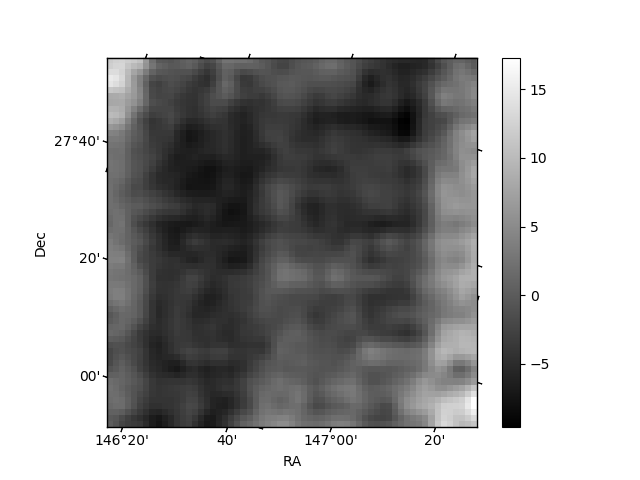
Histogram calculated using DETX and DETY for each event in the final _common_clean file
| Quadrant A | 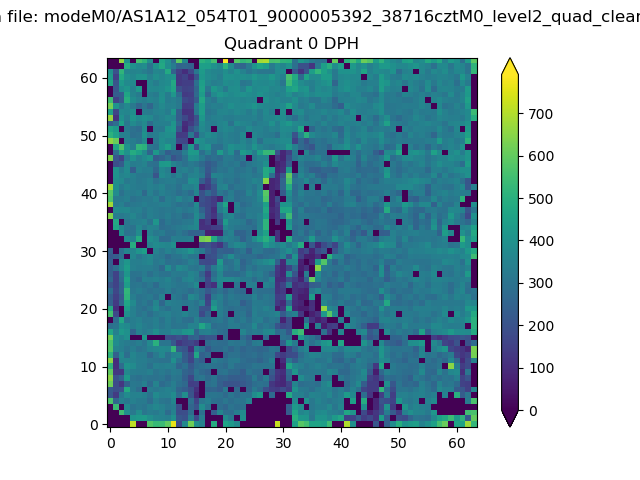 |
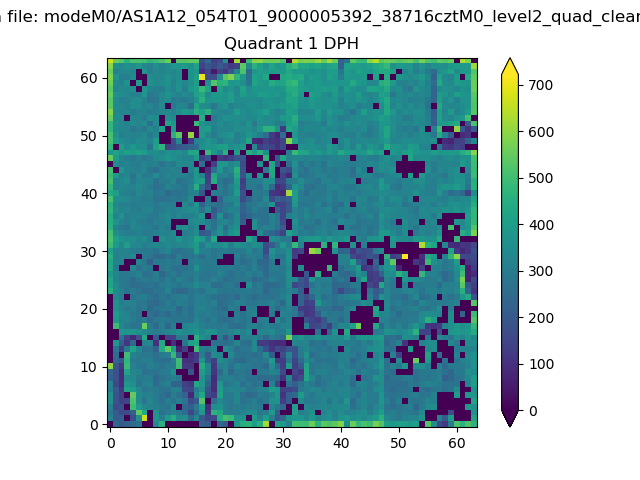 |
Quadrant B |
|---|---|---|---|
| Quadrant D | 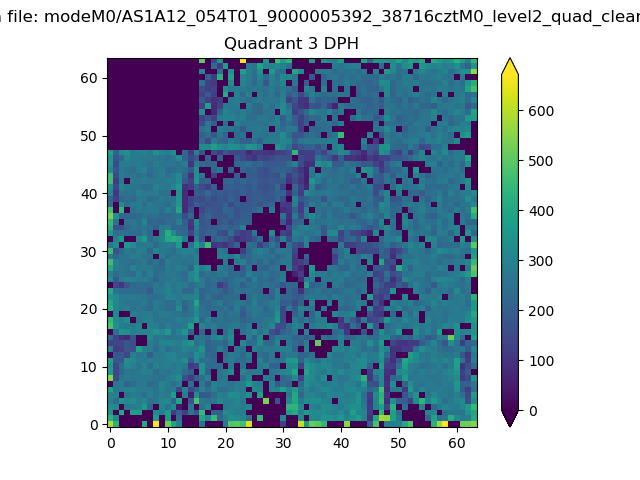 |
 |
Quadrant C |
| Plot type | Count rate plots | Images |
|---|---|---|
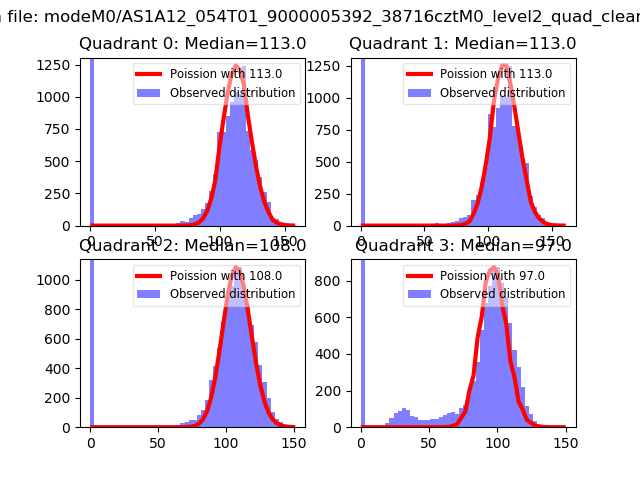
| Comparison with Poisson distribution Blue bars denote a histogram of data divided into 1 sec bins. Red curve is a Poisson curve with rate = median count rate of data. |
 |
 |
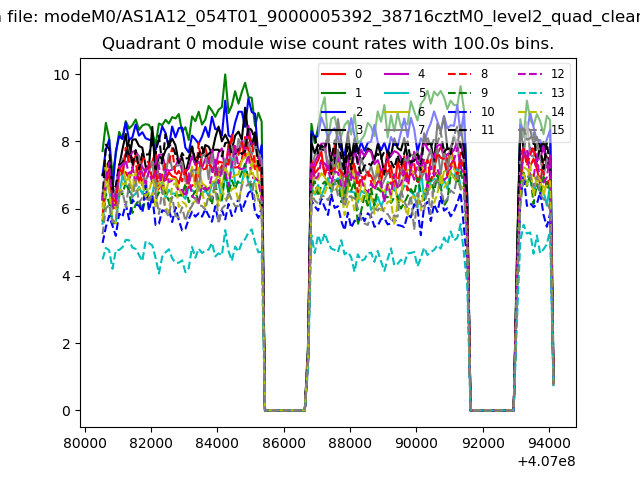
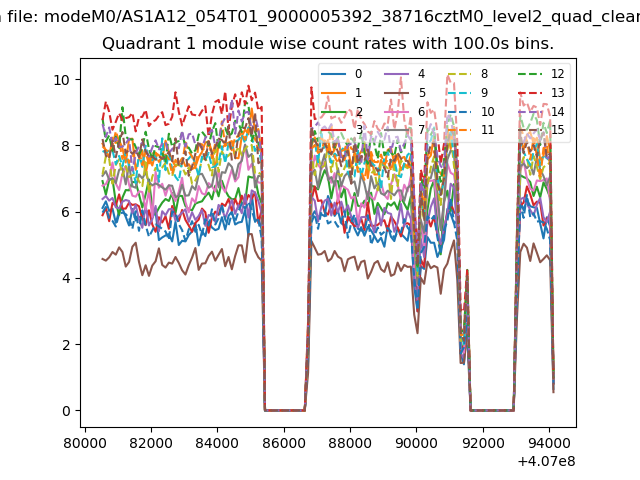
| Quadrant-wise count rates Data is divided into 100 sec bins |
 |
|
| Module-wise count rates for Quadrant A Data is divided into 100 sec bins |
 |
 |
| Module-wise count rates for Quadrant B Data is divided into 100 sec bins |
 |
 |
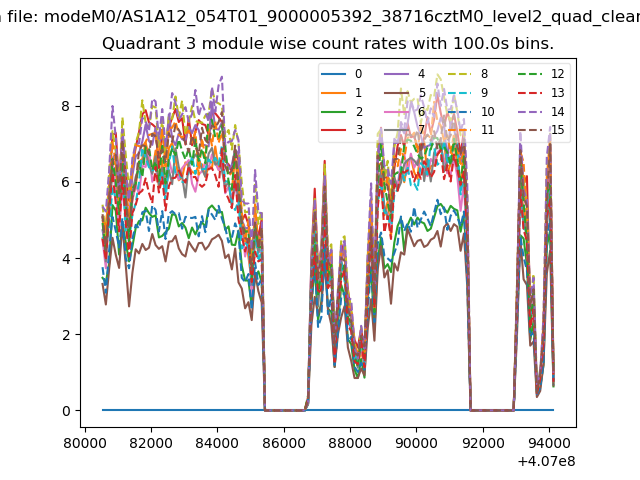
| Module-wise count rates for Quadrant C Data is divided into 100 sec bins |
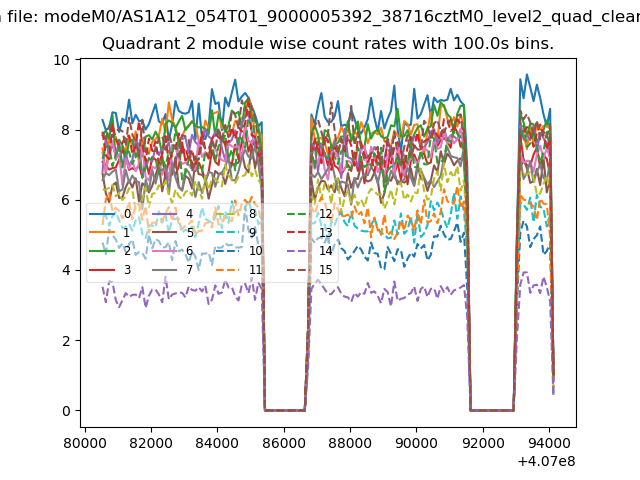 |
 |
| Module-wise count rates for Quadrant D Data is divided into 100 sec bins |
 |
 |
| Parameter | Plot |
|---|---|
| CZT HV Monitor | 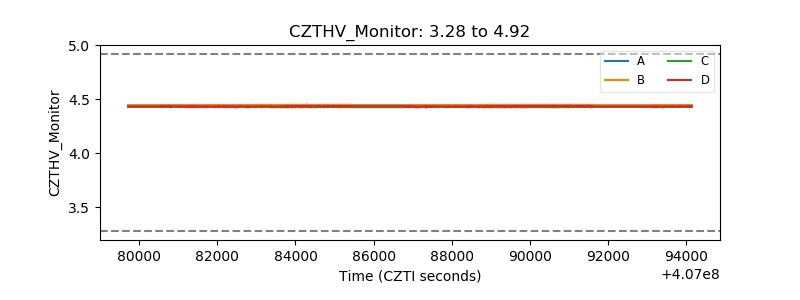 |
| D_VDD | 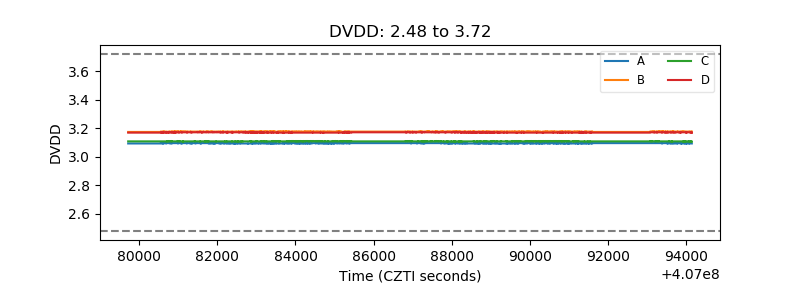 |
| Temperature 1 | 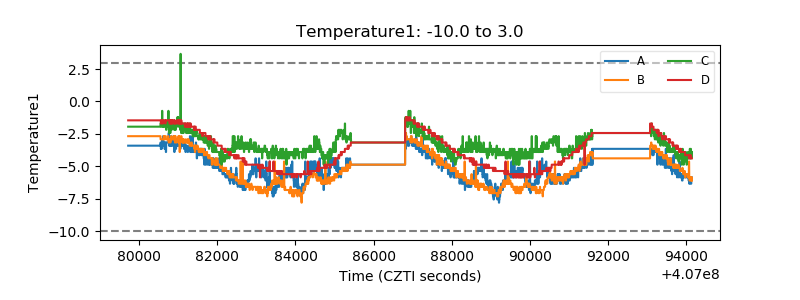 |
| Veto HV Monitor | 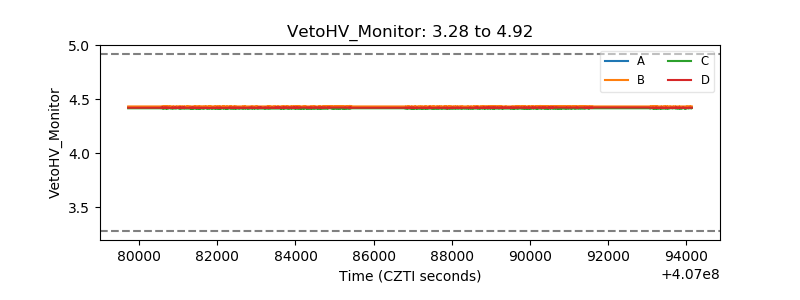 |
| Veto LLD | 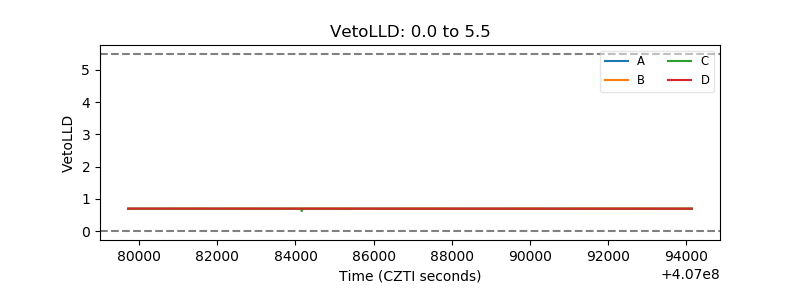 |
| Alpha Counter | 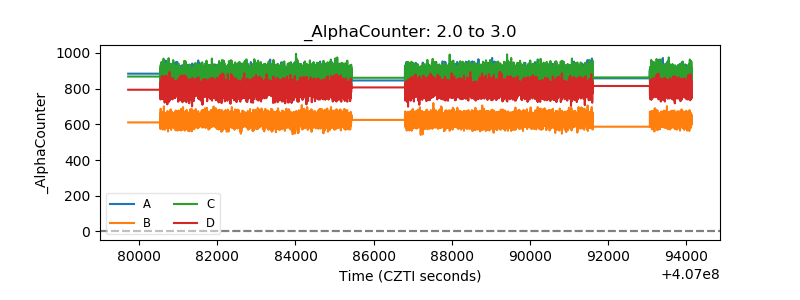 |
| _CPM_Rate | 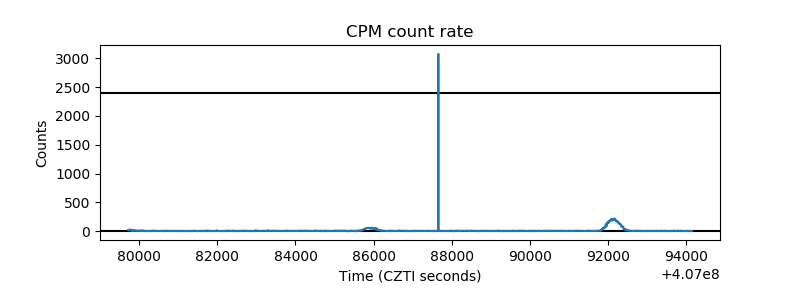 |
| CZT Counter |  |
| +2.5 Volts monitor | 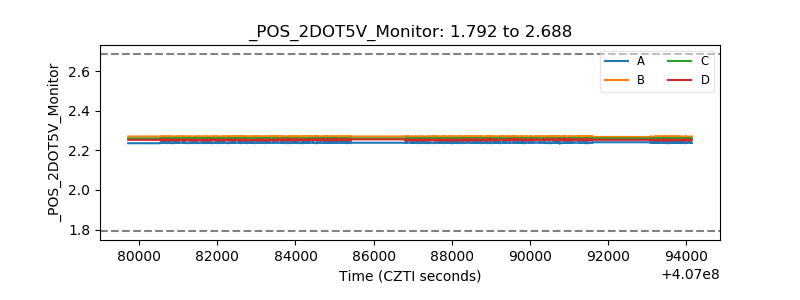 |
| +5 Volts monitor | 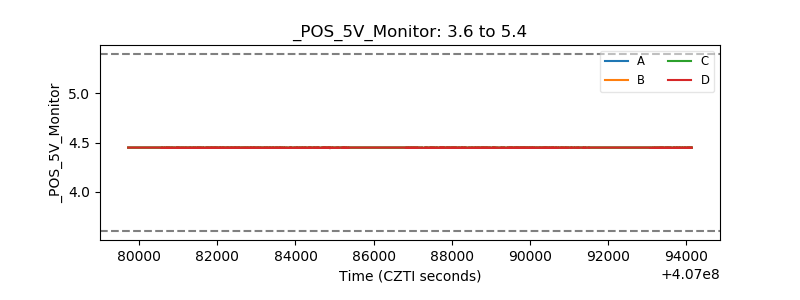 |
| _ROLL_ROT | 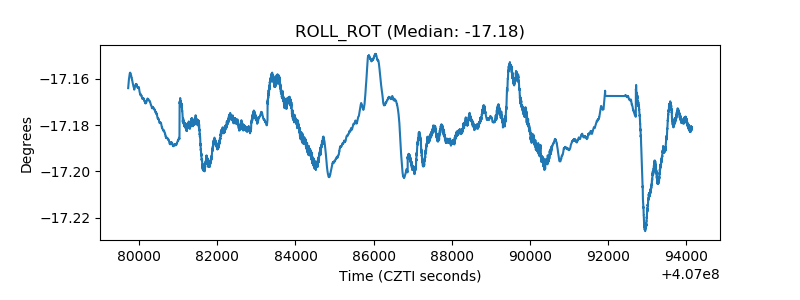 |
| _Roll_DEC |  |
| _Roll_RA | 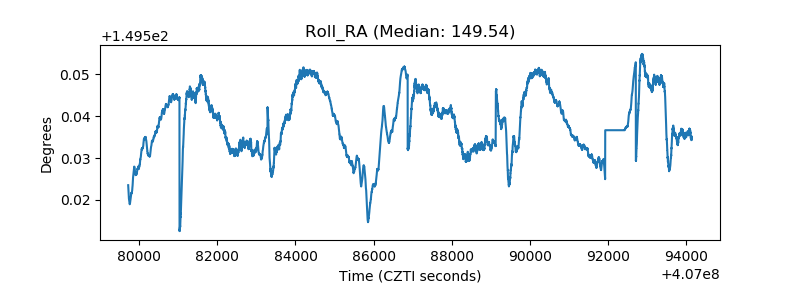 |
| Veto Counter | 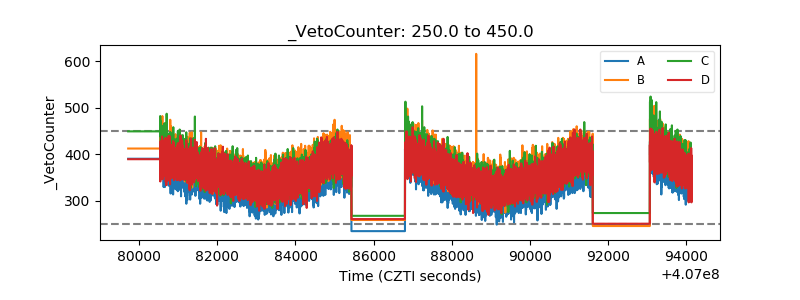 |