| Param | Original file | Final file |
|---|---|---|
| Filename | modeM0/AS1A12_054T01_9000005392_38717cztM0_level2.fits | modeM0/AS1A12_054T01_9000005392_38717cztM0_level2_quad_clean.evt |
| Size (bytes) | 541,972,800 | 85,394,880 |
| Size | 516.9 MB | 81.4 MB |
| Events in quadrant A | 3,155,871 | 634,670 |
| Events in quadrant B | 2,600,570 | 644,841 |
| Events in quadrant C | 2,792,602 | 615,492 |
| Events in quadrant D | 11,077,074 | 298,462 |
| Mode M9 | |||
|---|---|---|---|
| Quadrant | BADHDUFLAG | Total packets | Discarded packets |
| A | 0 | 27 | 0 |
| B | 0 | 27 | 0 |
| C | 0 | 27 | 0 |
| D | 0 | 28 | 0 |
| Mode SS | |||
|---|---|---|---|
| Quadrant | BADHDUFLAG | Total packets | Discarded packets |
| A | 0 | 114 | 0 |
| B | 0 | 114 | 0 |
| C | 0 | 114 | 0 |
| D | 0 | 114 | 0 |
| Mode M0 | |||
|---|---|---|---|
| Quadrant | BADHDUFLAG | Total packets | Discarded packets |
| A | 0 | 12945 | 3 |
| B | 0 | 11449 | 2 |
| C | 0 | 11748 | 2 |
| D | 0 | 36785 | 2 |
| Quadrant | Total seconds | Saturated seconds | Saturation percentage |
|---|---|---|---|
| A | 5605 | 66 | 1.177520% |
| B | 5605 | 12 | 0.214095% |
| C | 5605 | 12 | 0.214095% |
| D | 5605 | 3105 | 55.396967% |
Noise dominated data is calculated using 1-second bins in cleaned event files. If a bin has >2000 counts, and if more than 50% of those come from <1% of pixels, then it is considered to be noise-dominated and hence unusable.
| Quadrant | # 1 sec bins | Bins with >0 counts | Bins with >2000 counts | High rate bins dominated by noise | Noise dominated (total time) | Noise dominated (detector-on time) | Marked lightcurve |
|---|---|---|---|---|---|---|---|
| A | 7187 | 5606 | 41 | 41 | 0.57% | 0.73% | 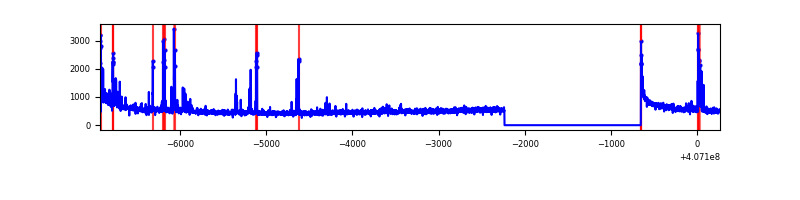 |
| B | 7187 | 5606 | 2 | 2 | 0.03% | 0.04% | 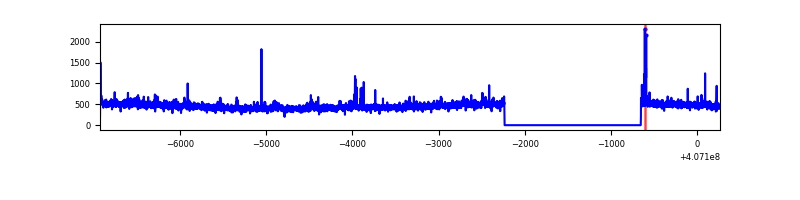 |
| C | 7187 | 5606 | 9 | 9 | 0.13% | 0.16% | 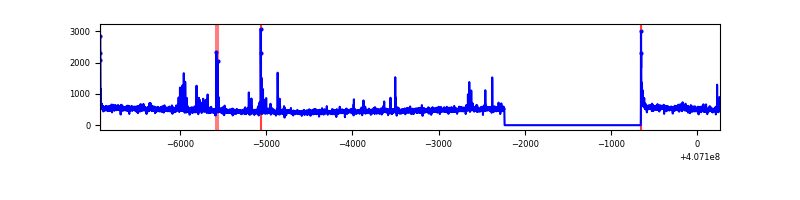 |
| D | 7187 | 5606 | 2713 | 2713 | 37.75% | 48.39% | 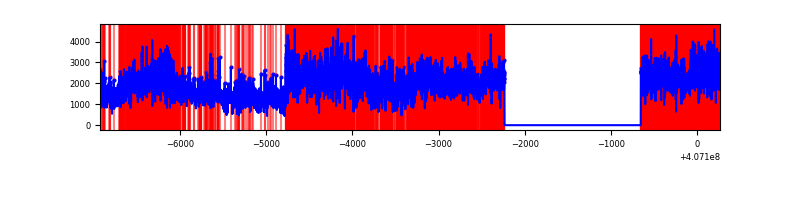 |
Top three noisy pixels from each quadrant. If the there are fewer than three noisy pixels in the level2.evt file, extra rows are filled as -1
| Pixel properties | Quadrant properties | ||||||
|---|---|---|---|---|---|---|---|
| Quadrant | DetID | PixID | Counts | Sigma | Mean | Median | Sigma |
| A | 10 | 83 | 401984 | 3109.97 | 633 | 620 | 129.1 |
| A | 9 | 143 | 151042 | 1165.54 | 633 | 620 | 129.1 |
| A | 0 | 8 | 125211 | 965.39 | 633 | 620 | 129.1 |
| B | 4 | 171 | 56340 | 447.31 | 631 | 612 | 124.6 |
| B | 5 | 184 | 16835 | 130.22 | 631 | 612 | 124.6 |
| B | 0 | 230 | 16214 | 125.23 | 631 | 612 | 124.6 |
| C | 15 | 214 | 231654 | 1583.99 | 620 | 624 | 145.9 |
| C | 14 | 254 | 93628 | 637.65 | 620 | 624 | 145.9 |
| C | 0 | 10 | 29674 | 199.17 | 620 | 624 | 145.9 |
| D | 12 | 235 | 5327618 | 42781.21 | 504 | 489 | 124.5 |
| D | 2 | 16 | 3544664 | 28462.62 | 504 | 489 | 124.5 |
| D | 10 | 118 | 88971 | 710.58 | 504 | 489 | 124.5 |
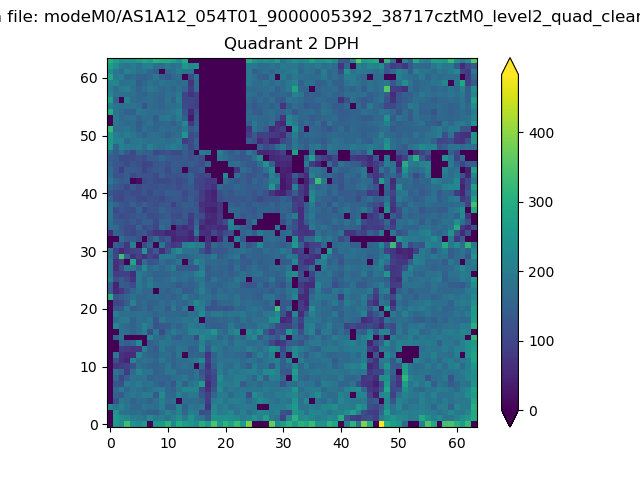
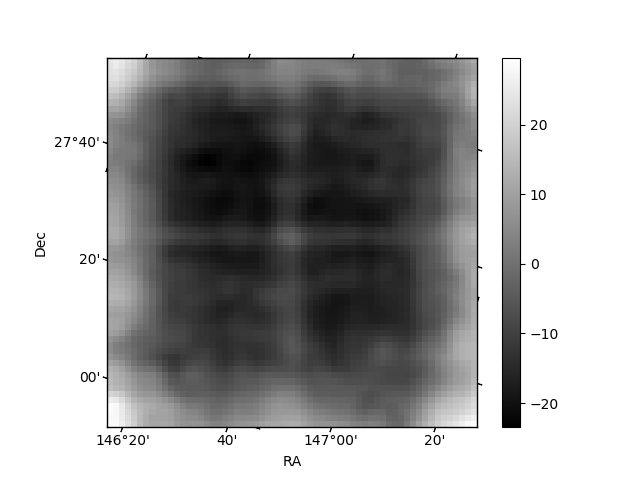
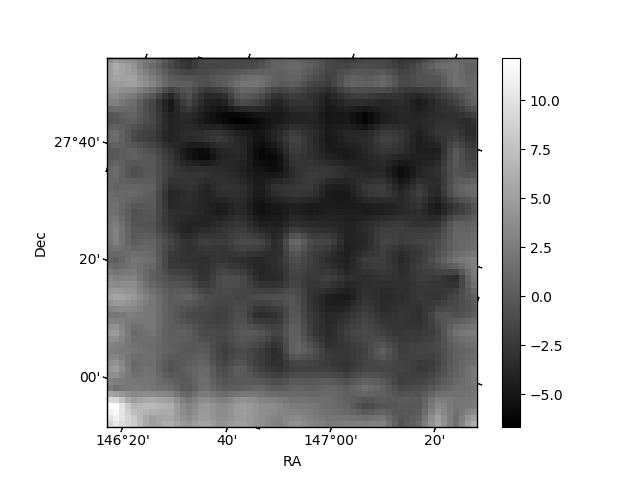
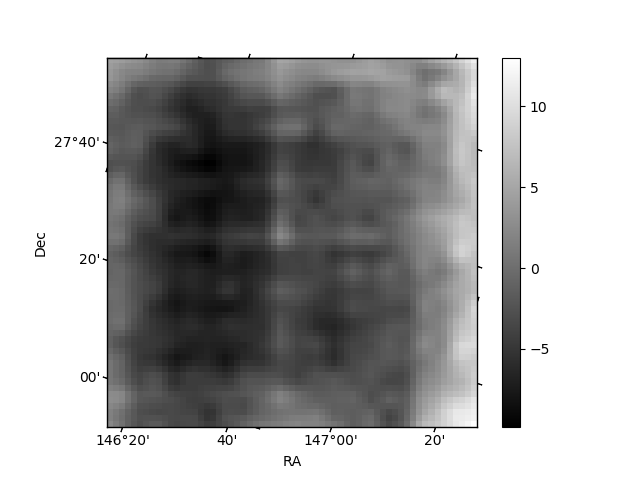
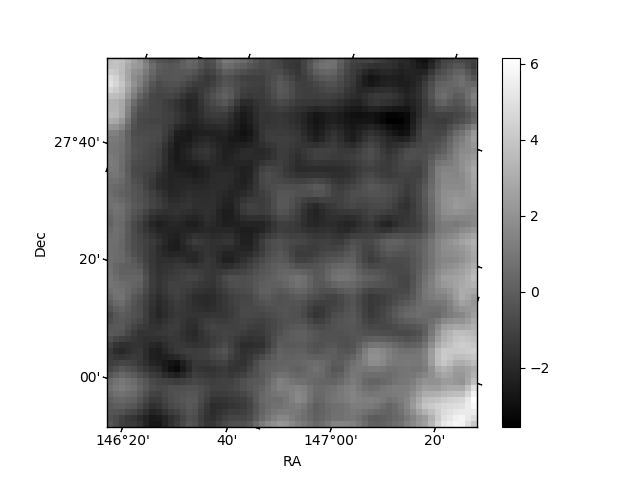
Histogram calculated using DETX and DETY for each event in the final _common_clean file
| Quadrant A | 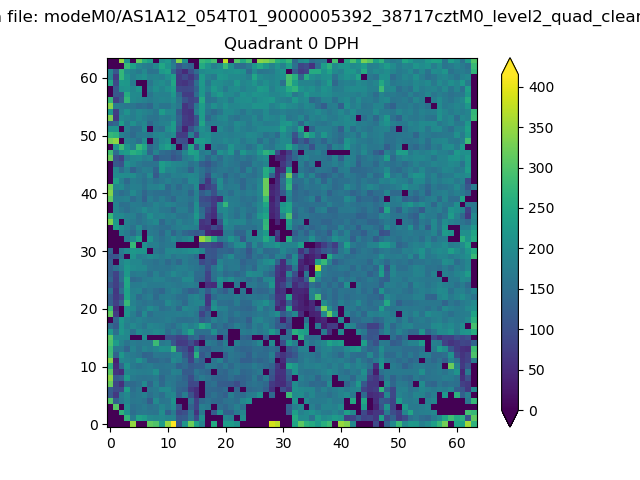 |
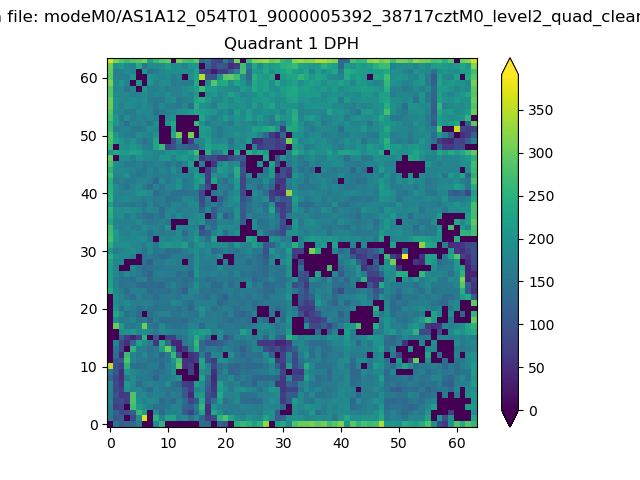 |
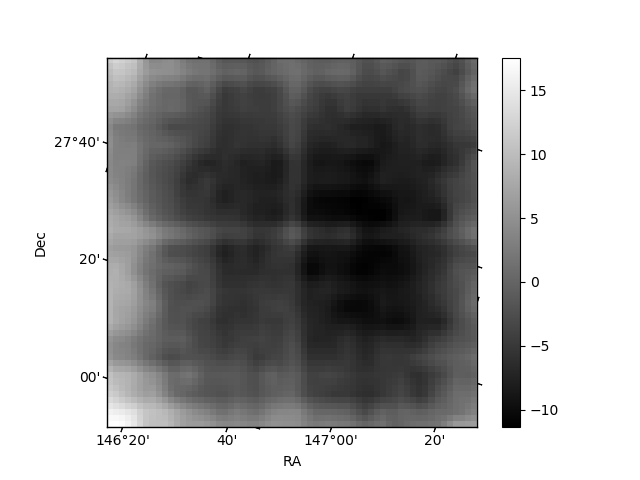
Quadrant B |
|---|---|---|---|
| Quadrant D | 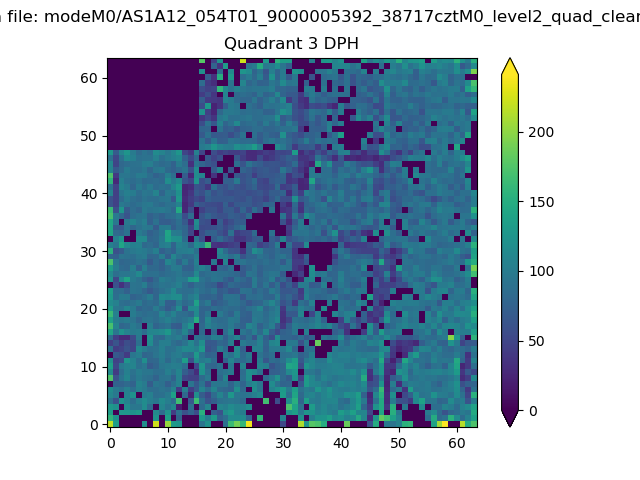 |
 |
Quadrant C |
| Plot type | Count rate plots | Images |
|---|---|---|
| Comparison with Poisson distribution Blue bars denote a histogram of data divided into 1 sec bins. Red curve is a Poisson curve with rate = median count rate of data. |
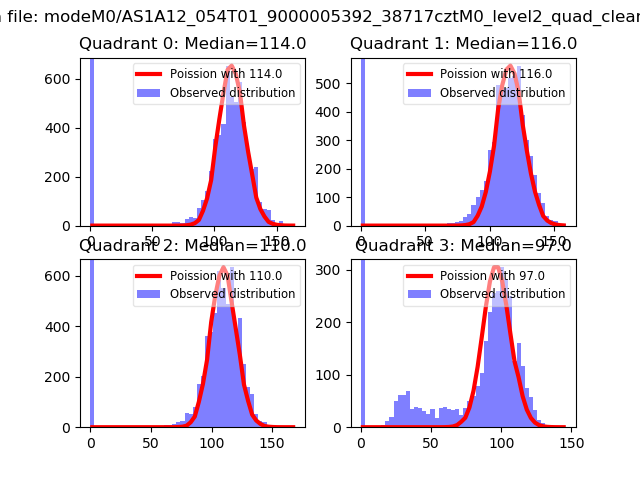 |
 |
| Quadrant-wise count rates Data is divided into 100 sec bins |
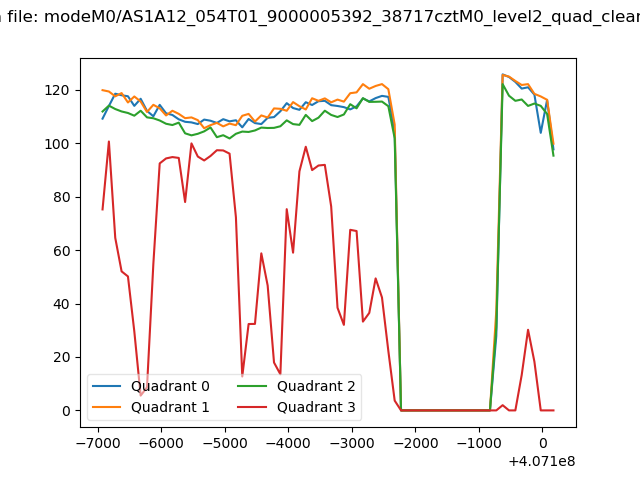 |
|
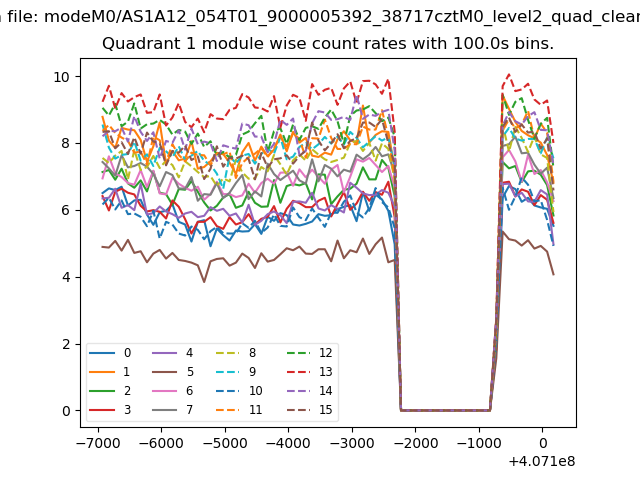
| Module-wise count rates for Quadrant A Data is divided into 100 sec bins |
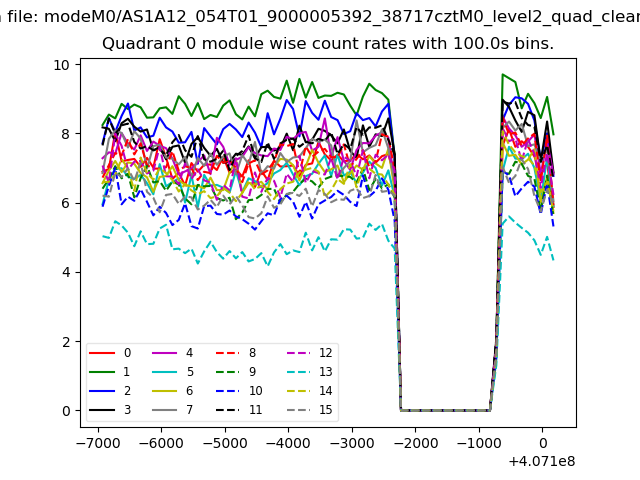 |
 |
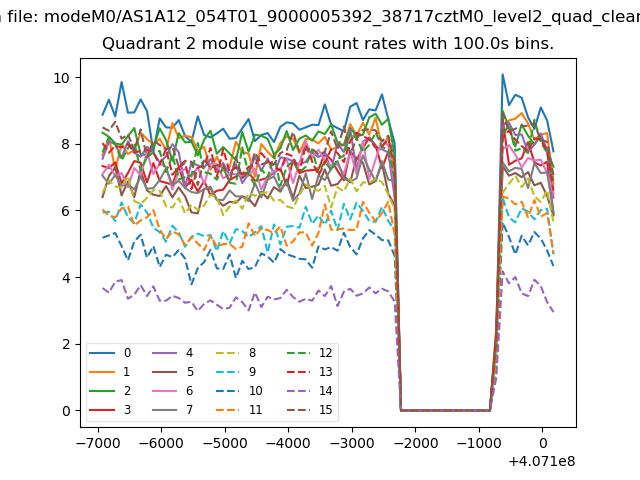
| Module-wise count rates for Quadrant B Data is divided into 100 sec bins |
 |
 |
| Module-wise count rates for Quadrant C Data is divided into 100 sec bins |
 |
 |
| Module-wise count rates for Quadrant D Data is divided into 100 sec bins |
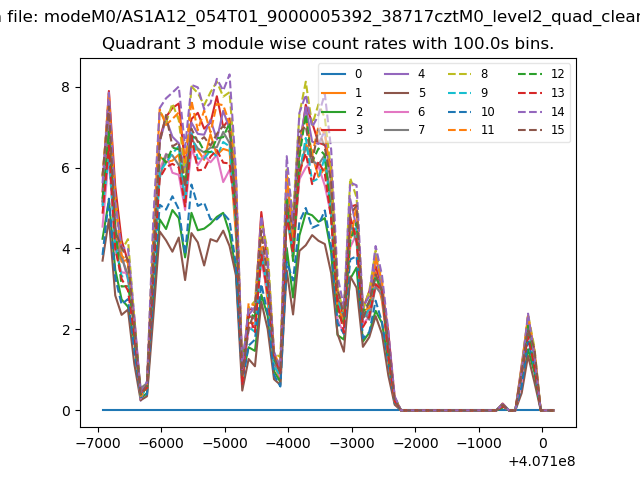 |
 |
| Parameter | Plot |
|---|---|
| CZT HV Monitor | 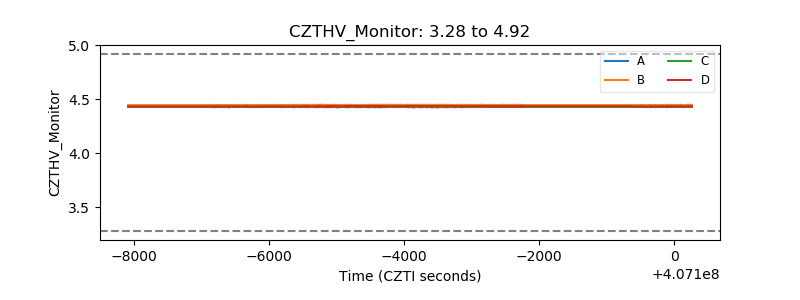 |
| D_VDD | 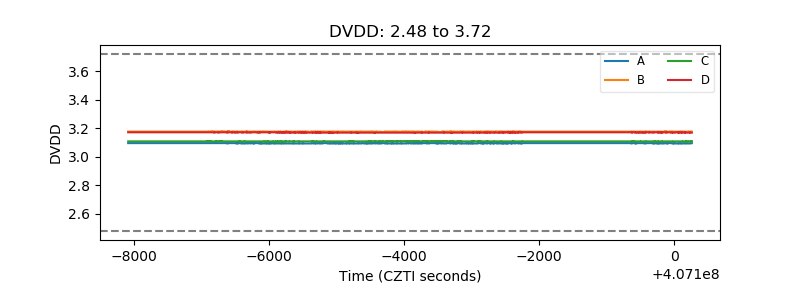 |
| Temperature 1 | 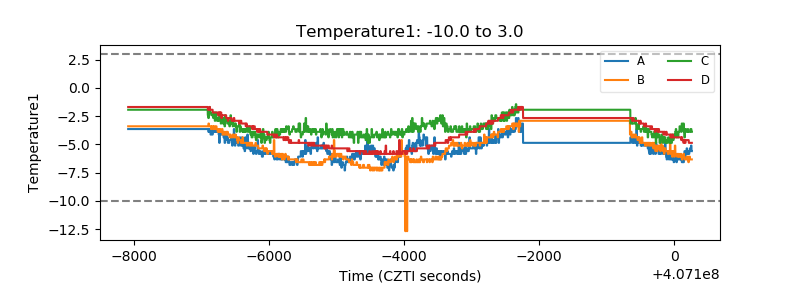 |
| Veto HV Monitor |  |
| Veto LLD | 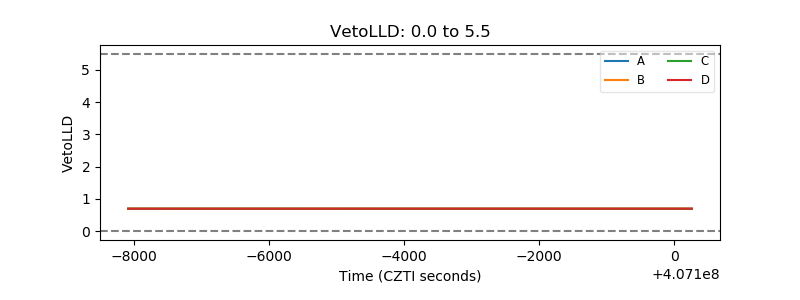 |
| Alpha Counter | 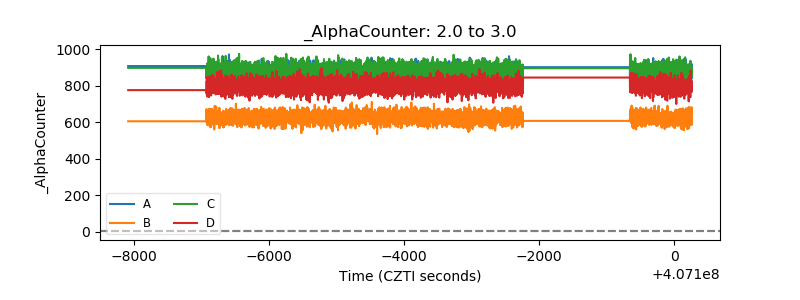 |
| _CPM_Rate | 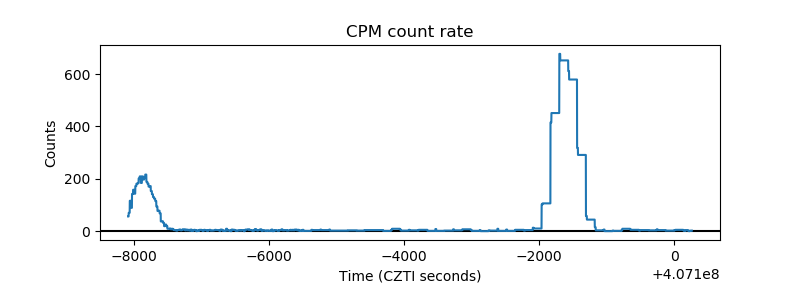 |
| CZT Counter | 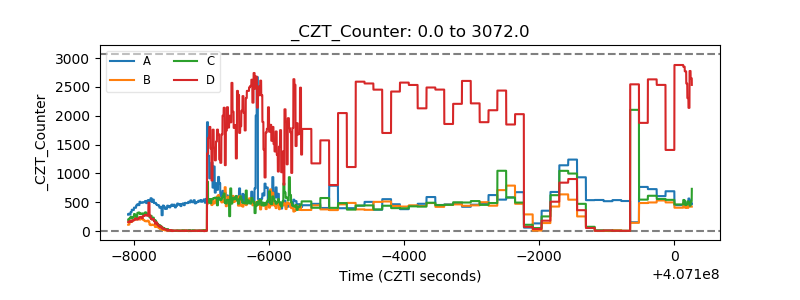 |
| +2.5 Volts monitor | 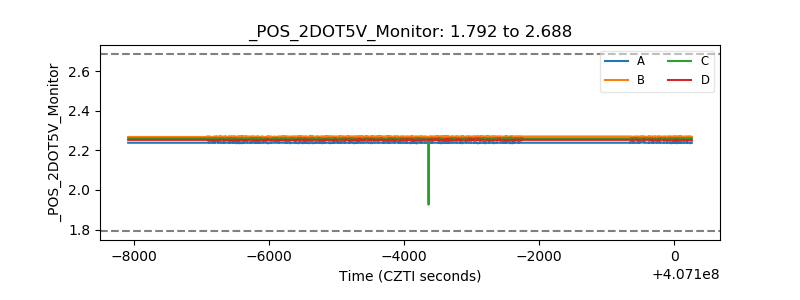 |
| +5 Volts monitor |  |
| _ROLL_ROT | 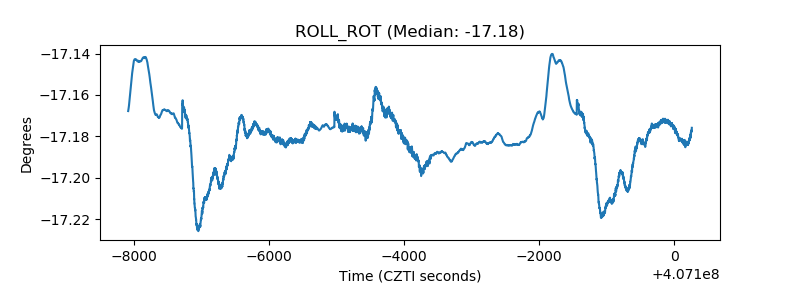 |
| _Roll_DEC | 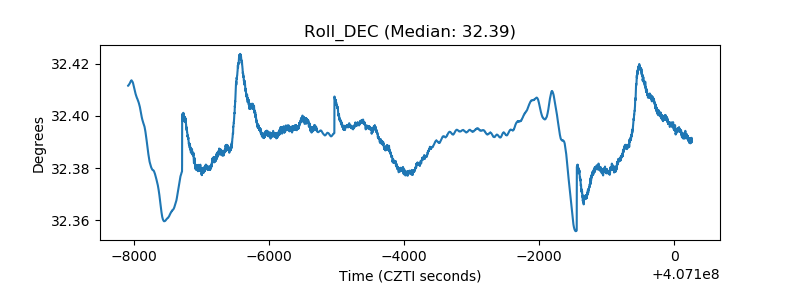 |
| _Roll_RA | 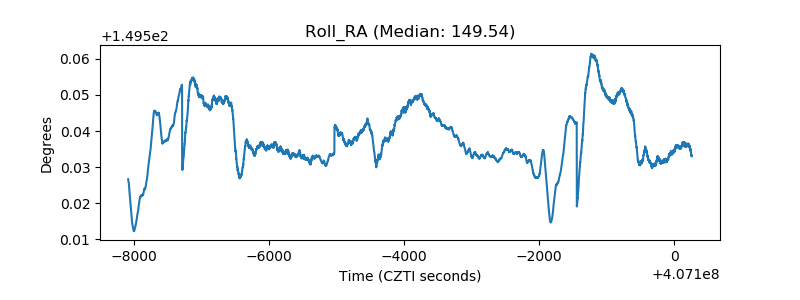 |
| Veto Counter | 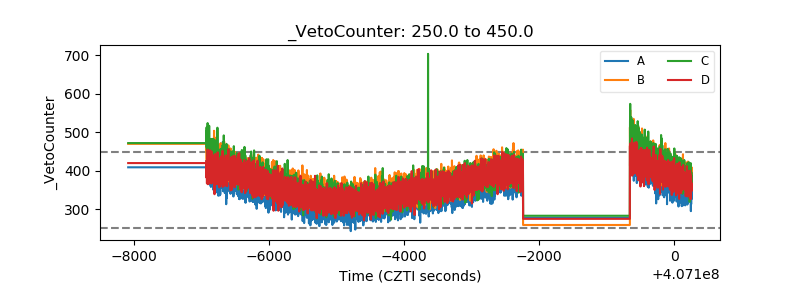 |