| Param | Original file | Final file |
|---|---|---|
| Filename | modeM0/AS1A12_054T01_9000005392_38718cztM0_level2.fits | modeM0/AS1A12_054T01_9000005392_38718cztM0_level2_quad_clean.evt |
| Size (bytes) | 603,380,160 | 79,398,720 |
| Size | 575.4 MB | 75.7 MB |
| Events in quadrant A | 2,976,296 | 643,800 |
| Events in quadrant B | 2,558,907 | 658,041 |
| Events in quadrant C | 3,085,561 | 622,833 |
| Events in quadrant D | 13,279,082 | 88,415 |
| Mode M9 | |||
|---|---|---|---|
| Quadrant | BADHDUFLAG | Total packets | Discarded packets |
| A | 0 | 33 | 0 |
| B | 0 | 33 | 0 |
| C | 0 | 33 | 0 |
| D | 0 | 33 | 0 |
| Mode SS | |||
|---|---|---|---|
| Quadrant | BADHDUFLAG | Total packets | Discarded packets |
| A | 0 | 116 | 0 |
| B | 0 | 116 | 0 |
| C | 0 | 116 | 0 |
| D | 0 | 116 | 0 |
| Mode M0 | |||
|---|---|---|---|
| Quadrant | BADHDUFLAG | Total packets | Discarded packets |
| A | 0 | 12402 | 3 |
| B | 0 | 11368 | 2 |
| C | 0 | 12727 | 2 |
| D | 0 | 43251 | 2 |
| Quadrant | Total seconds | Saturated seconds | Saturation percentage |
|---|---|---|---|
| A | 5587 | 35 | 0.626454% |
| B | 5587 | 10 | 0.178987% |
| C | 5587 | 69 | 1.235010% |
| D | 5587 | 4966 | 88.884911% |
Noise dominated data is calculated using 1-second bins in cleaned event files. If a bin has >2000 counts, and if more than 50% of those come from <1% of pixels, then it is considered to be noise-dominated and hence unusable.
| Quadrant | # 1 sec bins | Bins with >0 counts | Bins with >2000 counts | High rate bins dominated by noise | Noise dominated (total time) | Noise dominated (detector-on time) | Marked lightcurve |
|---|---|---|---|---|---|---|---|
| A | 8871 | 5589 | 15 | 15 | 0.17% | 0.27% | 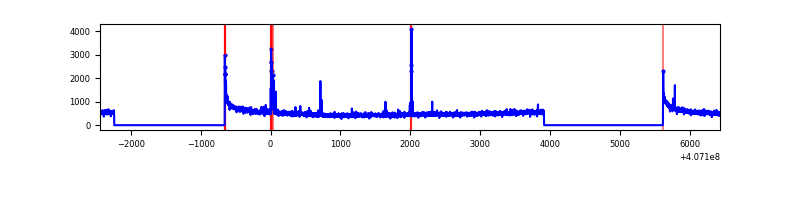 |
| B | 8871 | 5589 | 3 | 3 | 0.03% | 0.05% | 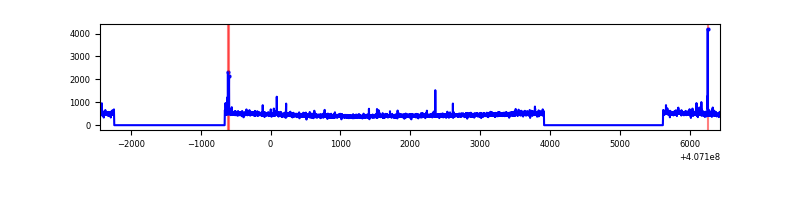 |
| C | 8871 | 5589 | 63 | 63 | 0.71% | 1.13% | 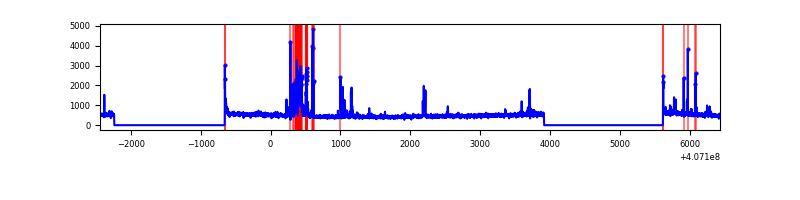 |
| D | 8871 | 5589 | 4370 | 4370 | 49.26% | 78.19% | 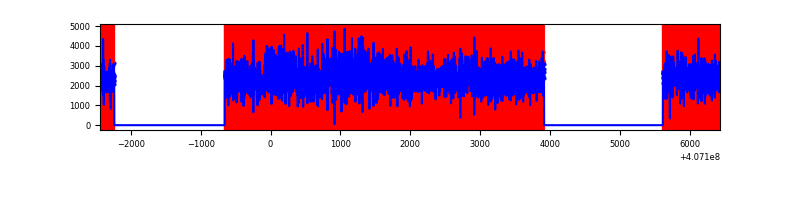 |
Top three noisy pixels from each quadrant. If the there are fewer than three noisy pixels in the level2.evt file, extra rows are filled as -1
| Pixel properties | Quadrant properties | ||||||
|---|---|---|---|---|---|---|---|
| Quadrant | DetID | PixID | Counts | Sigma | Mean | Median | Sigma |
| A | 10 | 83 | 395071 | 3050.41 | 633 | 620 | 129.3 |
| A | 9 | 143 | 78830 | 604.82 | 633 | 620 | 129.3 |
| A | 0 | 8 | 34099 | 258.9 | 633 | 620 | 129.3 |
| B | 4 | 171 | 31666 | 251.23 | 631 | 612 | 123.6 |
| B | 12 | 111 | 15485 | 120.32 | 631 | 612 | 123.6 |
| B | 0 | 213 | 14380 | 111.38 | 631 | 612 | 123.6 |
| C | 14 | 254 | 304899 | 2102.14 | 617 | 620 | 144.7 |
| C | 15 | 214 | 231250 | 1593.33 | 617 | 620 | 144.7 |
| C | 15 | 208 | 111013 | 762.66 | 617 | 620 | 144.7 |
| D | 12 | 235 | 7511446 | 75648.36 | 401 | 389 | 99.3 |
| D | 2 | 16 | 3849911 | 38770.84 | 401 | 389 | 99.3 |
| D | 10 | 118 | 138754 | 1393.56 | 401 | 389 | 99.3 |
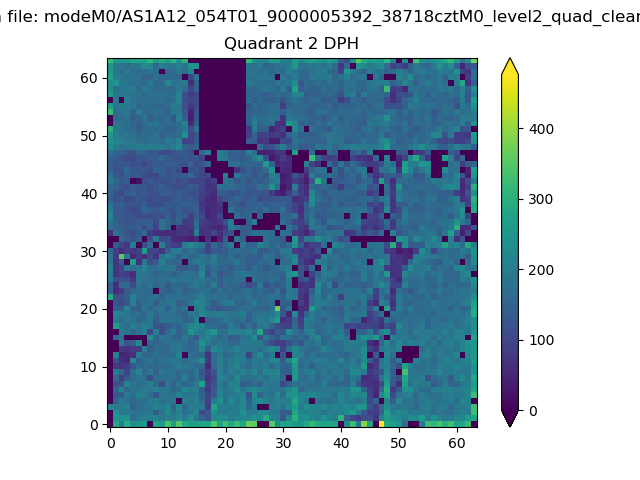
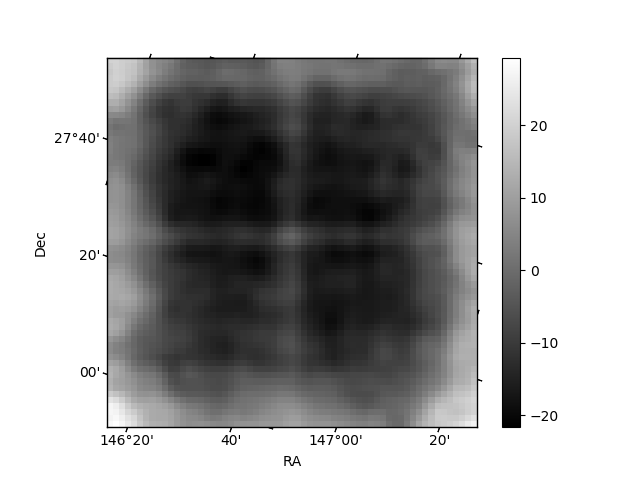
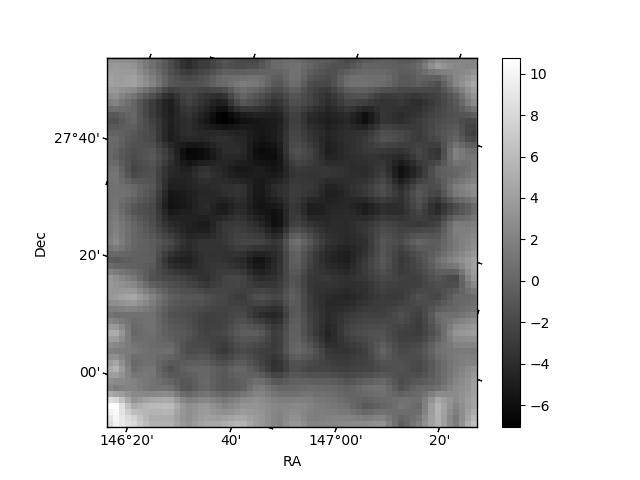
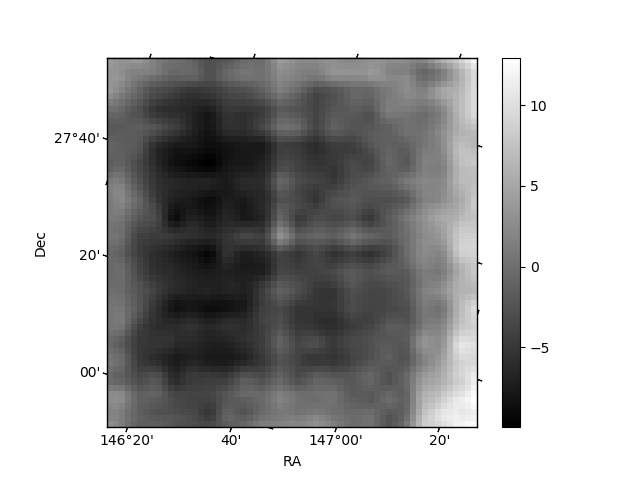
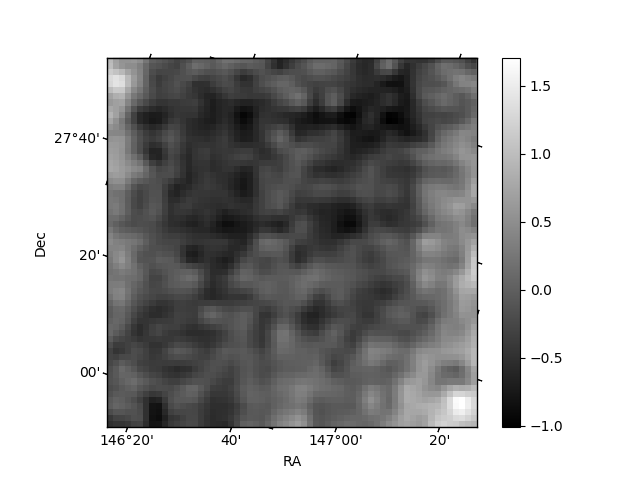
Histogram calculated using DETX and DETY for each event in the final _common_clean file
| Quadrant A | 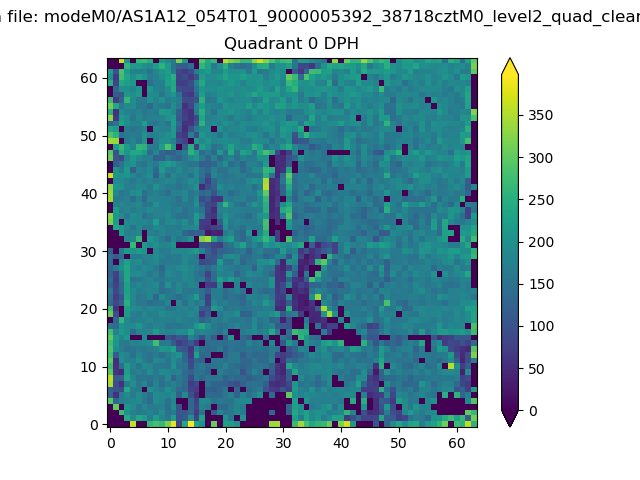 |
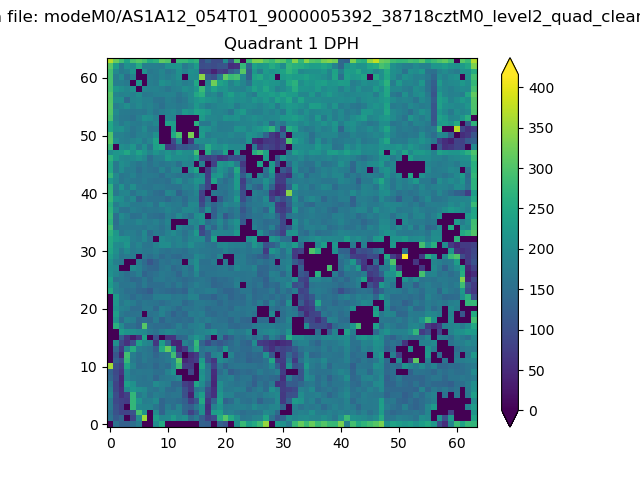 |
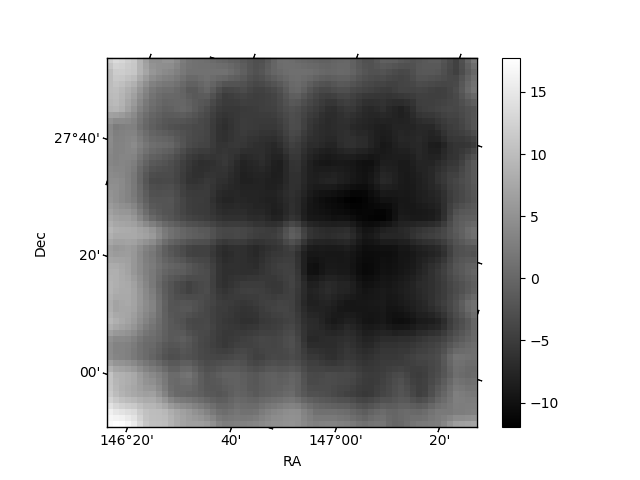
Quadrant B |
|---|---|---|---|
| Quadrant D | 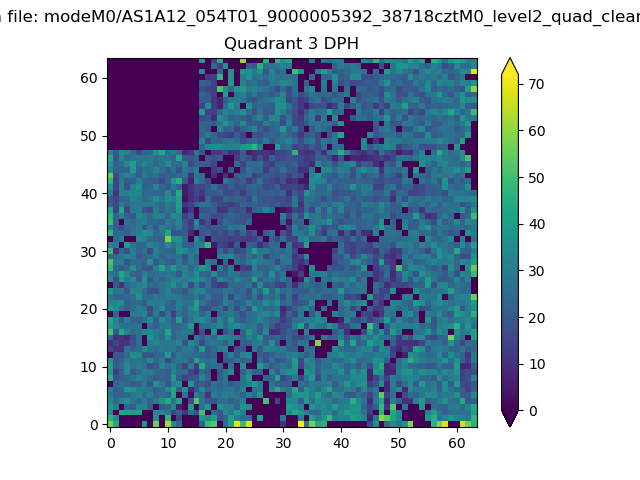 |
 |
Quadrant C |
| Plot type | Count rate plots | Images |
|---|---|---|
| Comparison with Poisson distribution Blue bars denote a histogram of data divided into 1 sec bins. Red curve is a Poisson curve with rate = median count rate of data. |
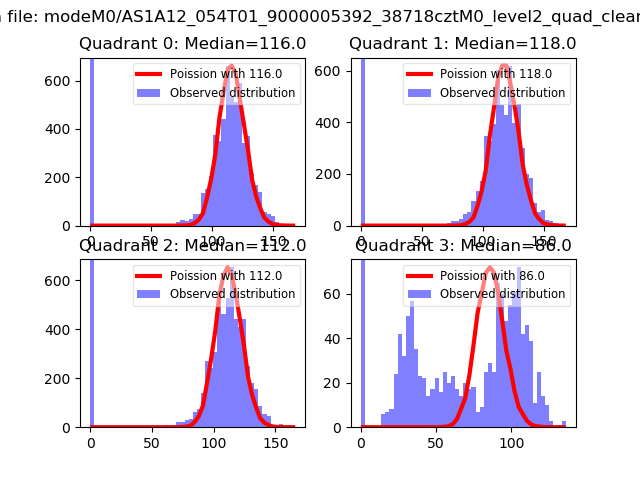 |
 |
| Quadrant-wise count rates Data is divided into 100 sec bins |
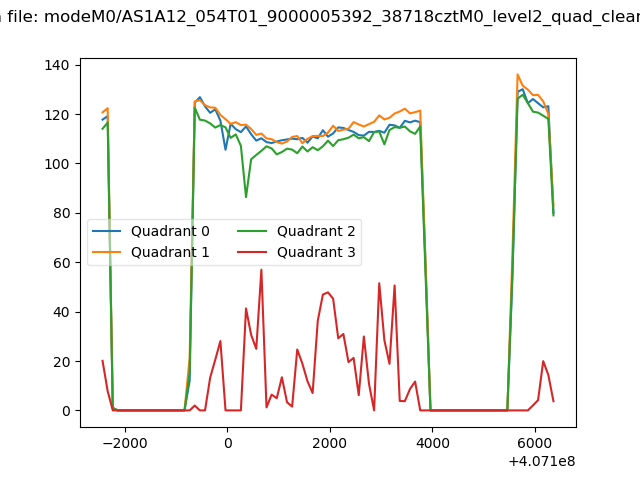 |
|
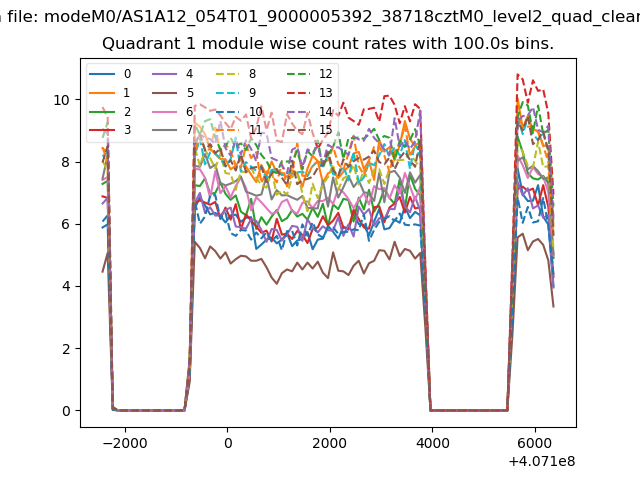
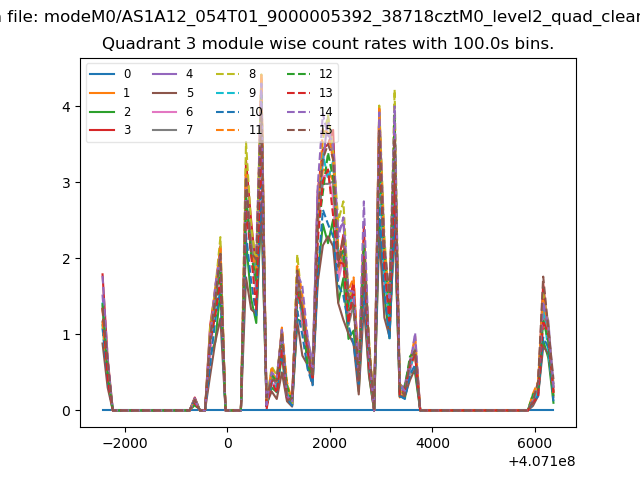
| Module-wise count rates for Quadrant A Data is divided into 100 sec bins |
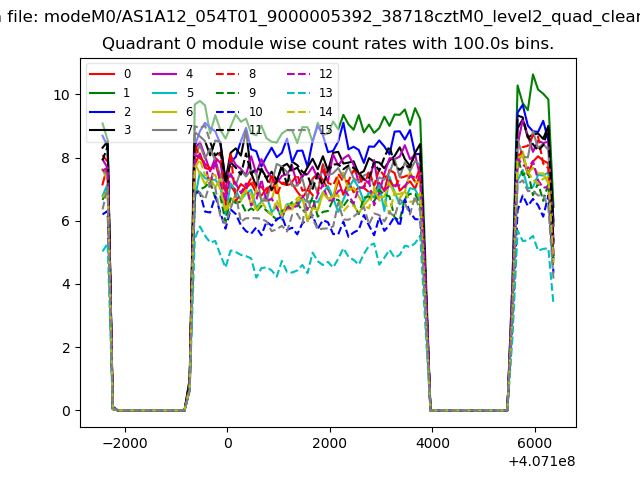 |
 |
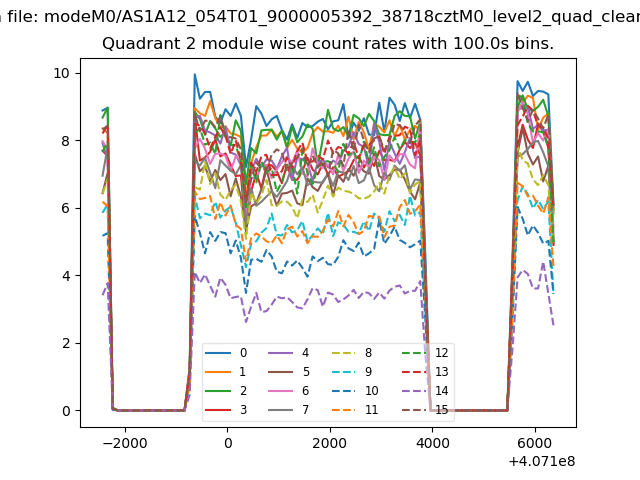
| Module-wise count rates for Quadrant B Data is divided into 100 sec bins |
 |
 |
| Module-wise count rates for Quadrant C Data is divided into 100 sec bins |
 |
 |
| Module-wise count rates for Quadrant D Data is divided into 100 sec bins |
 |
 |
| Parameter | Plot |
|---|---|
| CZT HV Monitor | 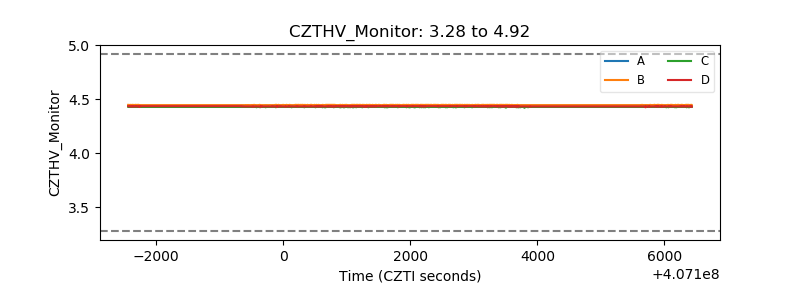 |
| D_VDD | 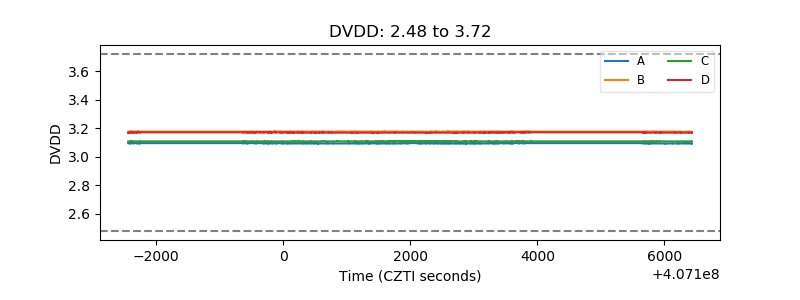 |
| Temperature 1 | 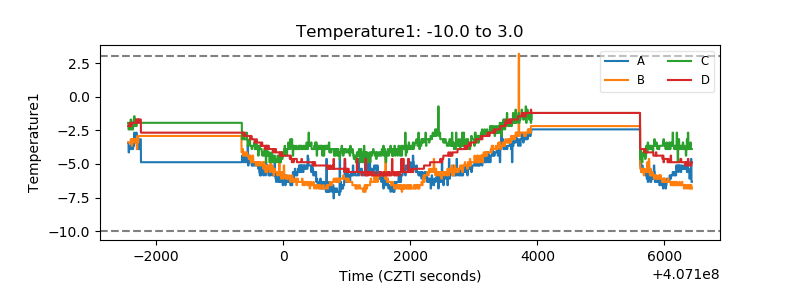 |
| Veto HV Monitor | 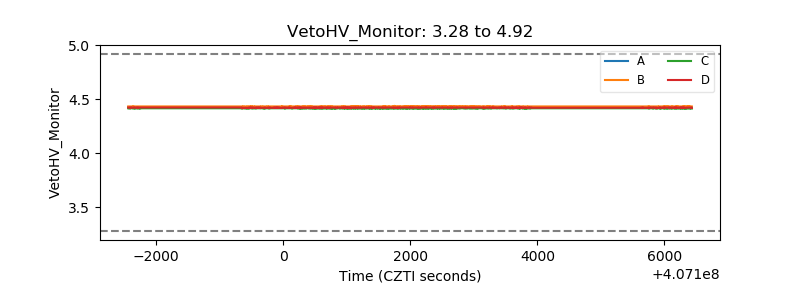 |
| Veto LLD | 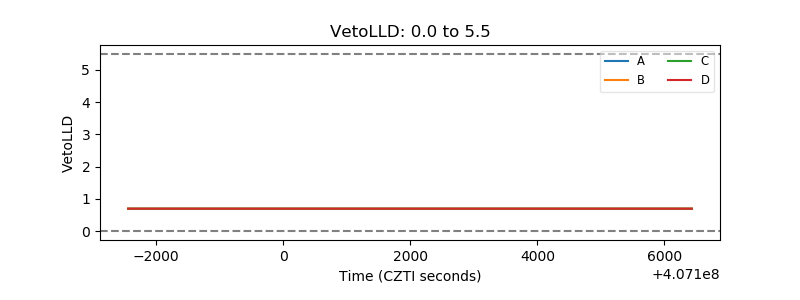 |
| Alpha Counter | 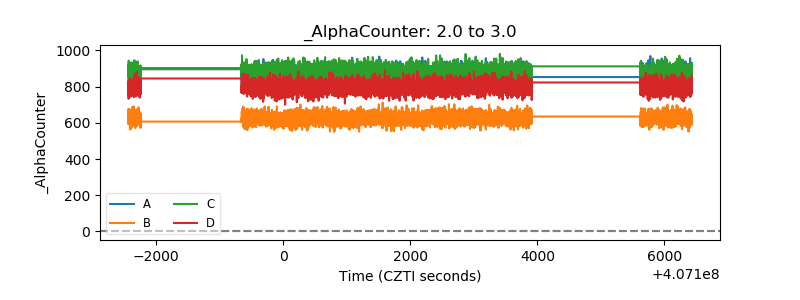 |
| _CPM_Rate | 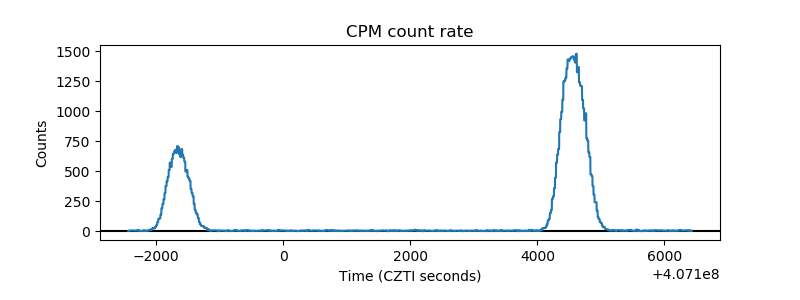 |
| CZT Counter |  |
| +2.5 Volts monitor | 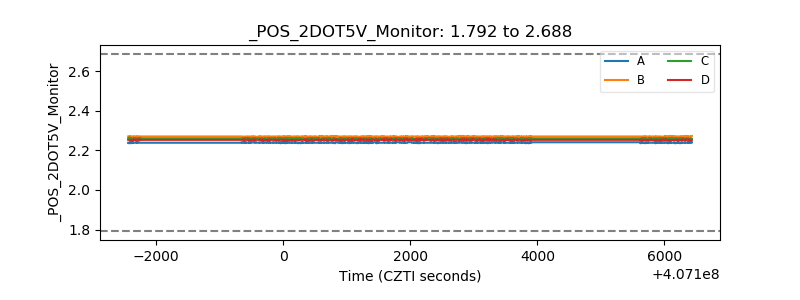 |
| +5 Volts monitor | 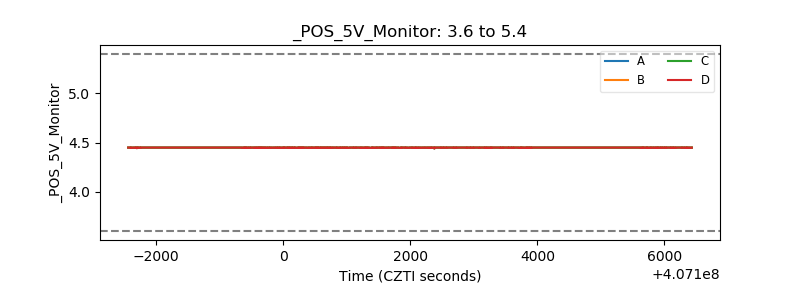 |
| _ROLL_ROT | 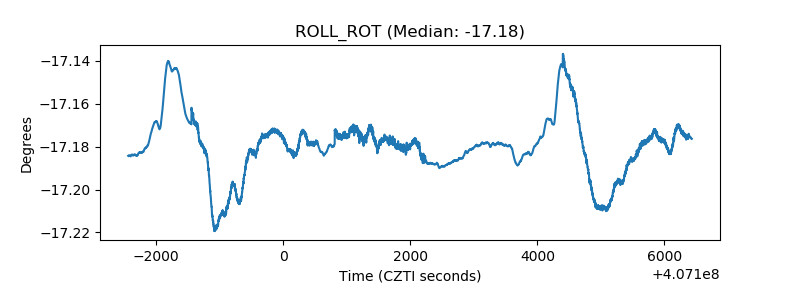 |
| _Roll_DEC |  |
| _Roll_RA | 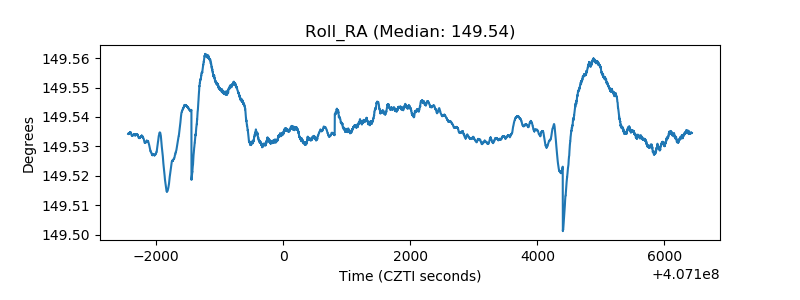 |
| Veto Counter | 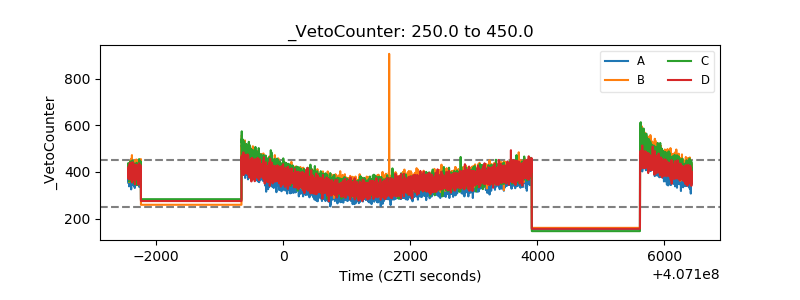 |